


“A lot of investors have no clue what they’re investing in, but set very extreme expectations … almost like they are in a casino.”
— Hock Tan, CEO of Broadcom, October 2026 (paraphrased)

Breadth is breaking: Beneath resilient headline indices, an increasing number of stocks are already in correction or bear market territory.
Complacency reigns: Despite mounting warning signs, speculative positioning remains elevated and volatility surprisingly subdued.
Debt is biting: From French sovereign bonds to AI infrastructure financing, credit markets are showing increasingly worrying cracks.
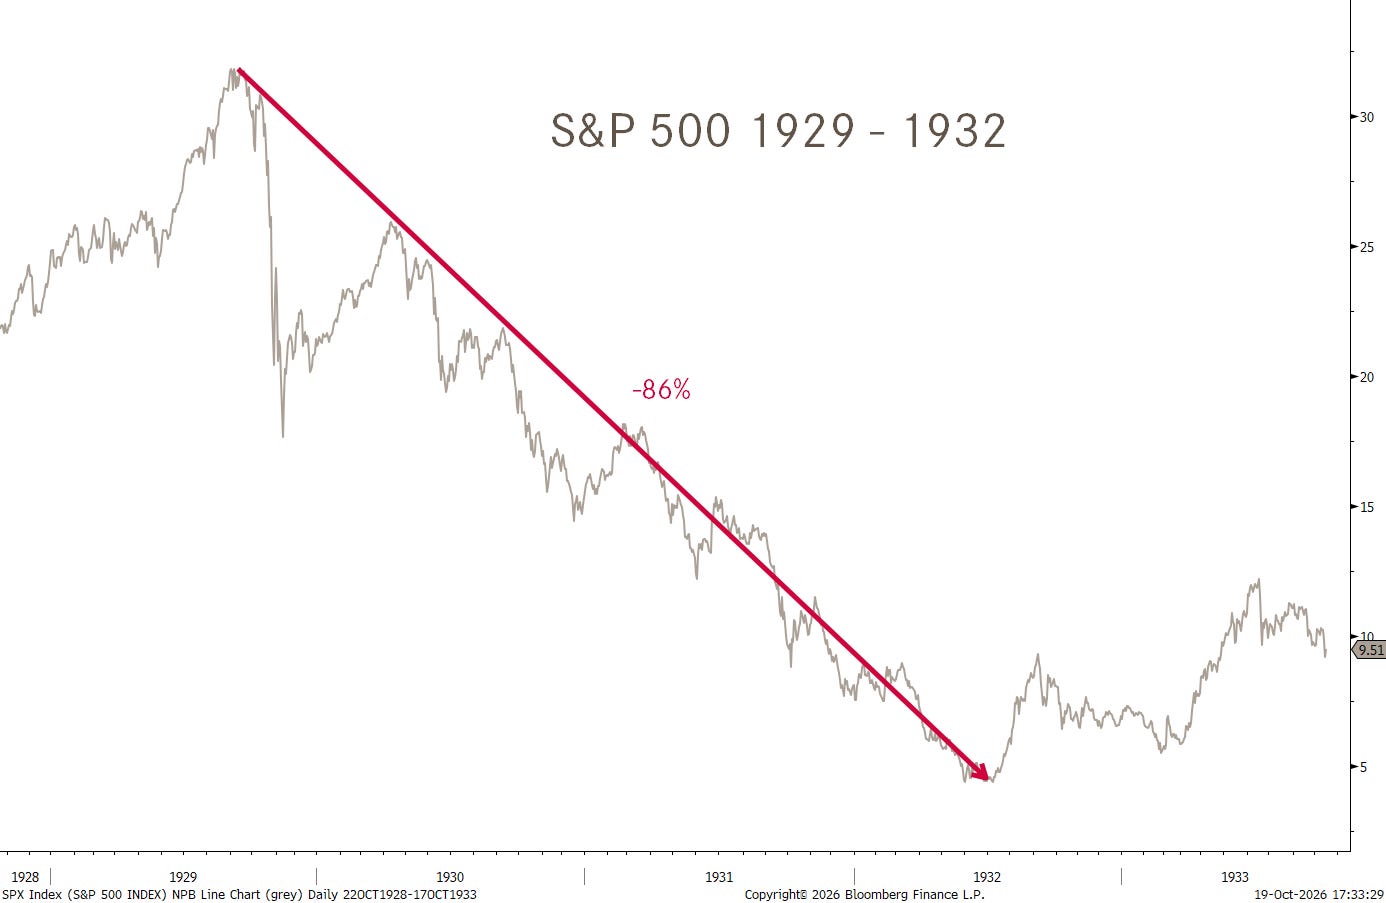
1966, not 1929? The next secular bear market may be a long, volatile sideways grind rather than a spectacular crash. A stock picker’s paradise?

It’s all over.*
The only question remaining is: Is it the end of the cyclical or the secular bull equity cycle?
I know - strong words for a Monday afternoon. But at least I got your attention now.
But, and on a more serious note, chances for a deeper equity market correction have increased over the past few weeks.
Why?
Too bad market breadth? Too much complacency? Too high bond yields? Too much midterm uncertainty? Too much government debt (US/EU)? Too much corporate debt (Coreweave et al.)? Too high earnings expectations? Too often social unrest?
Maybe some of the above, maybe all of the above.
Let’s have a look at some of them together.
BREADTH
In the S&P 1,500 Composite index, an index covering US large-, mid- and small-cap equities in the US, less than 50% of its constituents are above their 200-day moving average:
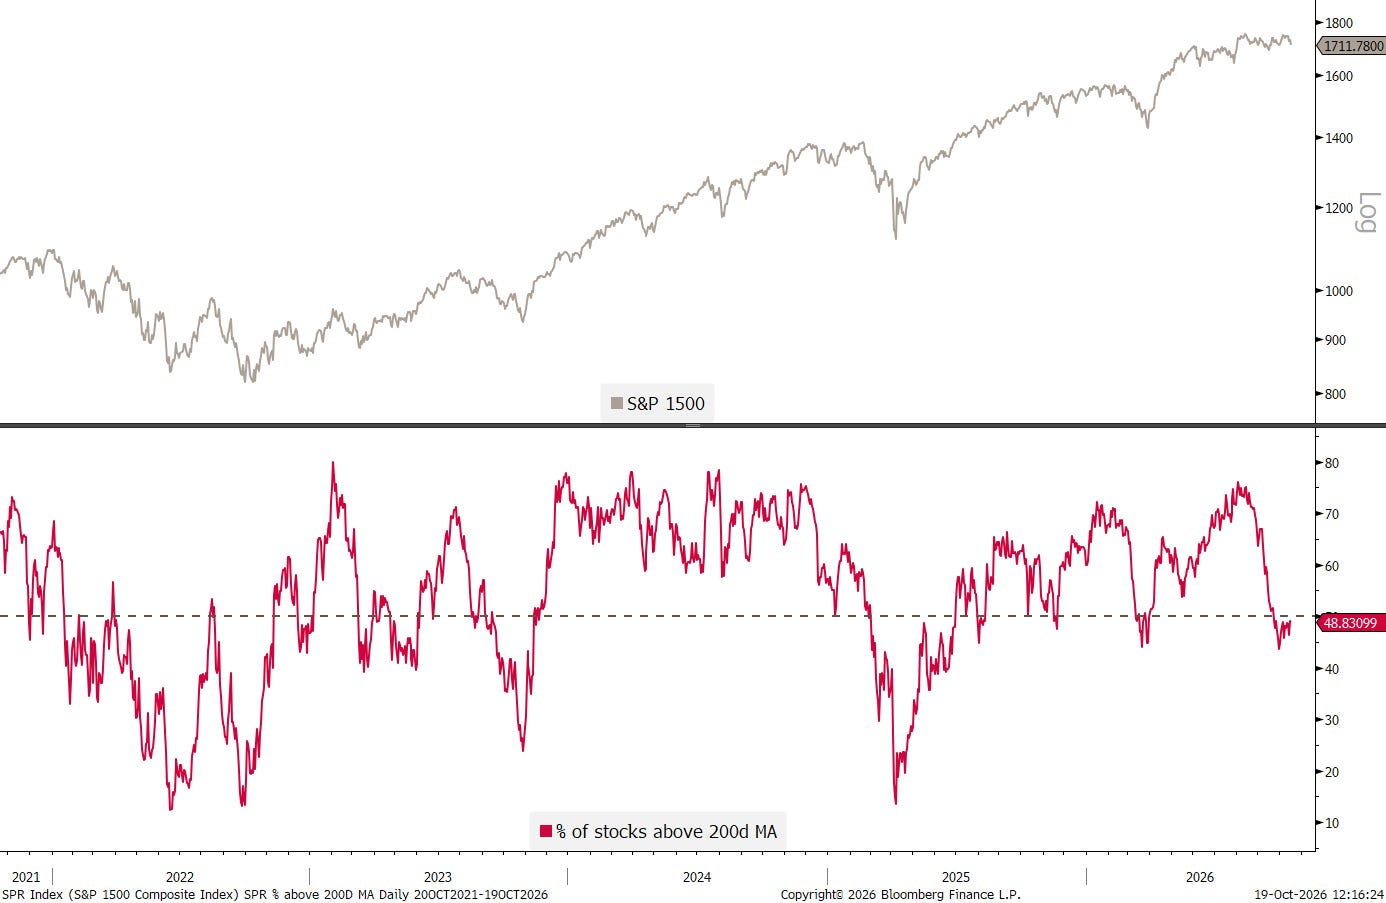
What is surprising is that the index is less than 2.5% from its all-time high away - something seems to be off here.
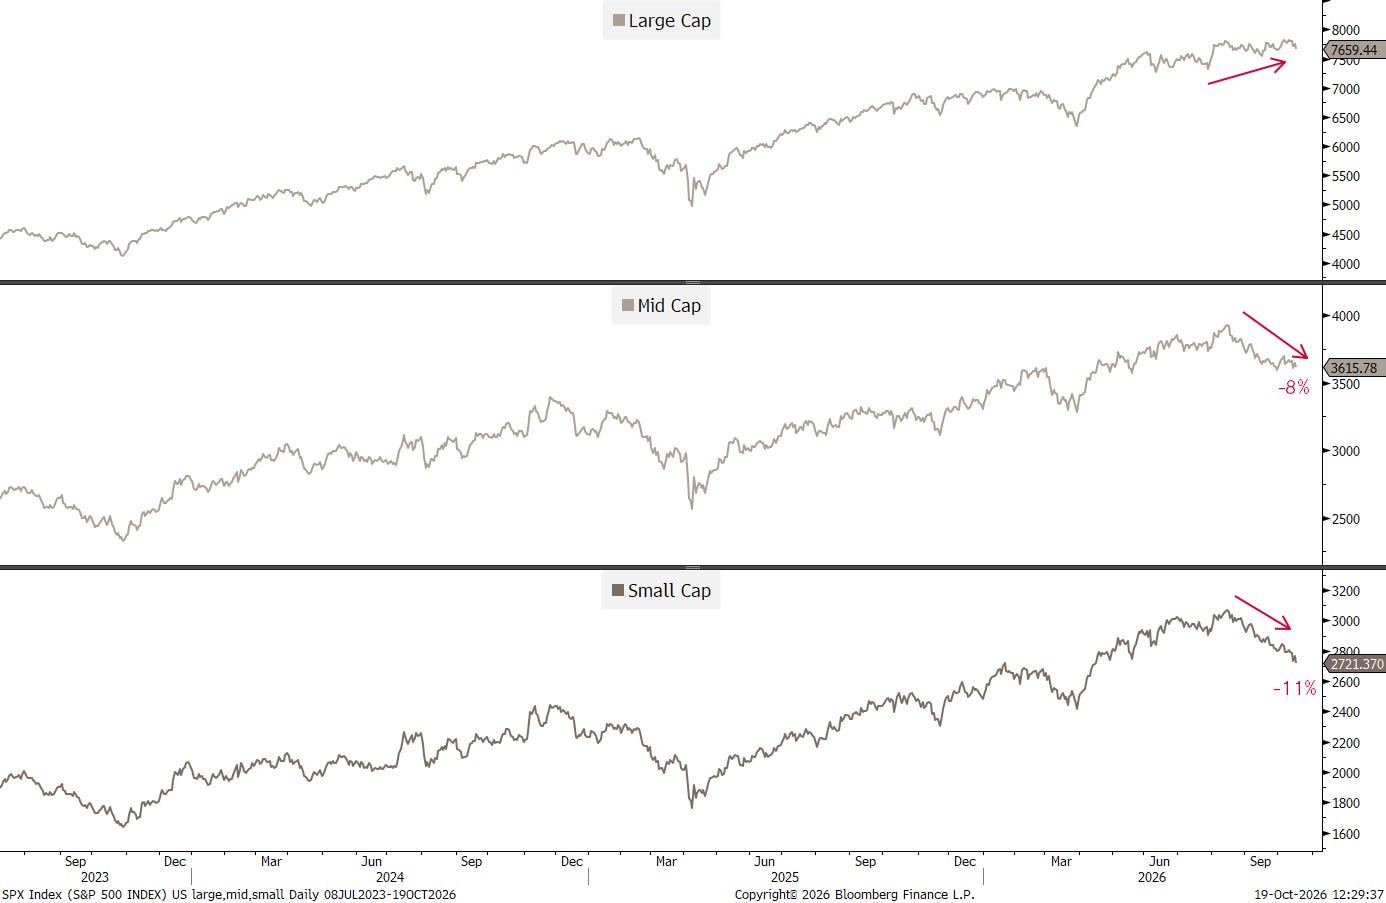
If we break down the three indices in the composite above, we of course immediately recognise that it is the mid- and small cap stocks which are in at or close to correction (-10%) territory:
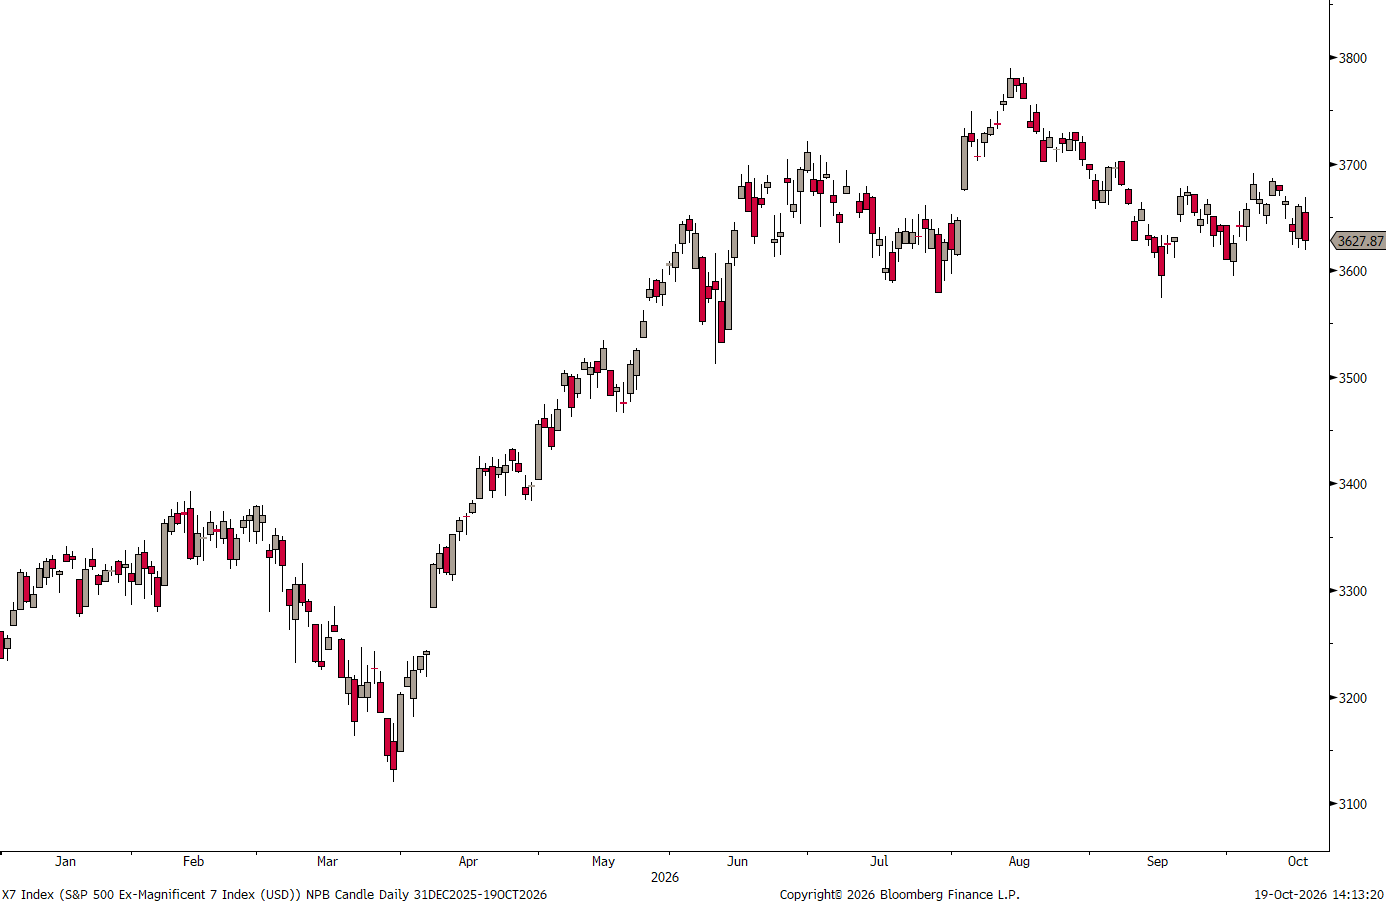
But even large cap stocks, one we remove the Magnificent Seven and only look at the X7 Index (S&P 500 minus 7 Mags) the previously bullish picture changes to somewhat less bullish:
An equal-weight market carpet with three months performance shows a lot of red and a lot of double-digit red too:
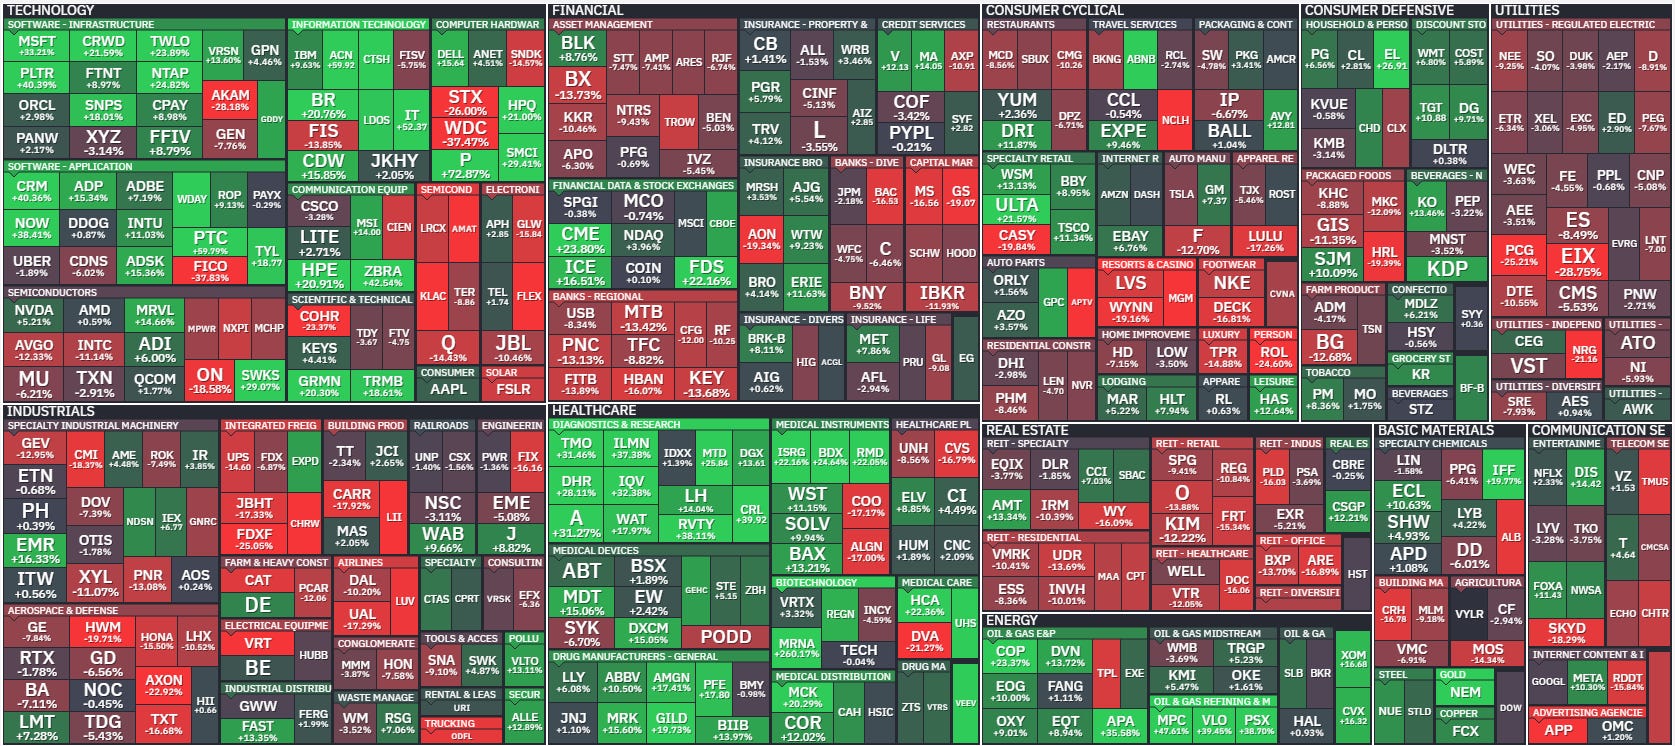
In the S&P 500, on a year-to-date basis,
38% of stocks are negative
25% of stocks are in a correction (minus 10% or more)
12% of stocks are in bear market (minus 20% or more)
And all of this, before we even look at the more volatile corners of the market.
Such as the Nasdaq 100 for example:
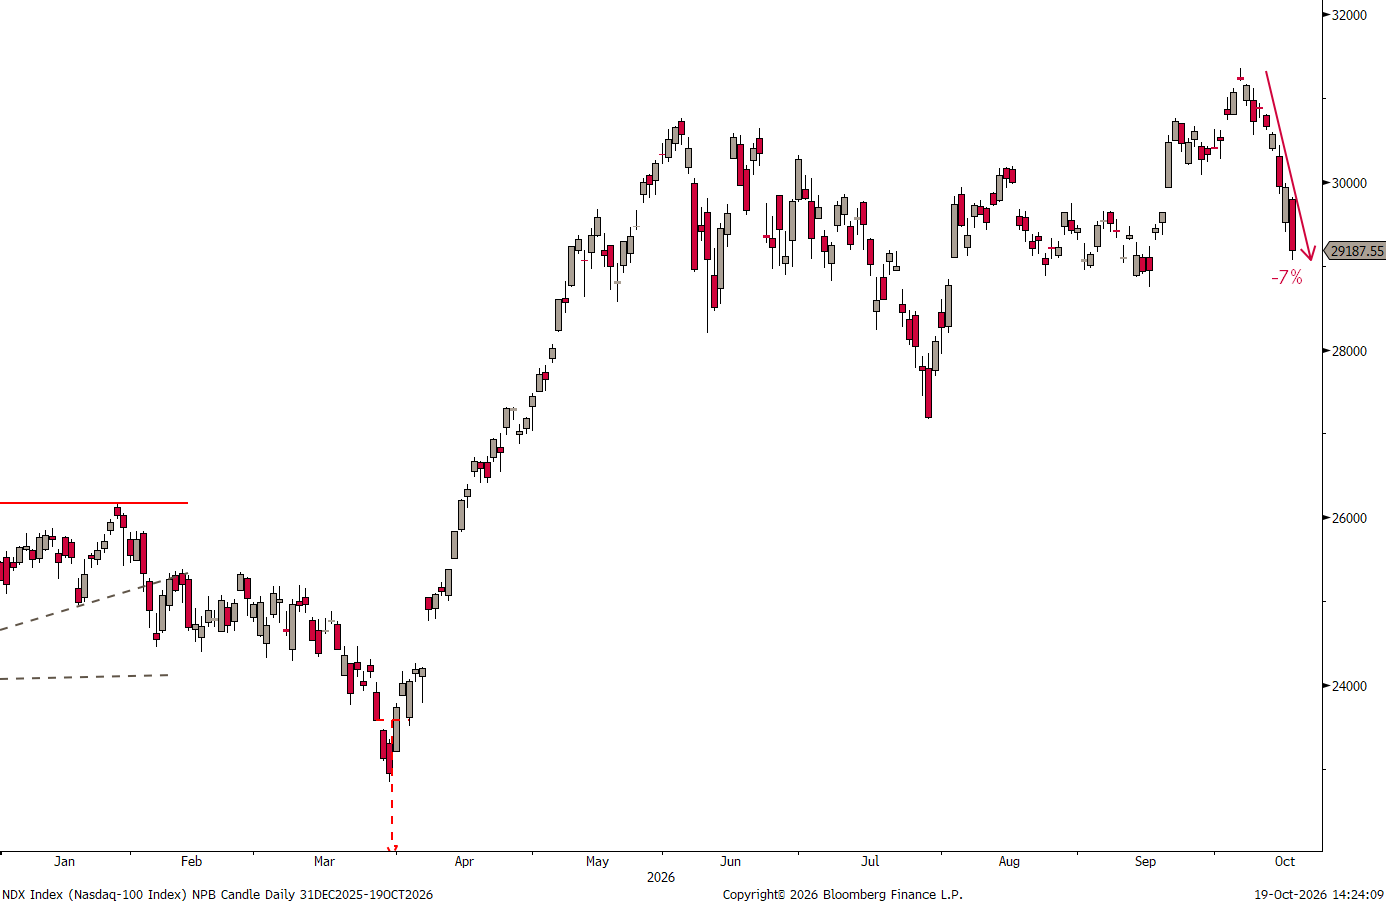
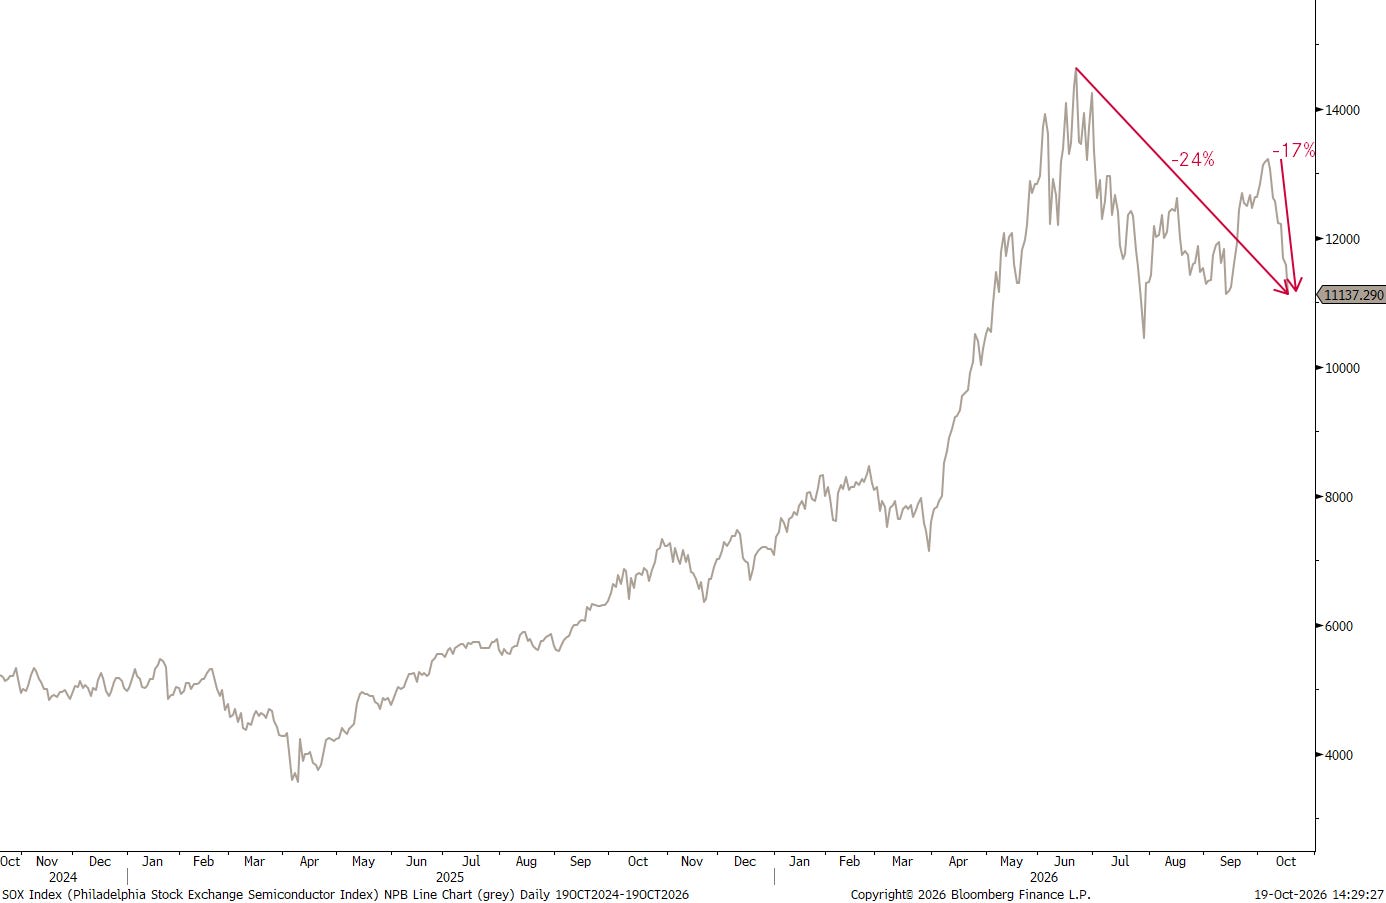
Or the Philadelphia Semiconductor index, commonly known as the SOX, which starts to smell rather a lot like a bubble burst:
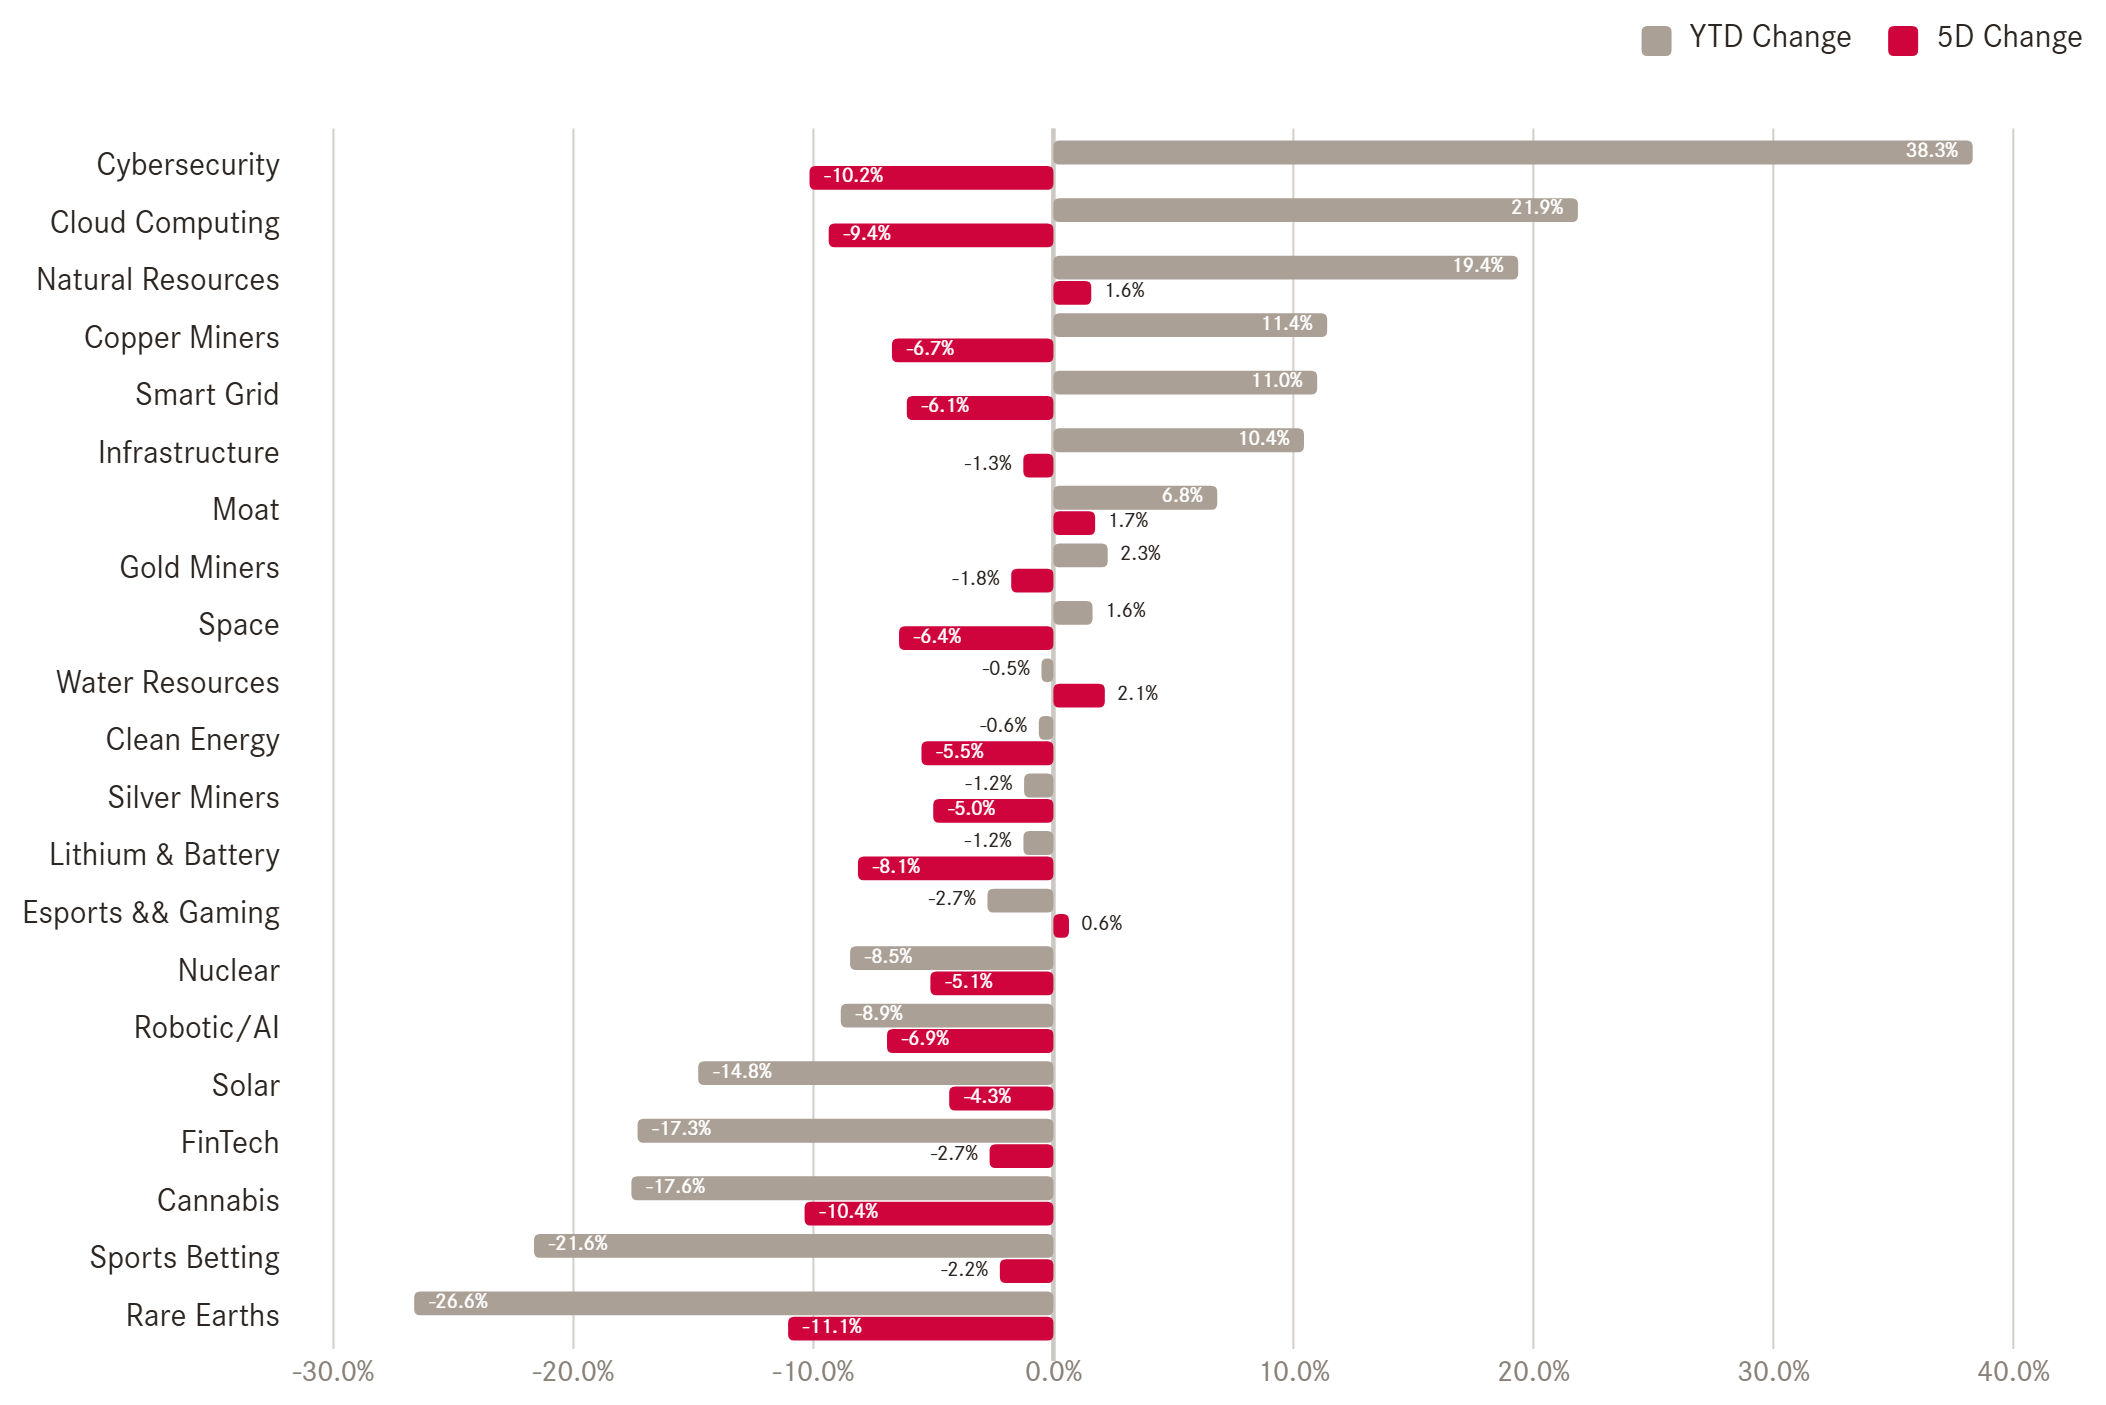
It was a difficult week for many popular themes:
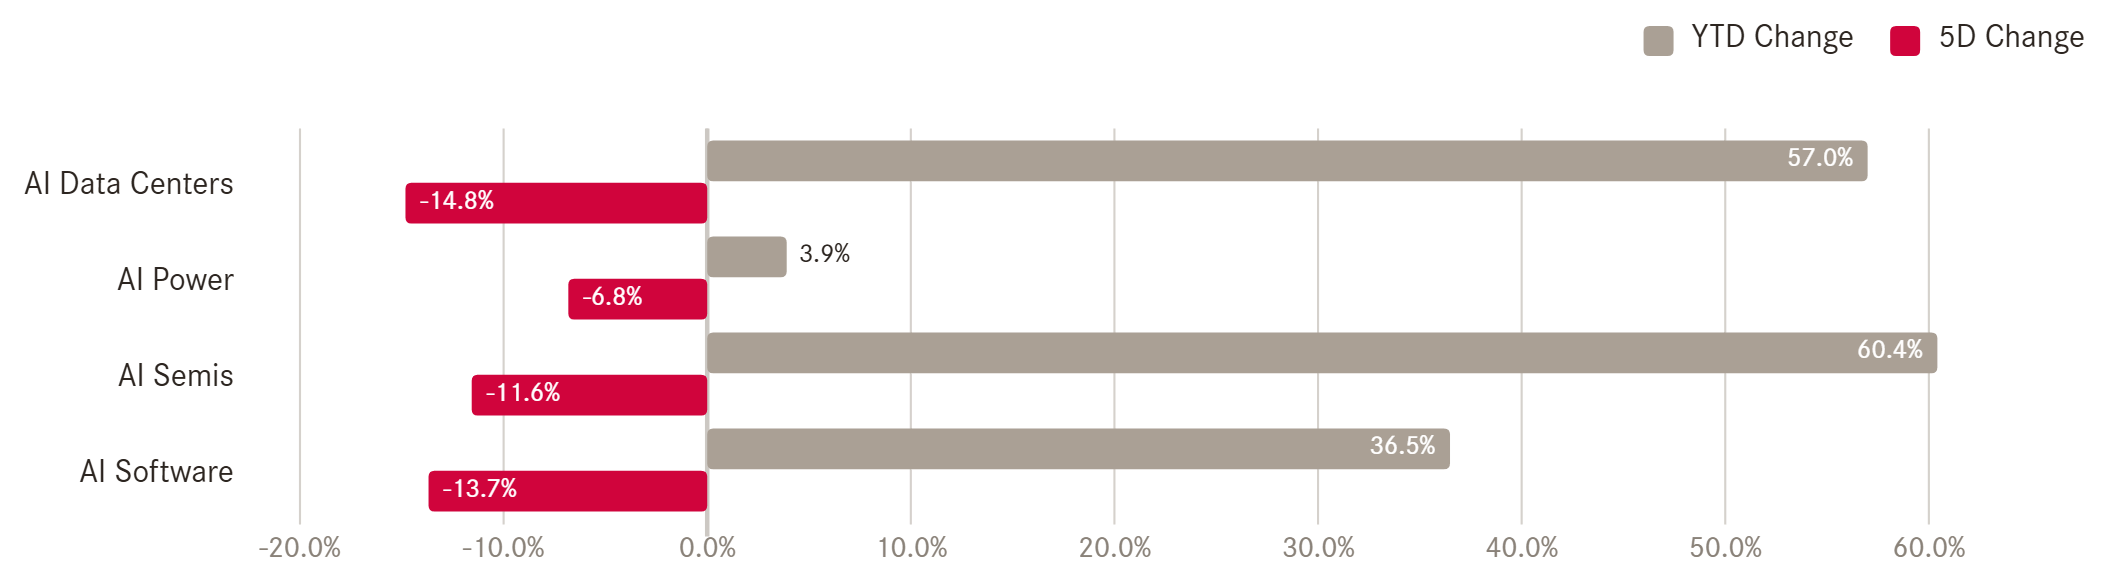
But especially the AI trade:
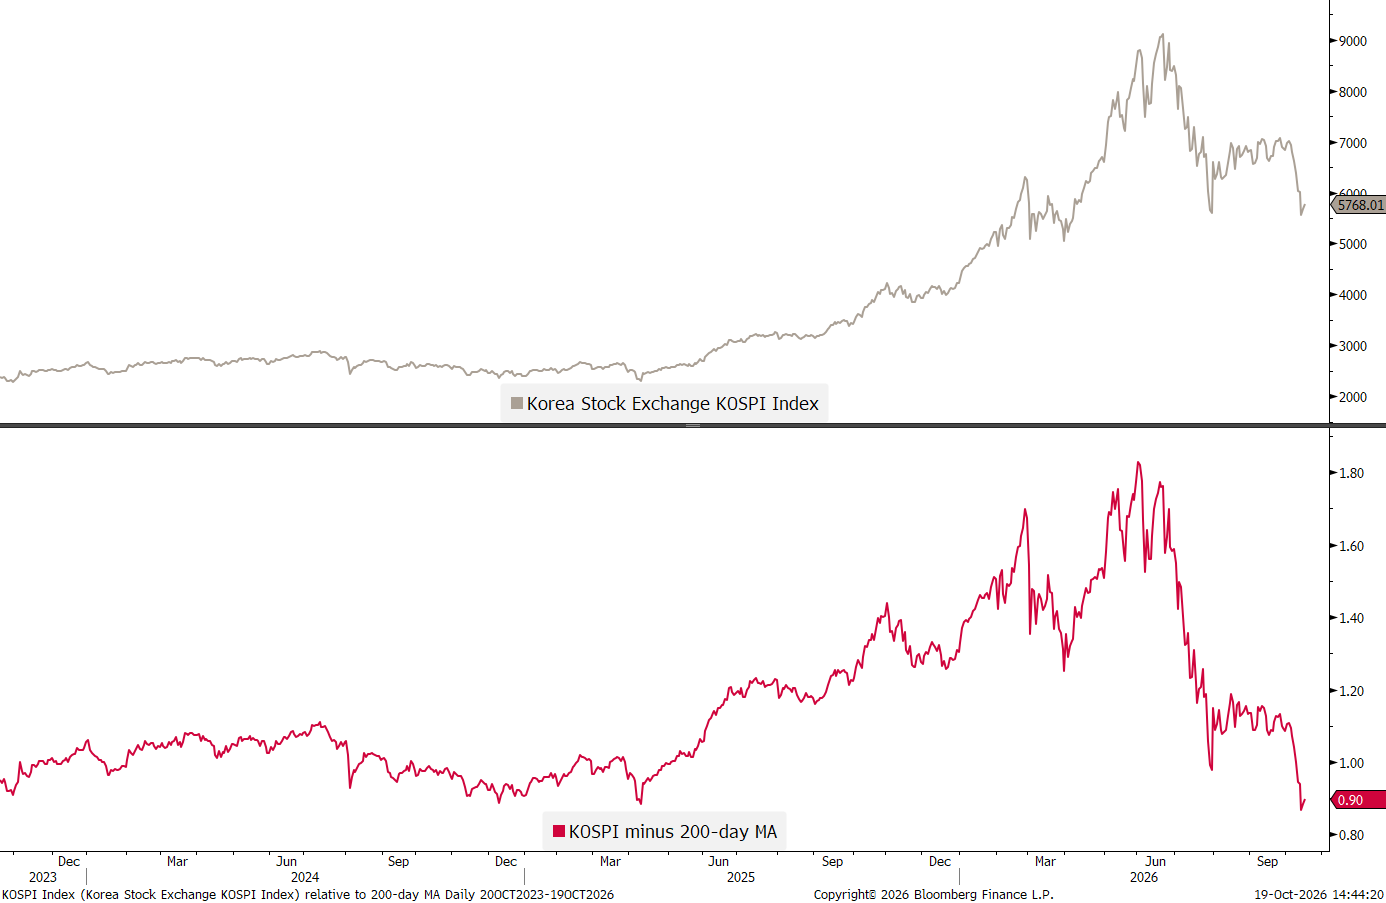
Korea’s KOSPI index, heavily exposed to memory chip makers, has fully reversed its distancing from 200-day moving average (bottom clip) and an overshoot to the downside is now the danger:
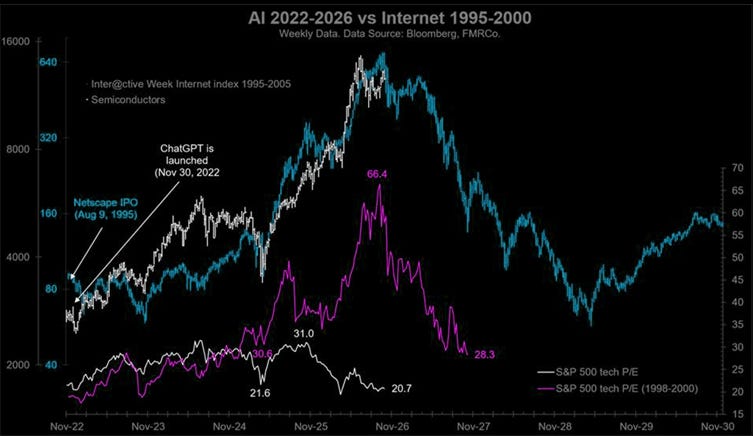
And then, as usual when markets get a bit wobbly, someone throws in this comparison chart again:
COMPLACENCY
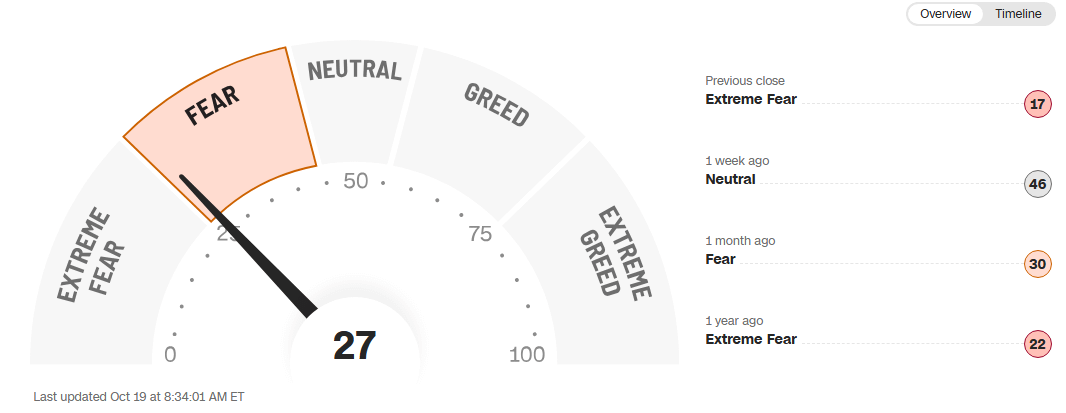
So, are investors scared stiff now?
CNN’s Greed and Fear would suggest that yes, investors are somewhat weary:
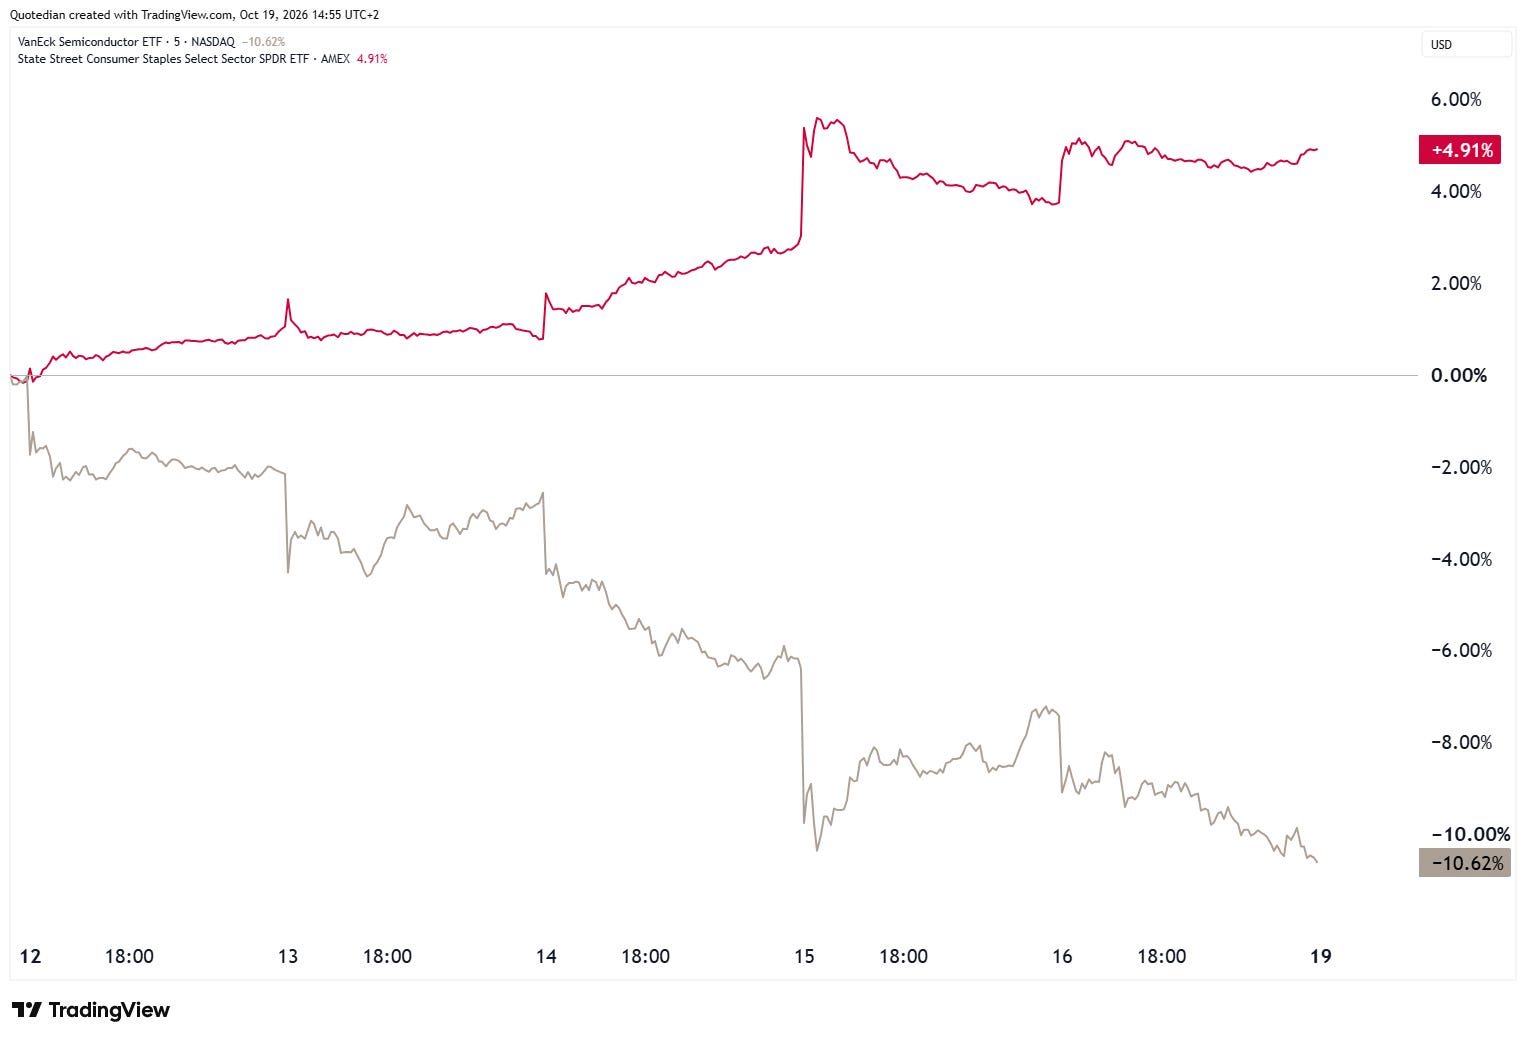
We could even (try and) argue that investors are rational (ehem), and are switching out of volatile semiconductor stocks (SMH, grey) into defensive consumer staples (XLP, red) stocks:
But then the following chart of the three times leveraged SOX index ETF throws that tale of caution immediately and completely out of the window:
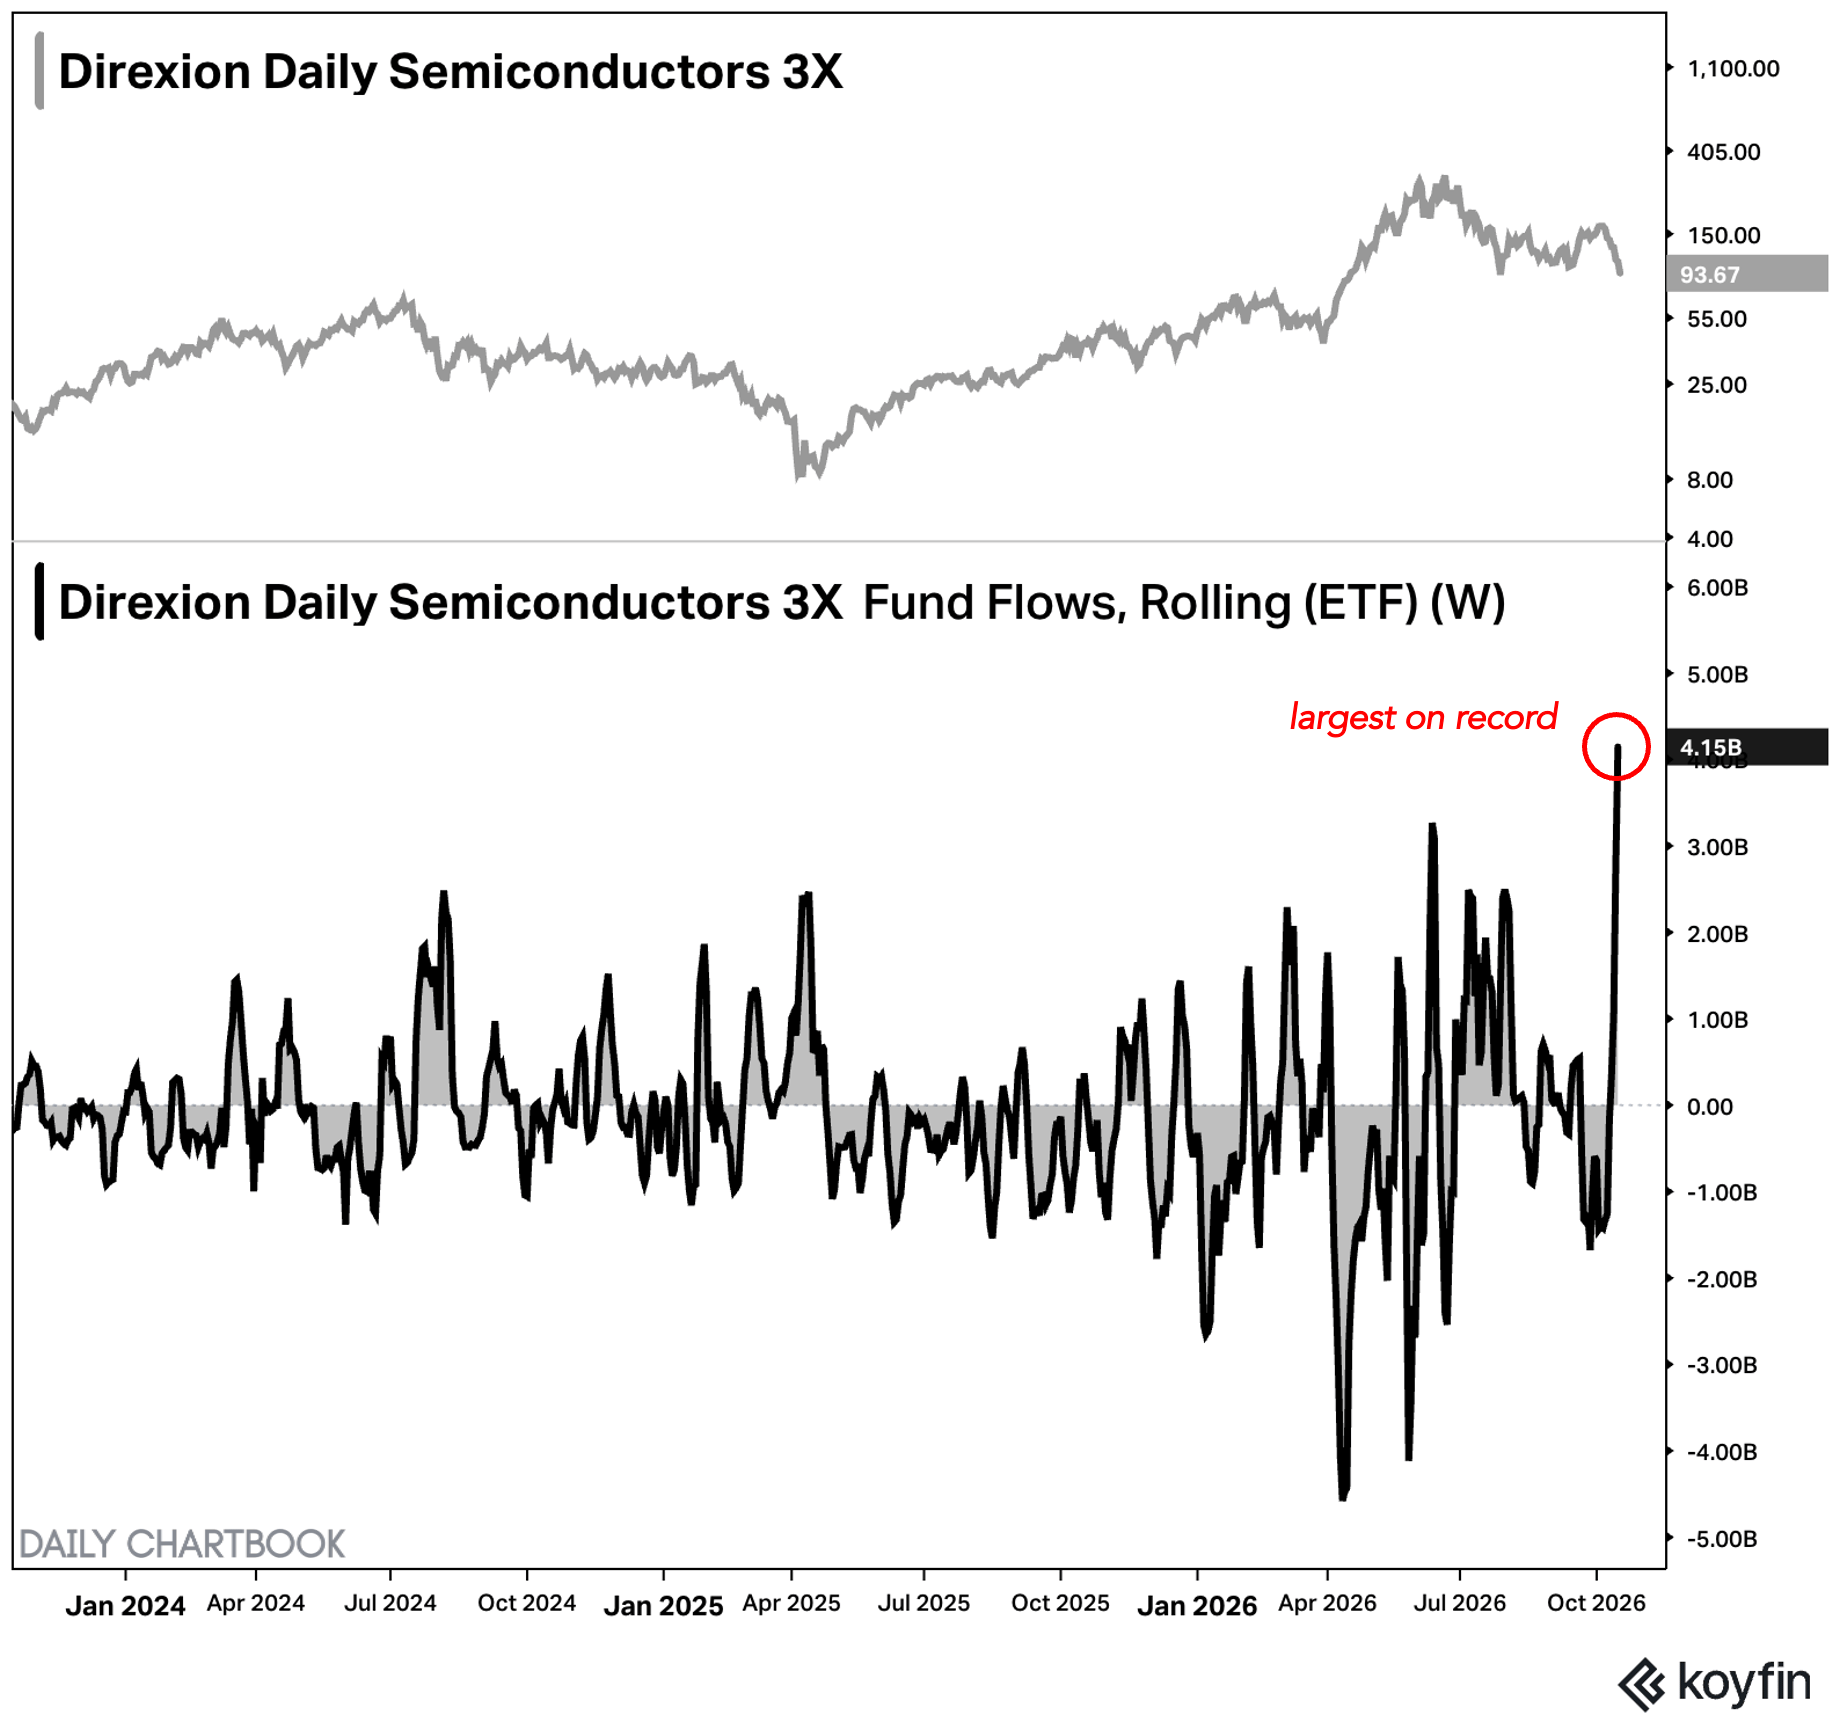
YOLO, FOMO and GERONIMO all at once!
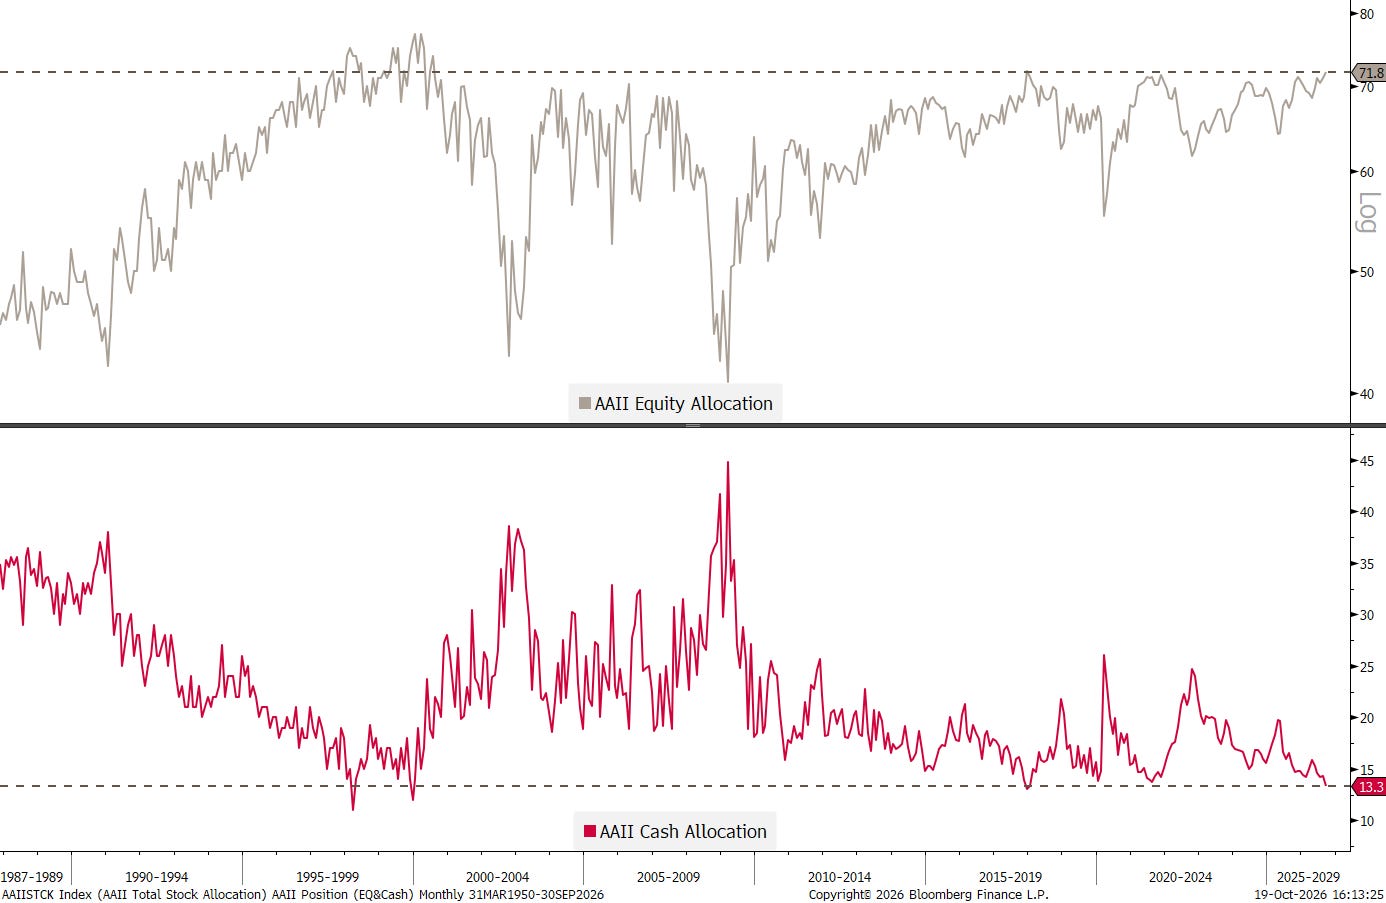
And the chart of the positioning of members of the American Association of Individual Investors (AAII) also shows that the retail cohort is full in:
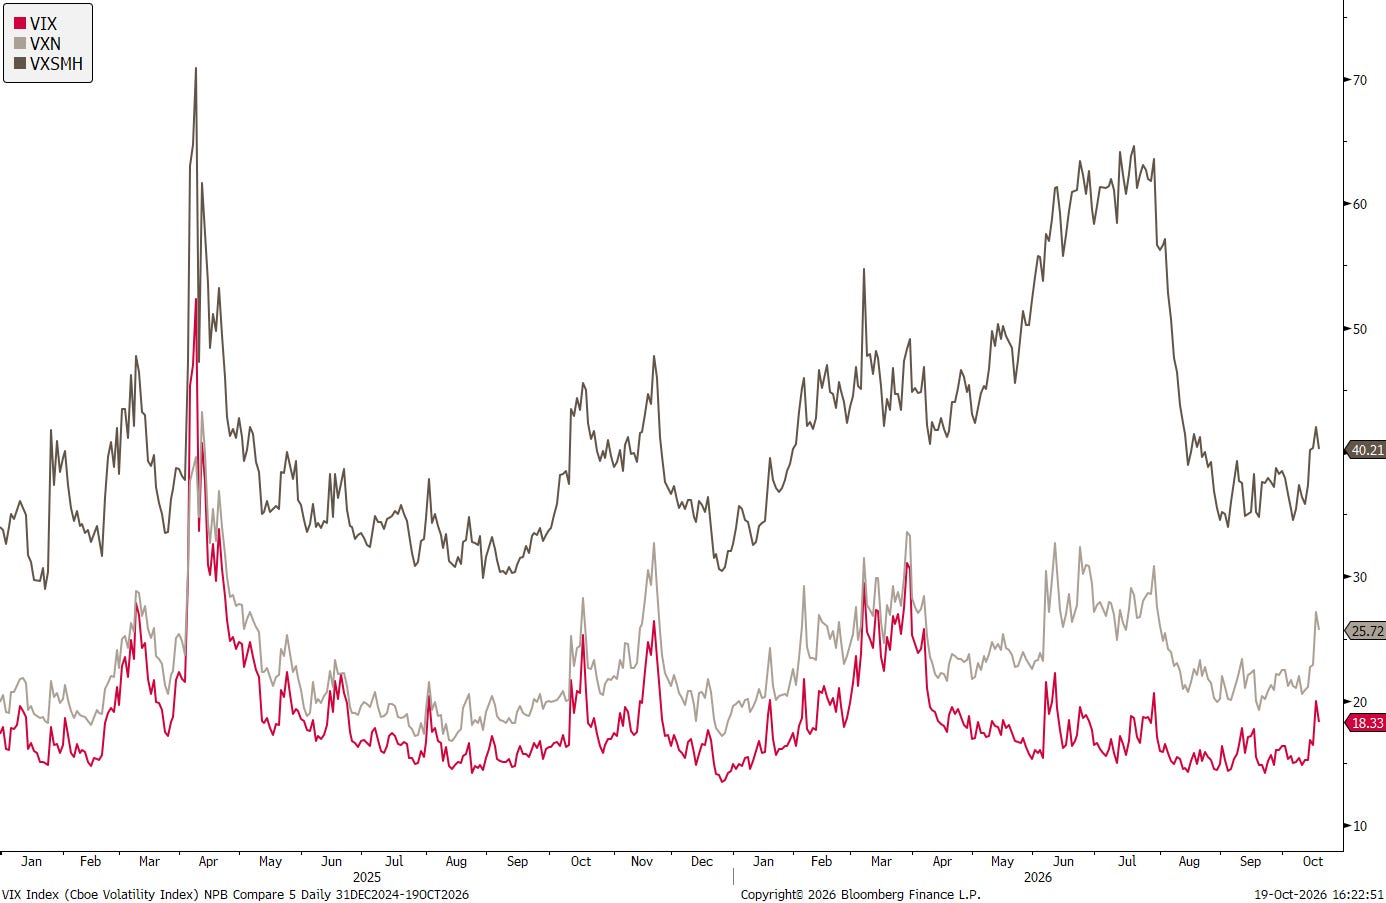
S&P 500 volatility, as measured by the VIX, also seems somewhat do laidback, especially also in comparison to Nasdaq (VXN) and Semiconductor (VXSMH) volatility:
UNREST
Things are not good in Europe and especially not good in France. When there´s acronyms, you know Europe´s having a debt crisis and somebody came up with what FROGS stands for:
French Oversized Government and Social Security
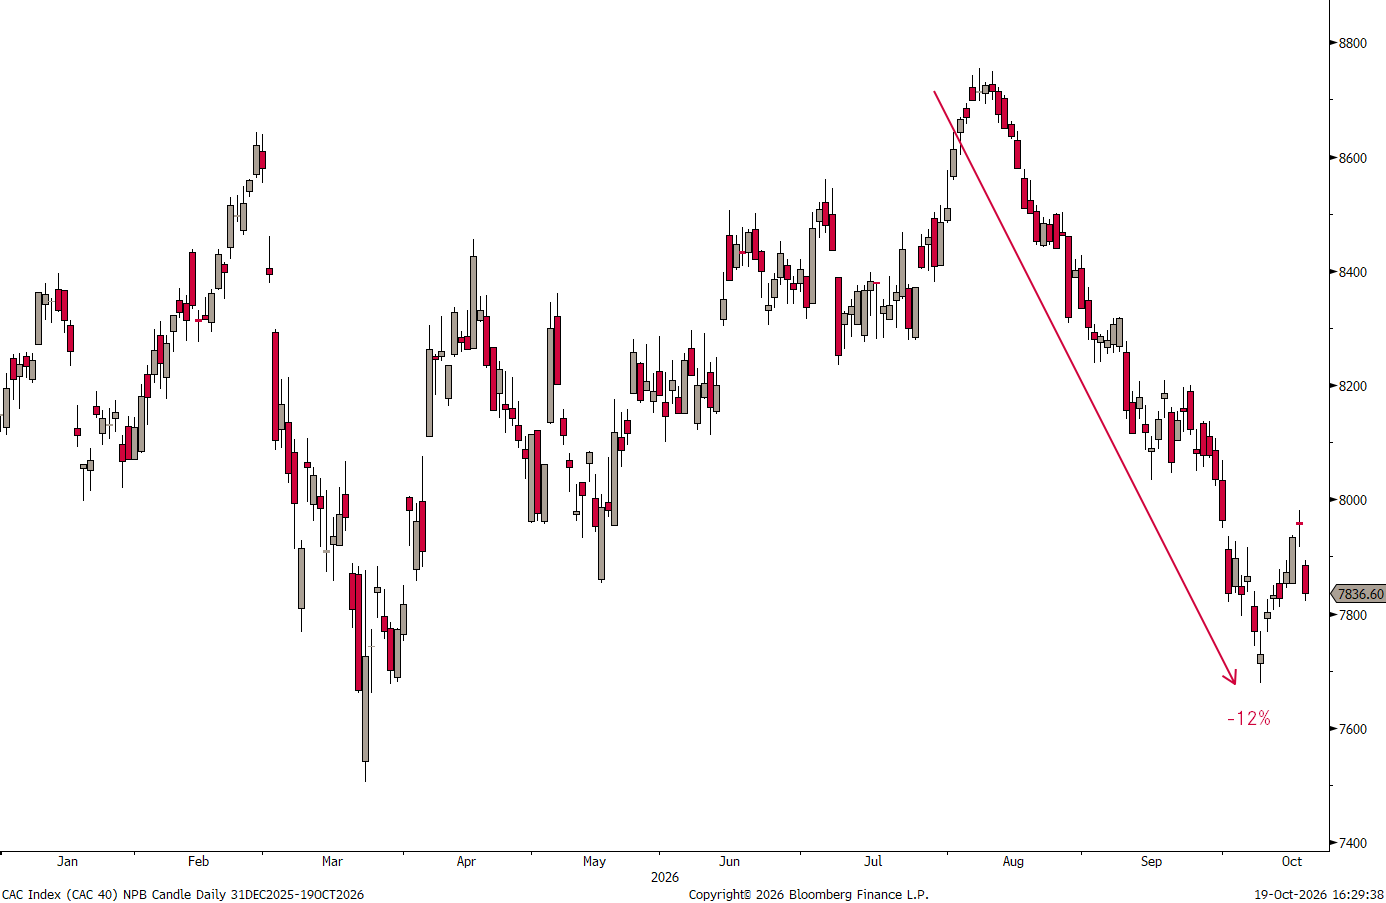
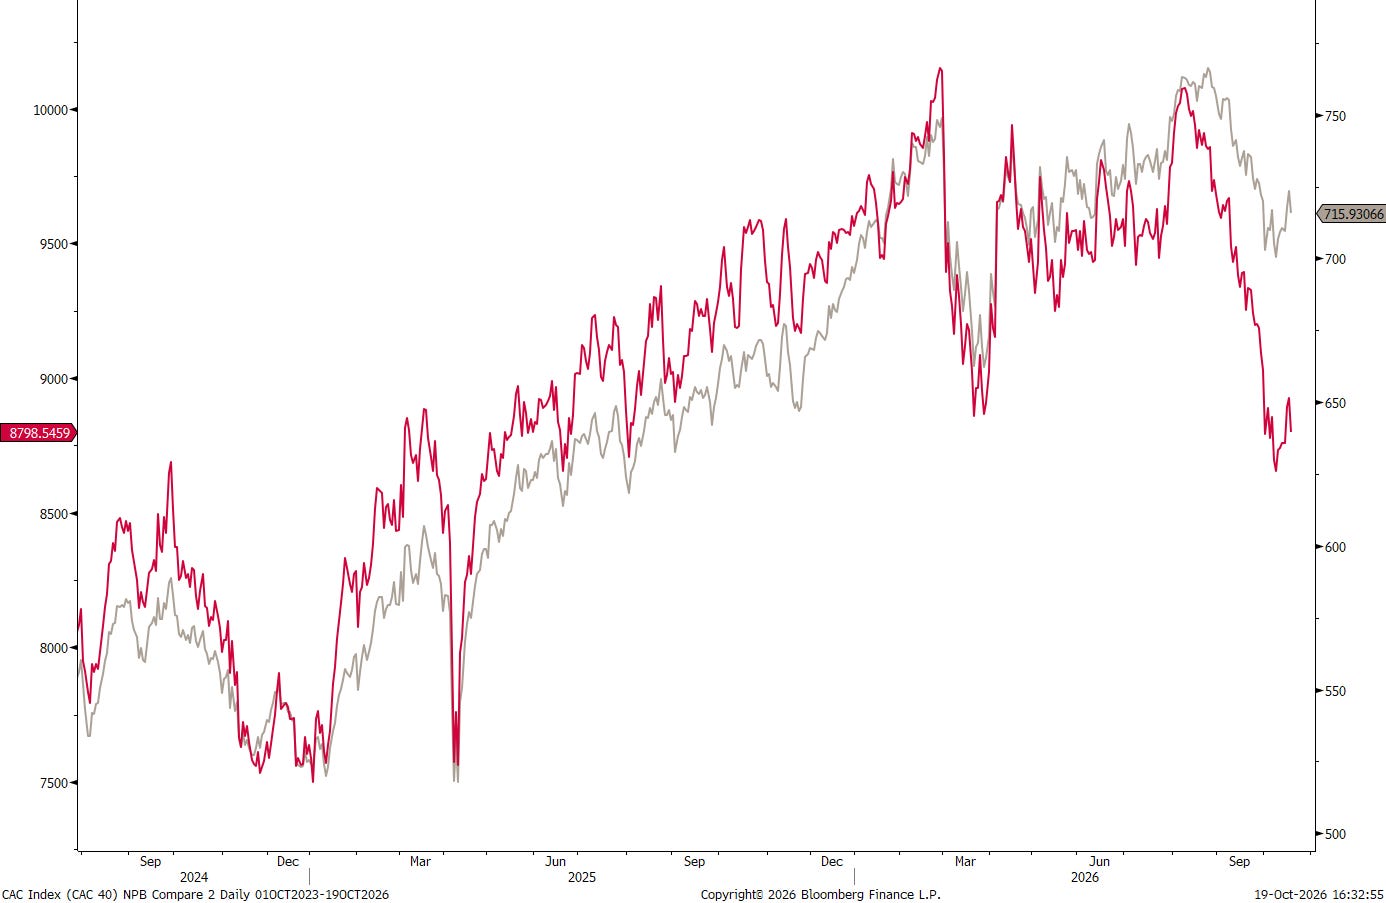
The stock market (CAC 40) has been in the know since this summer:
The decoupling of the French equity market (CAC 40 - red) from the rest of the European markets (SXXP - grey) has been very visible:
The bond market, of course, has been in the know also for a while now:
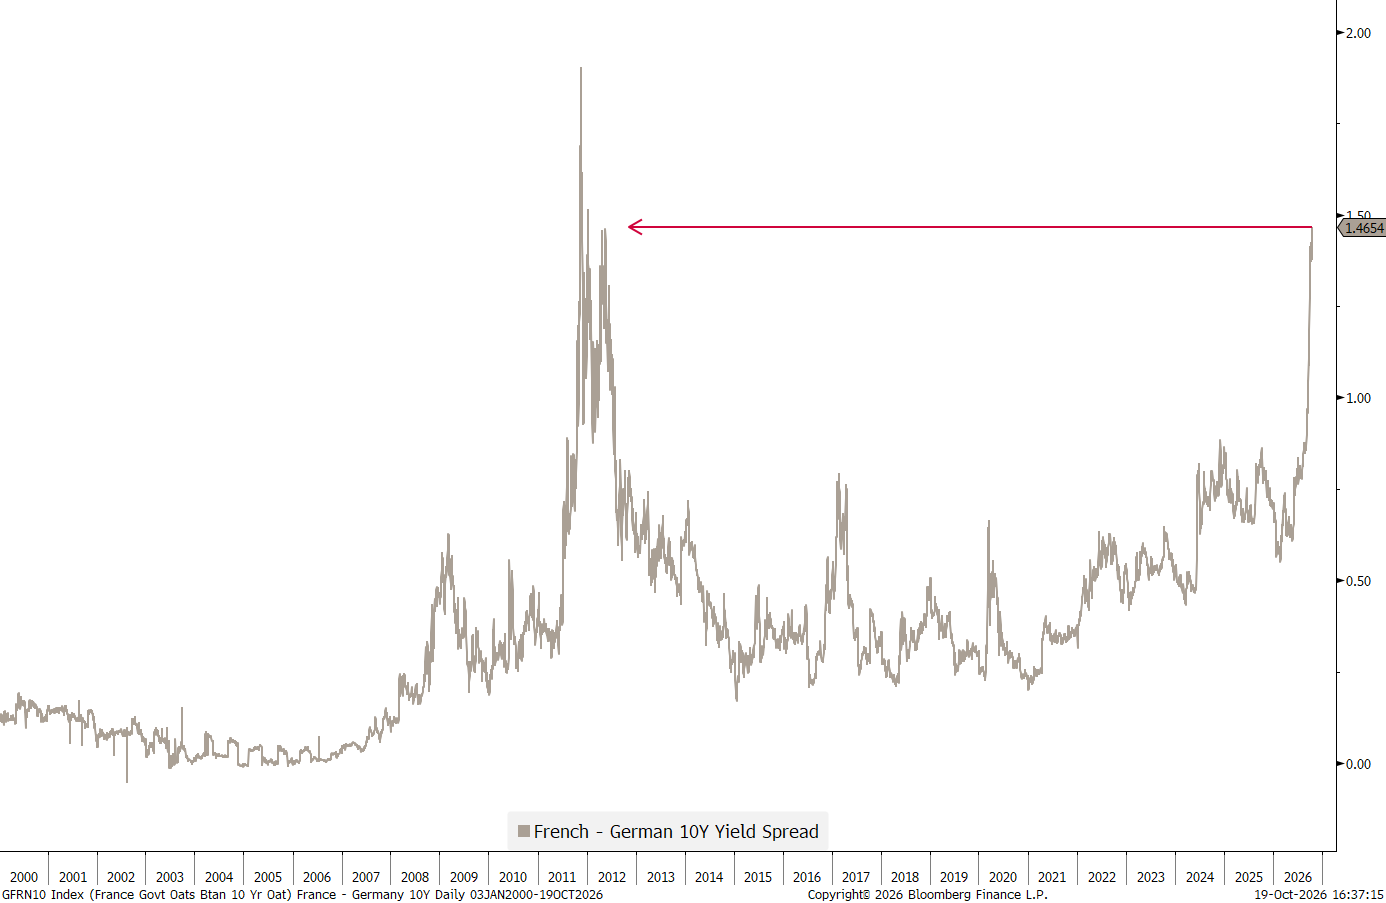
We are speaking here of levels on par with the panic moments during the 2011/2012 European sovereign debt crisis!!
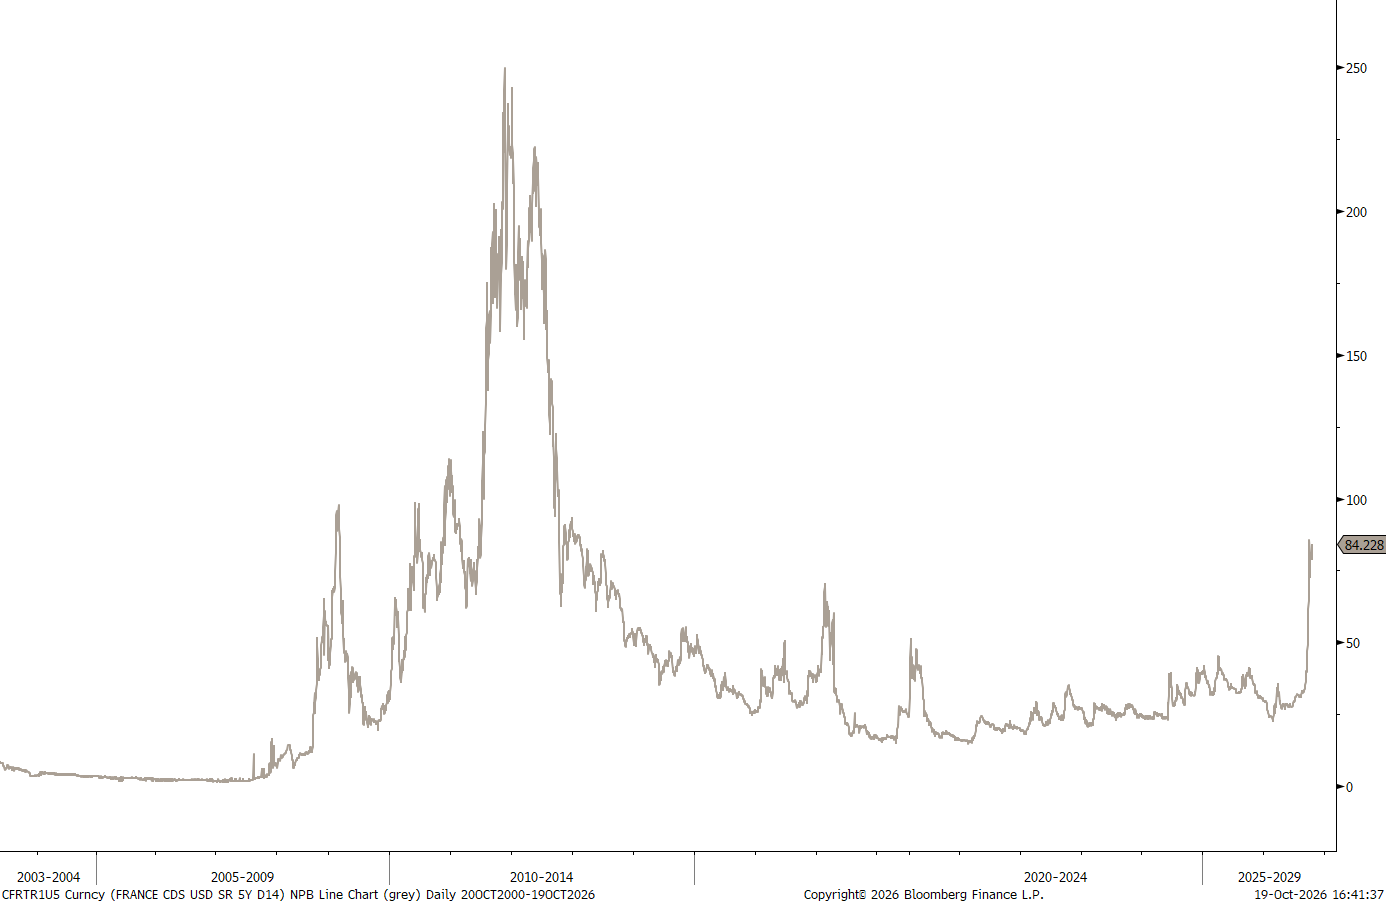
Credit Default Swap rates have moved higher, but are not at those 2011/12 levels … yet:
DEBT (Government)
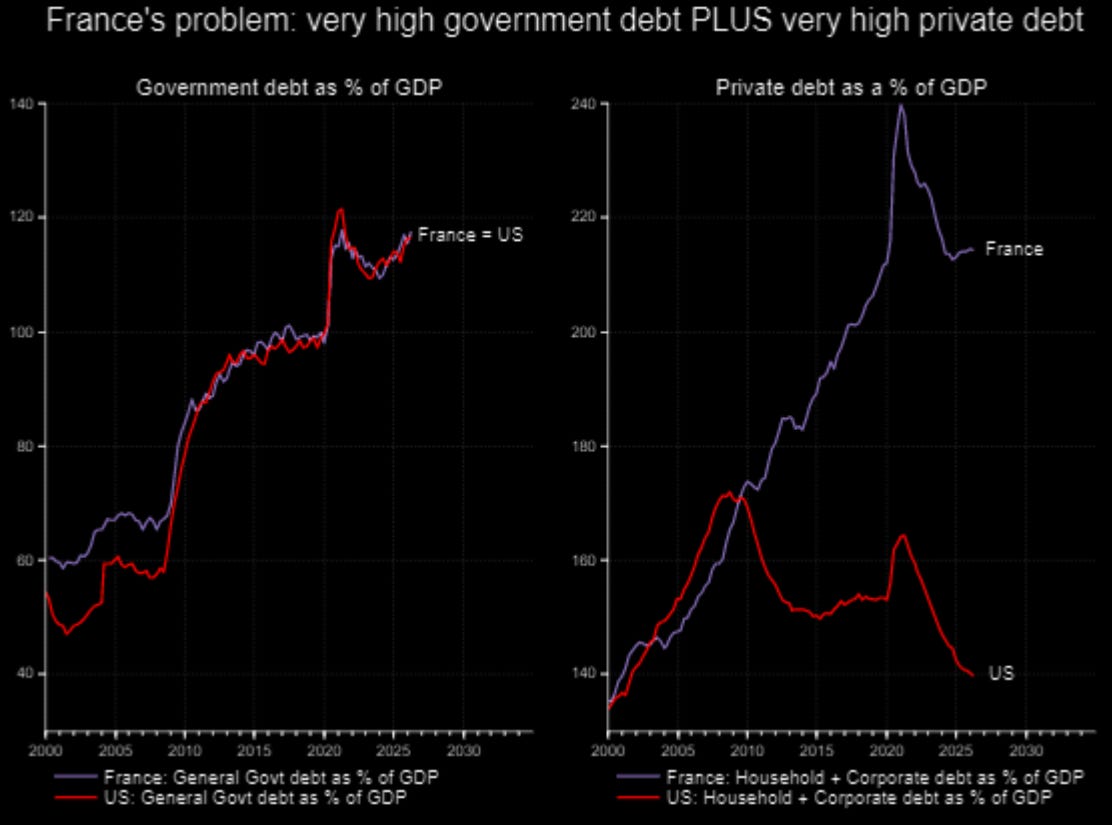
The problem in France are not only elevated Debt-to-GDP levels:
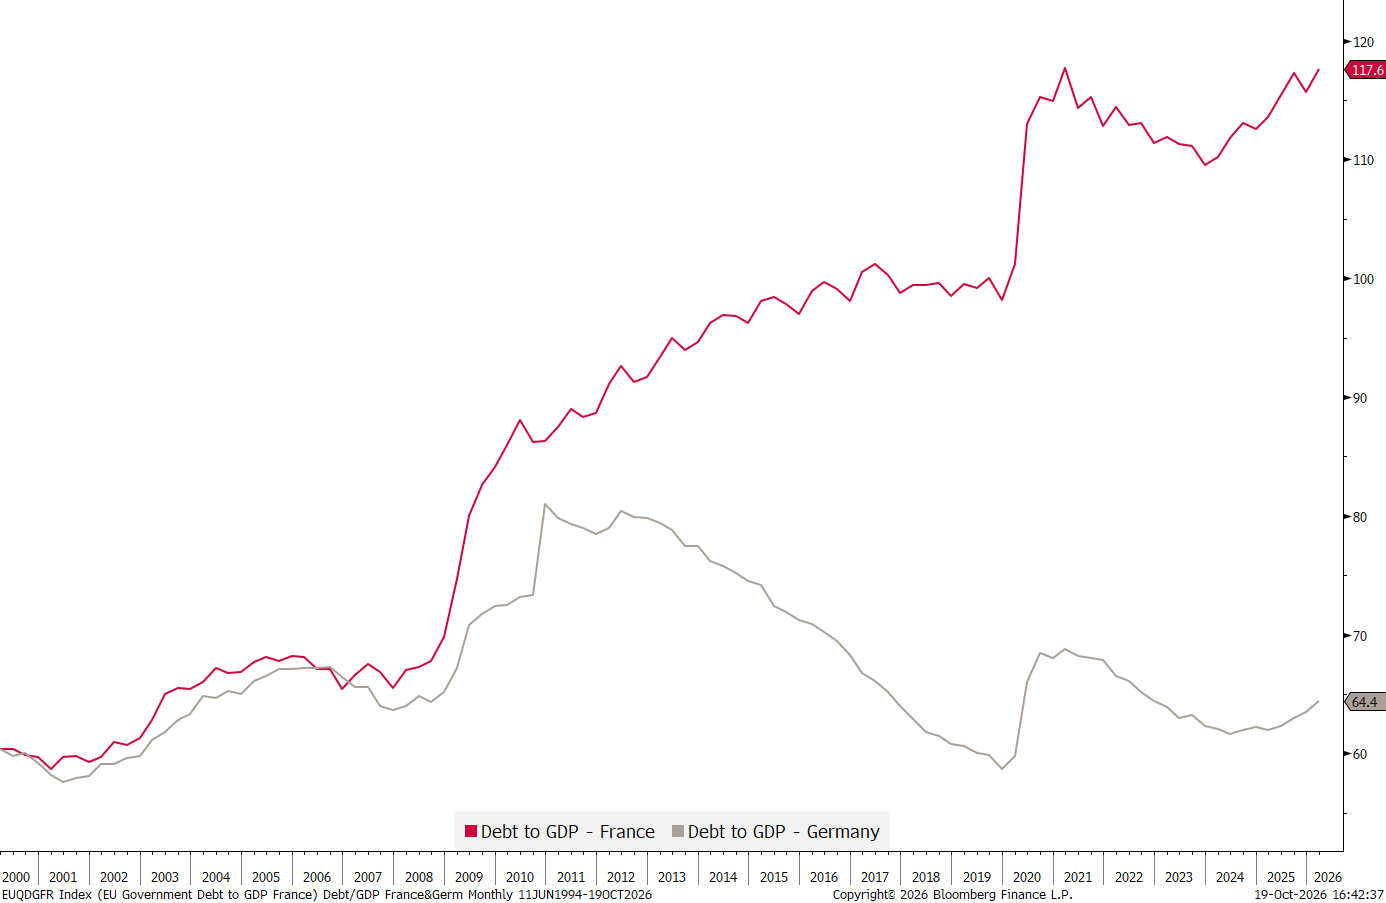
The problem in France is not only elevated government debt (which is in line with the US debt in % of GDP), but also very high private debt:
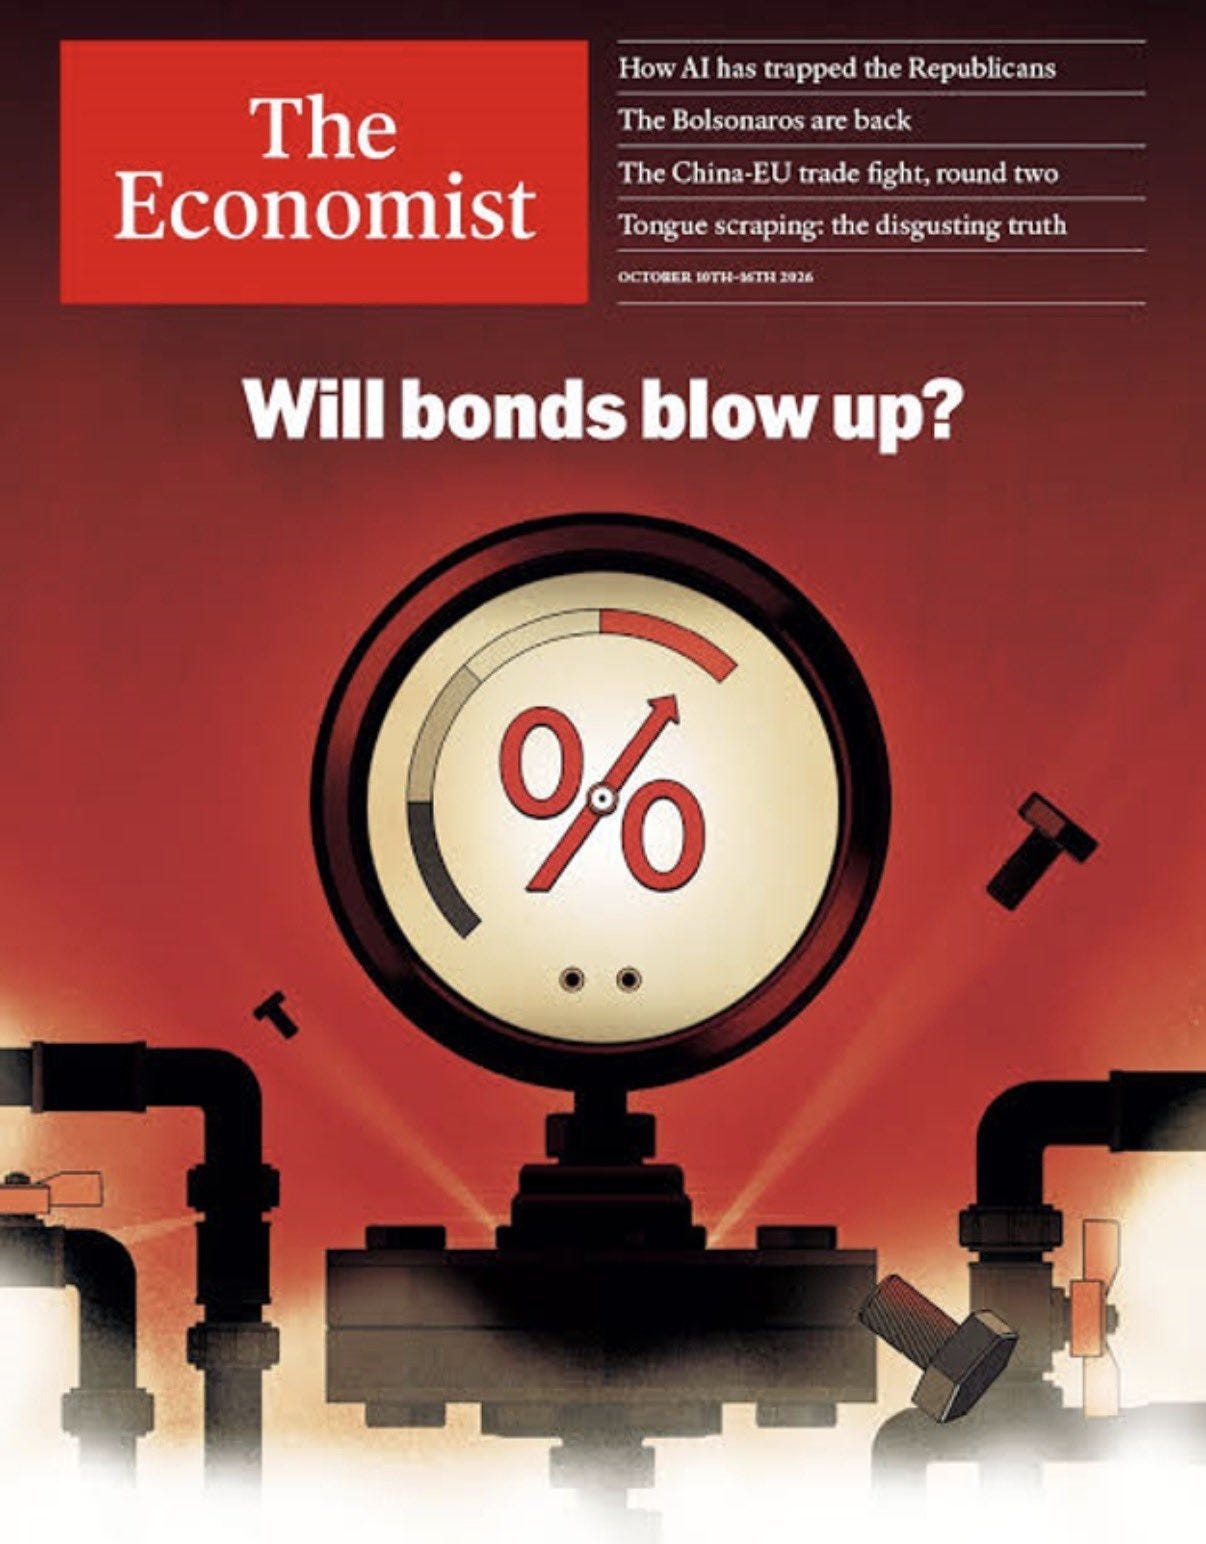
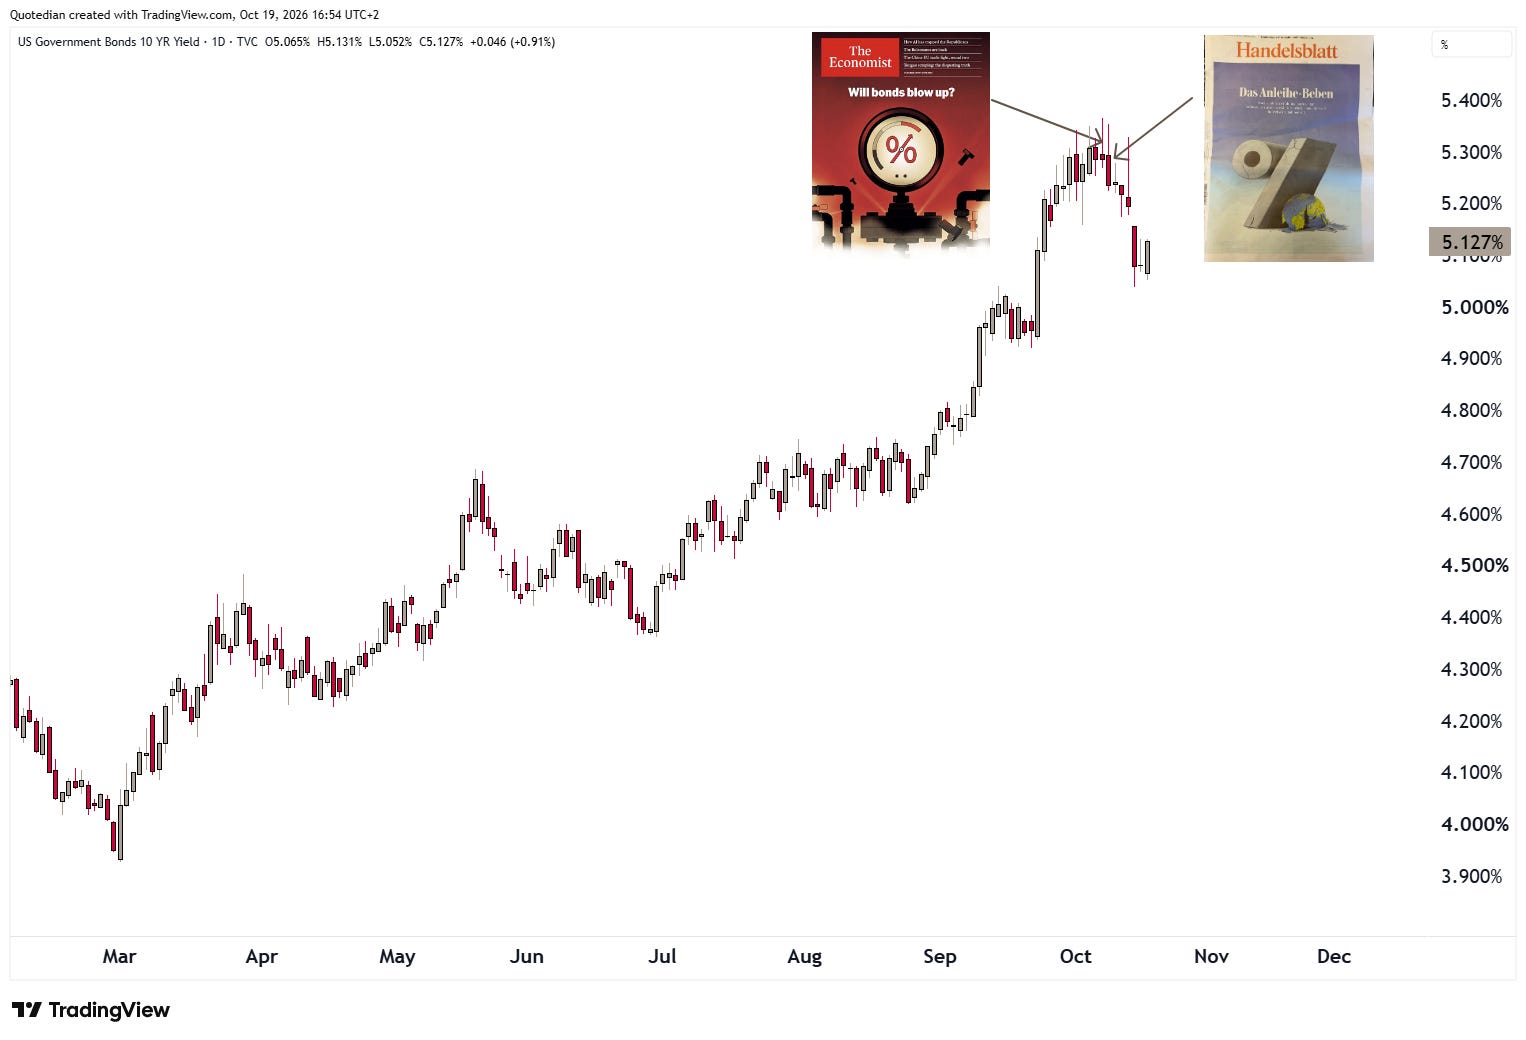
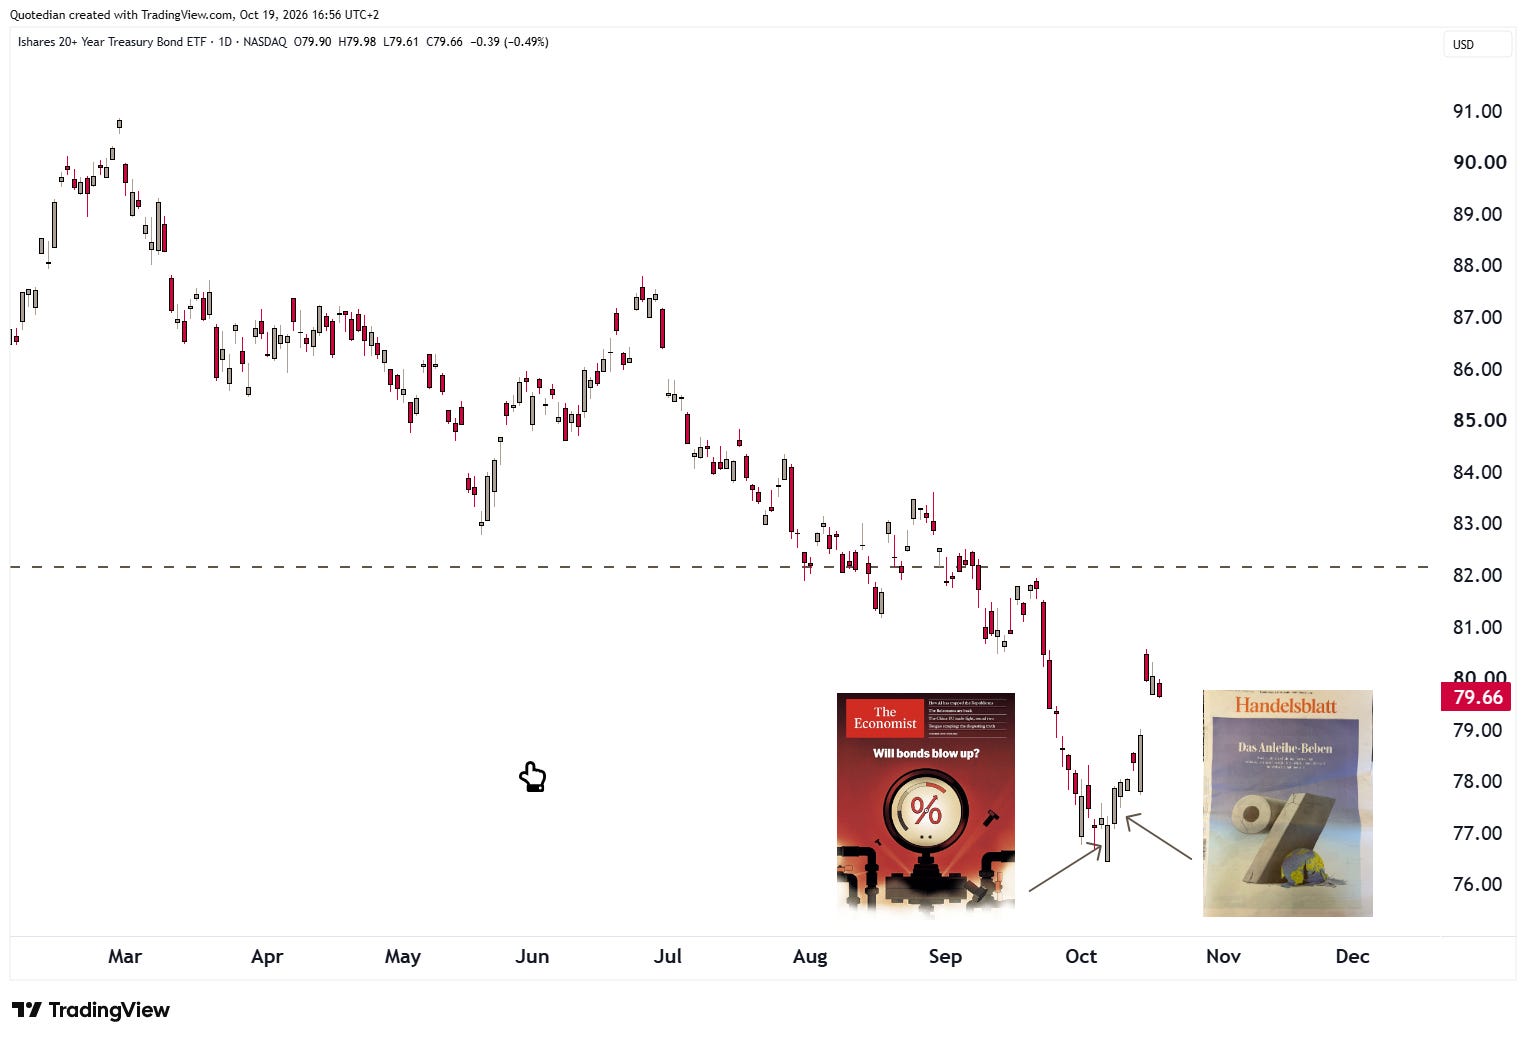
In the US bond market, The Economist once again came to the rescue with their famed … fabled … notorious Magazine Coverpage contra-indicator:
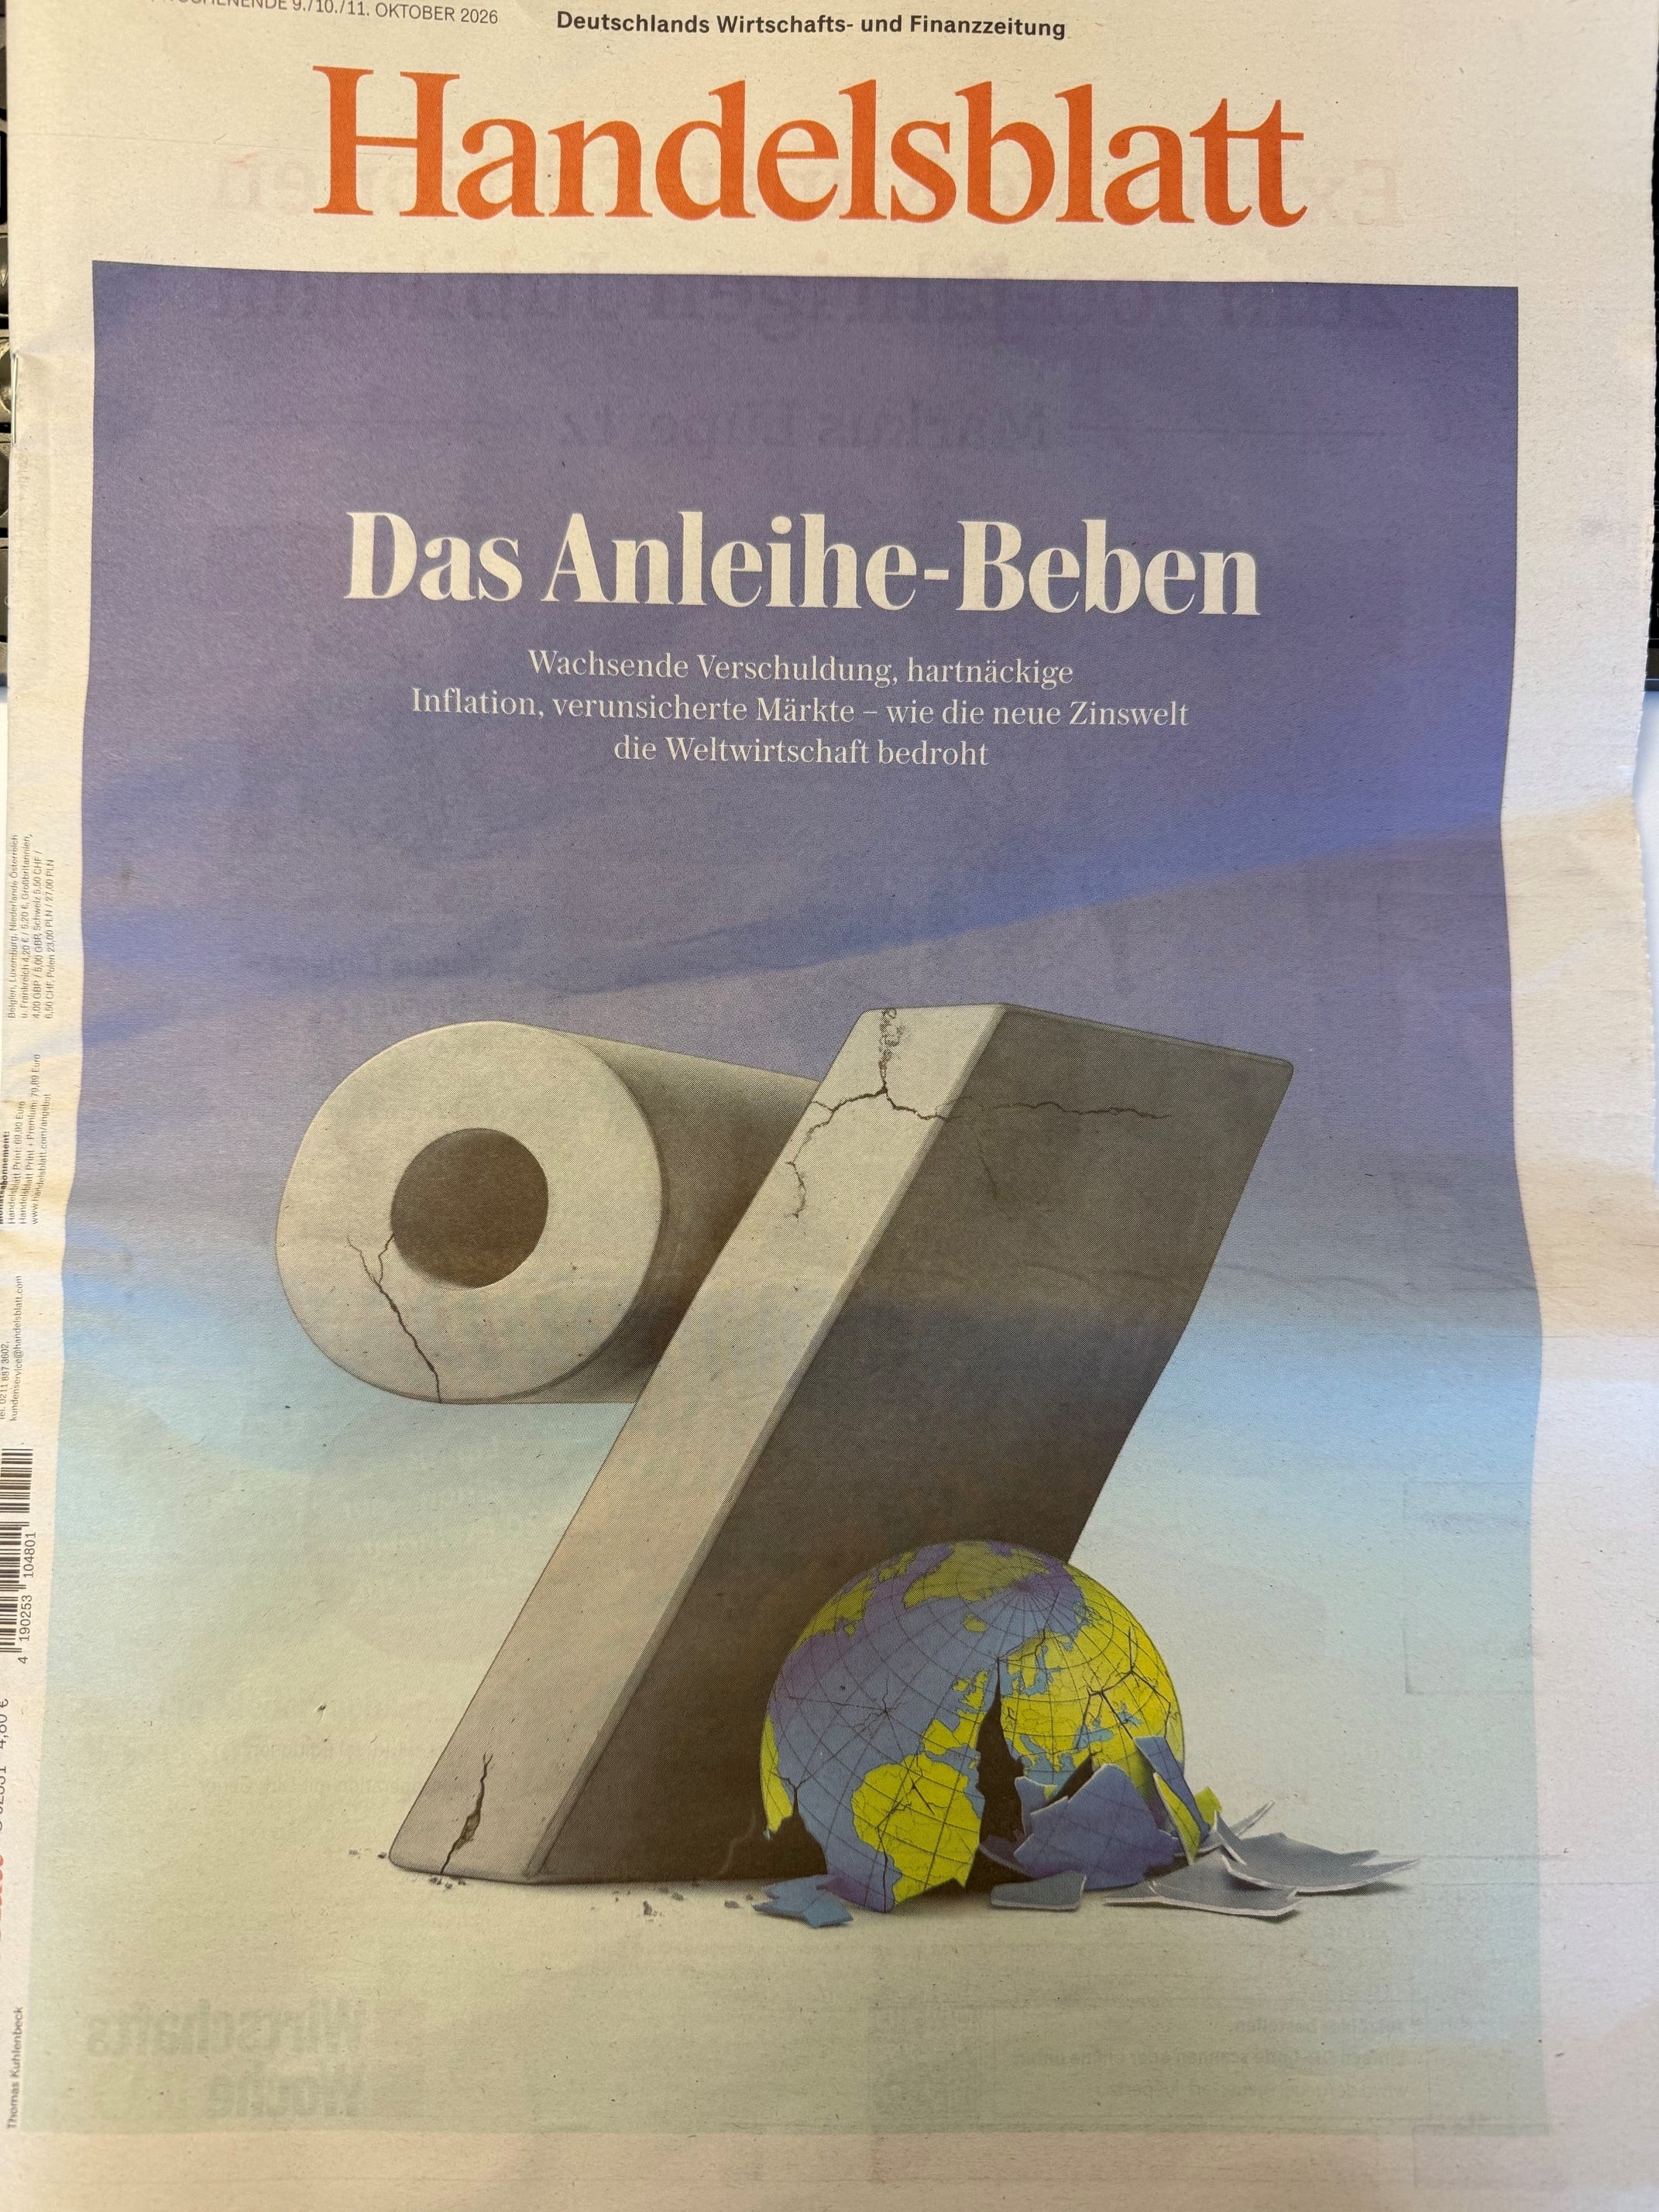
But to honest, it had some help also from Germany’s Handelsblatt, which came out with the following cover, only a day after The Economist’s:
So far, so good:
Looking at bond prices and taking the iShares 20+ Year Treasury Bond ETF (TLT) as a proxy, this looks as follows:
Debt (Corporate)
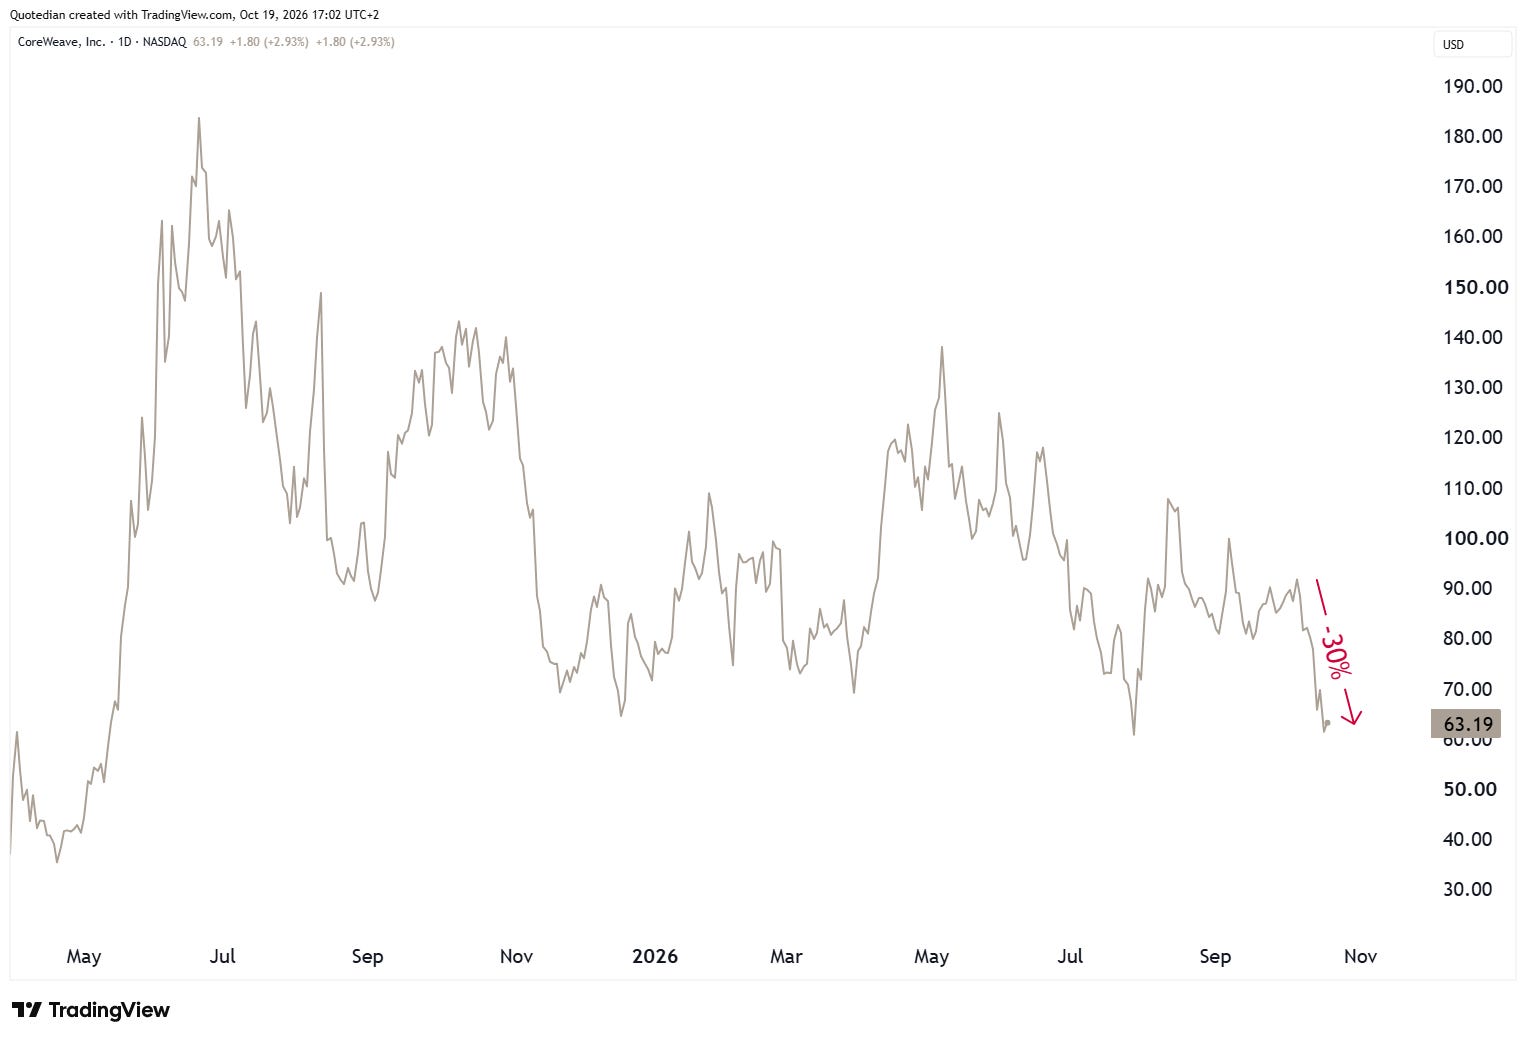
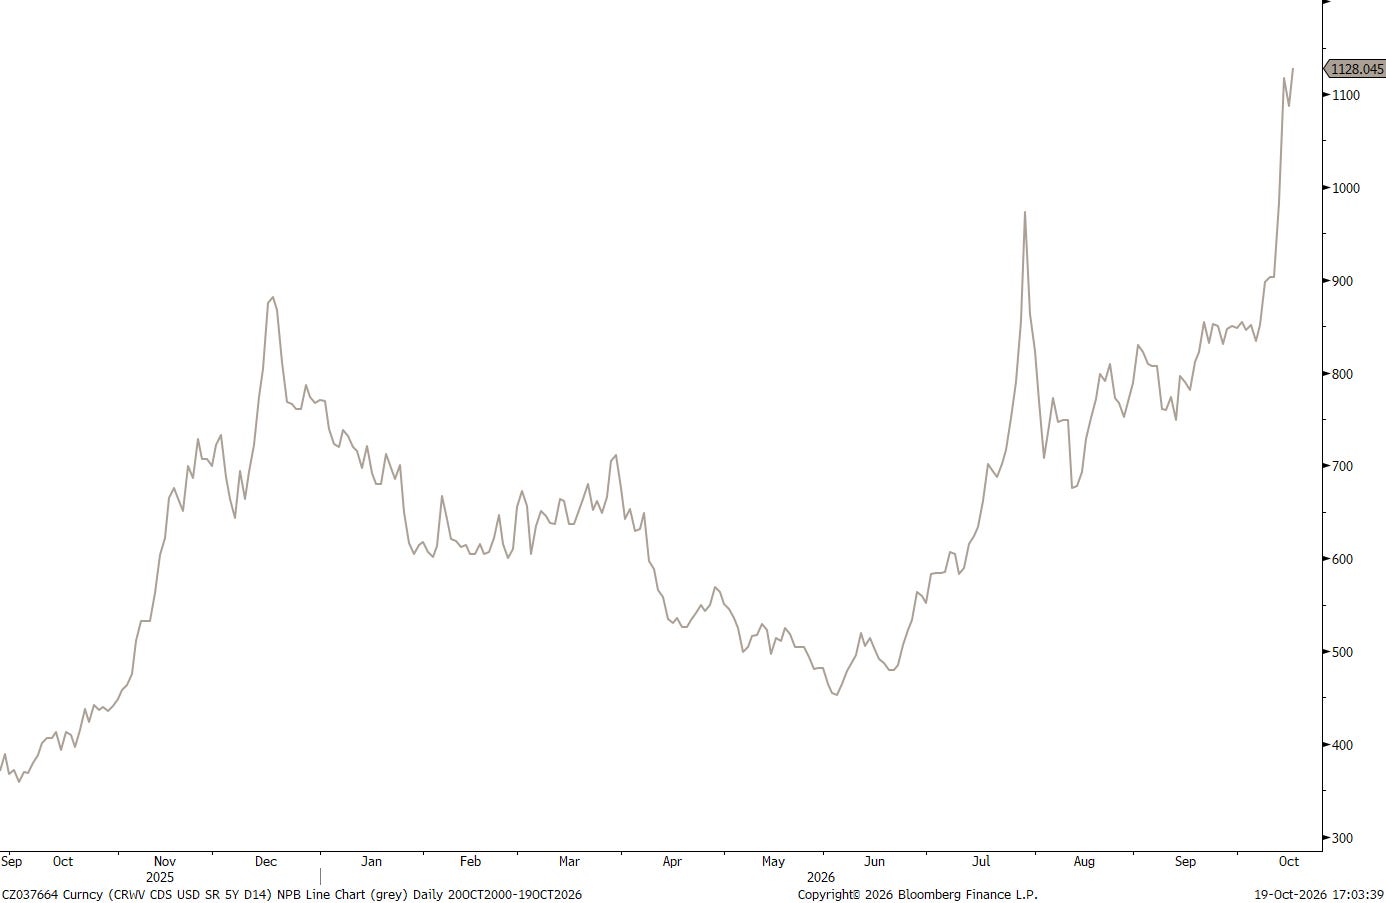
At least partially initiating the AI ‘panic’ last week was a sharp sell-off in CoreWeave with the central debate being whether the company can continue its data-center buildout without materially eroding shareholders return.
The company’s share price has dropped 30% in less than two weeks:
But probably more drama was seen on the company’s bonds, where its 9 5/8% 2032 issue for example briefly fell below 80,
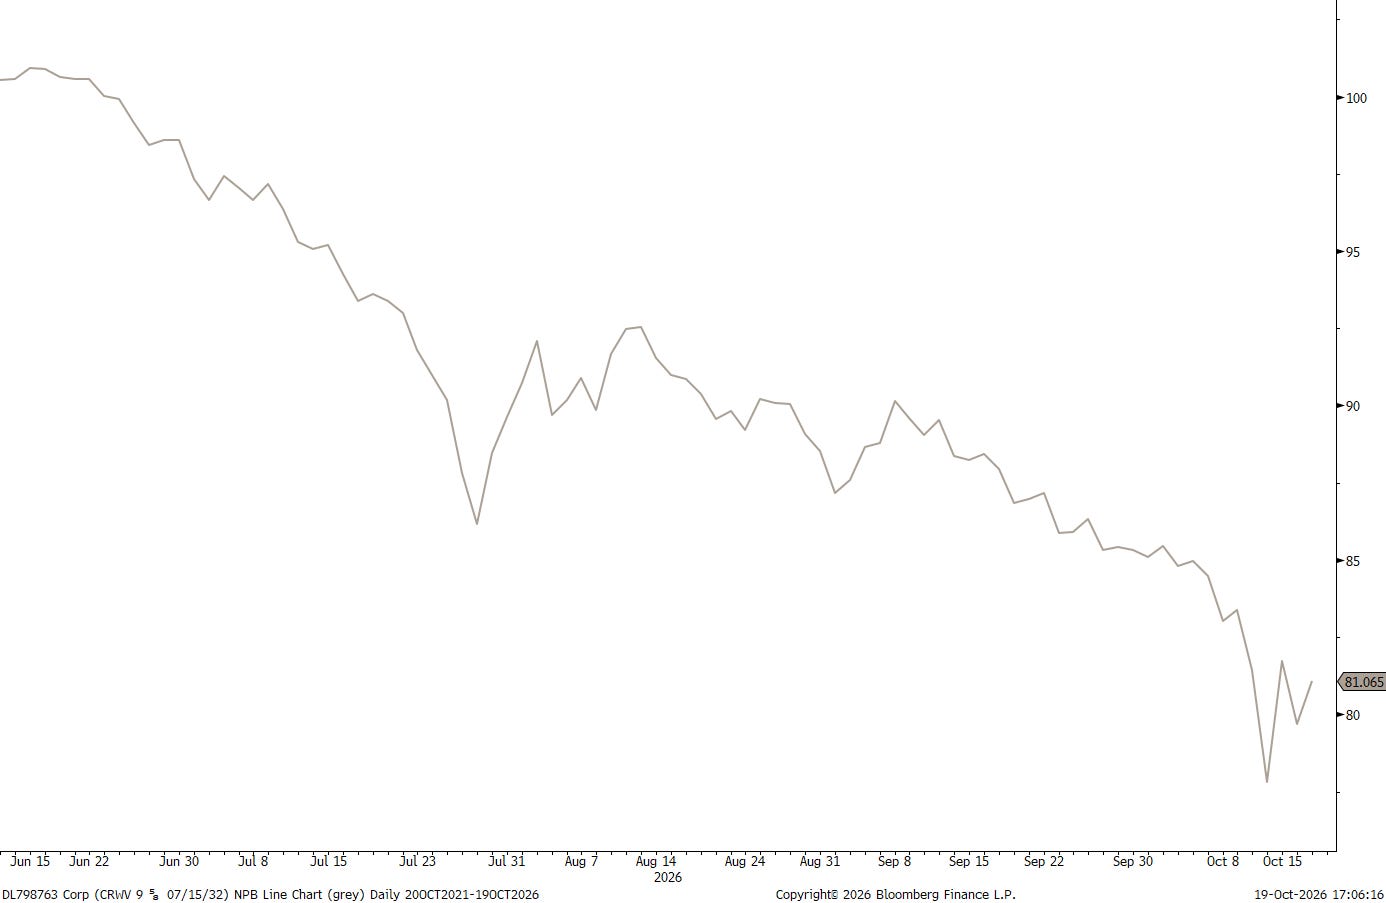
yielding north of 15% p.a.,
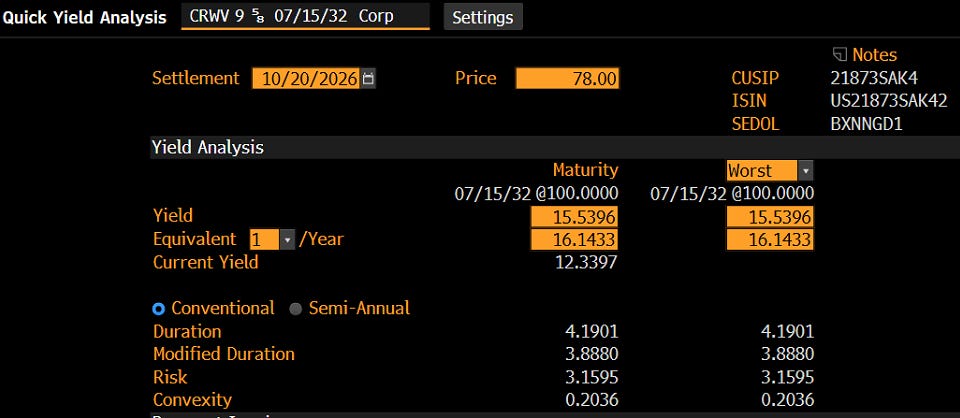
as their CDS rates blew out to above 1,000 (normally considered the magic number of default…):
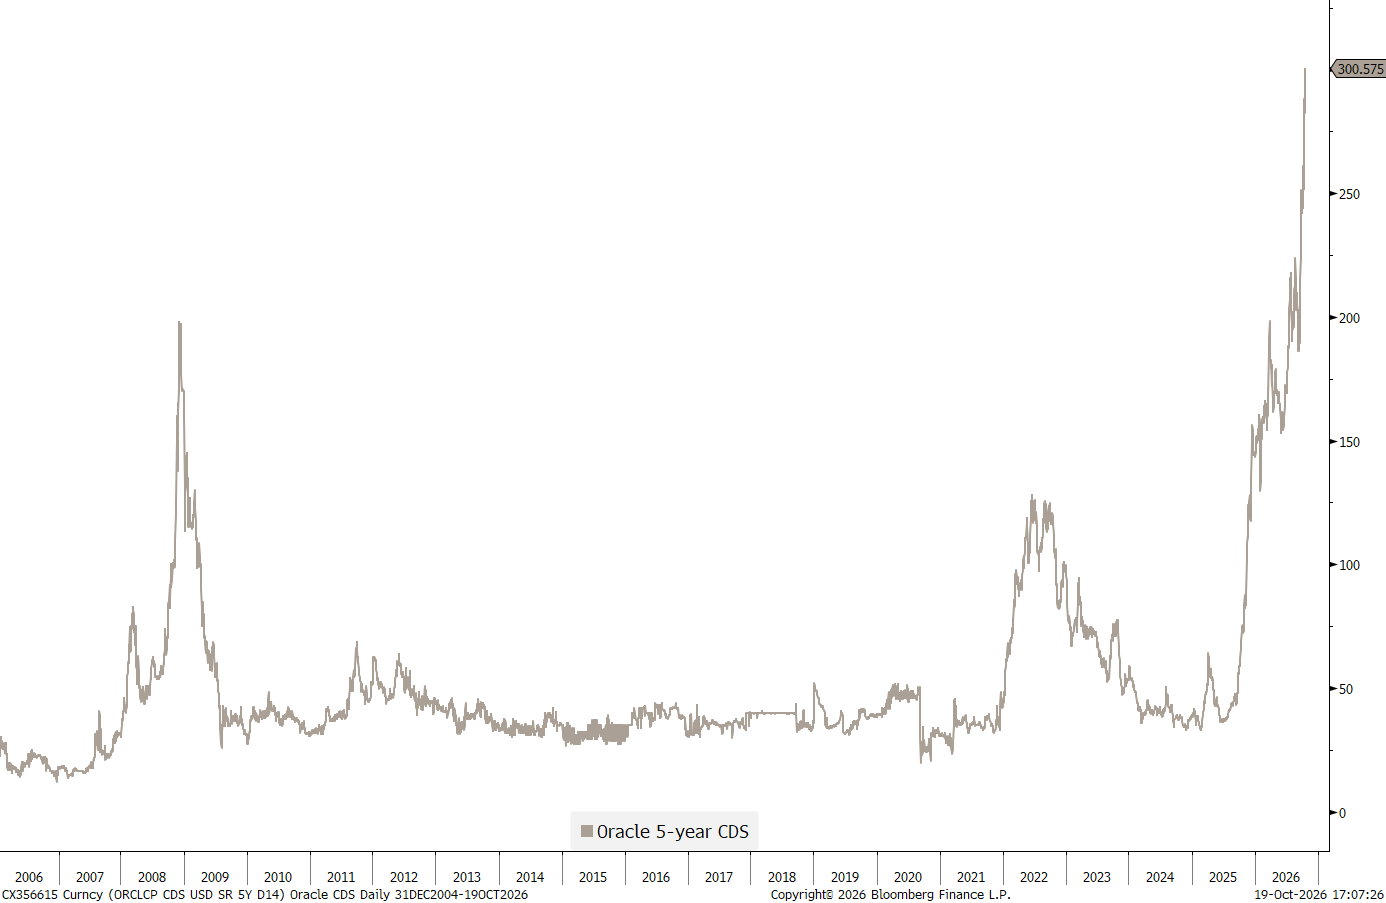
Other AI sinners spenders were also castigated. E.g., Oracle:
We have been warning (last time in our quarterly outlook - click here) that the widening in the lowest quality bucket of high yield (CCC - Gold line) should be closely monitored:
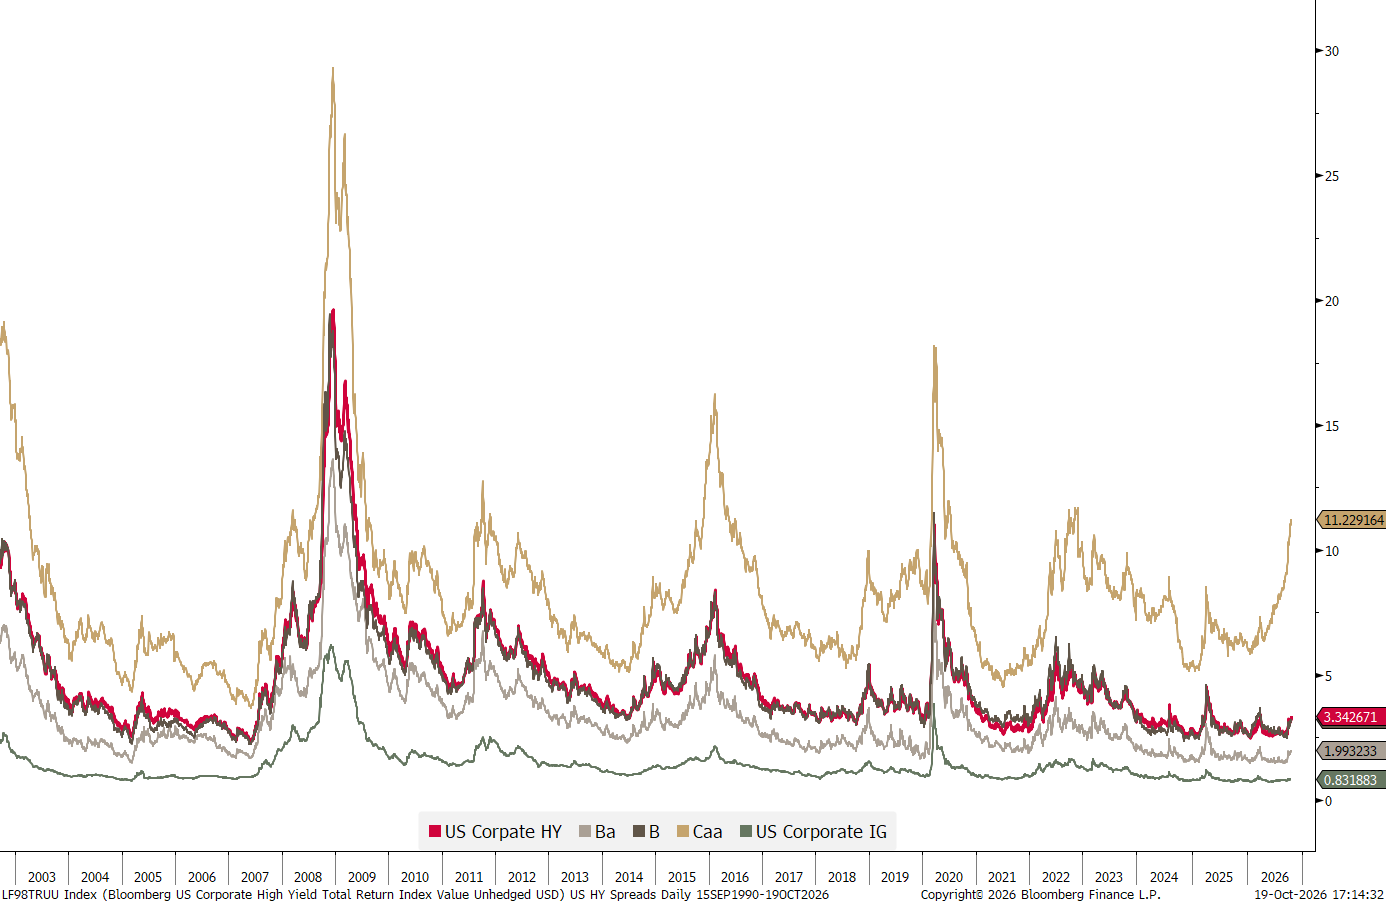
The blow-up sequence is lowest quality first (above), followed by the rest of the credit market (below),
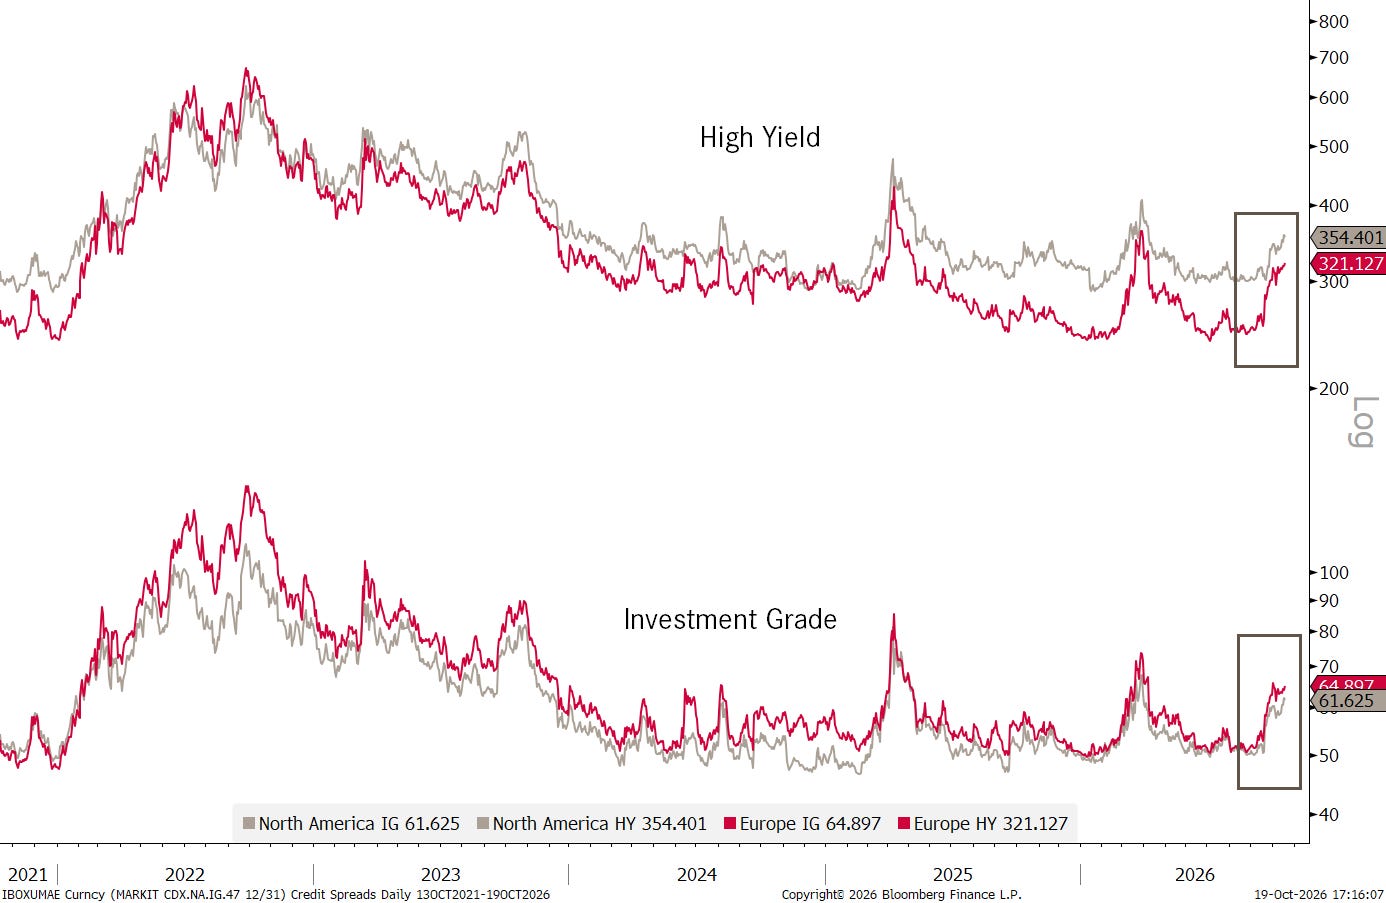
then followed by equities:
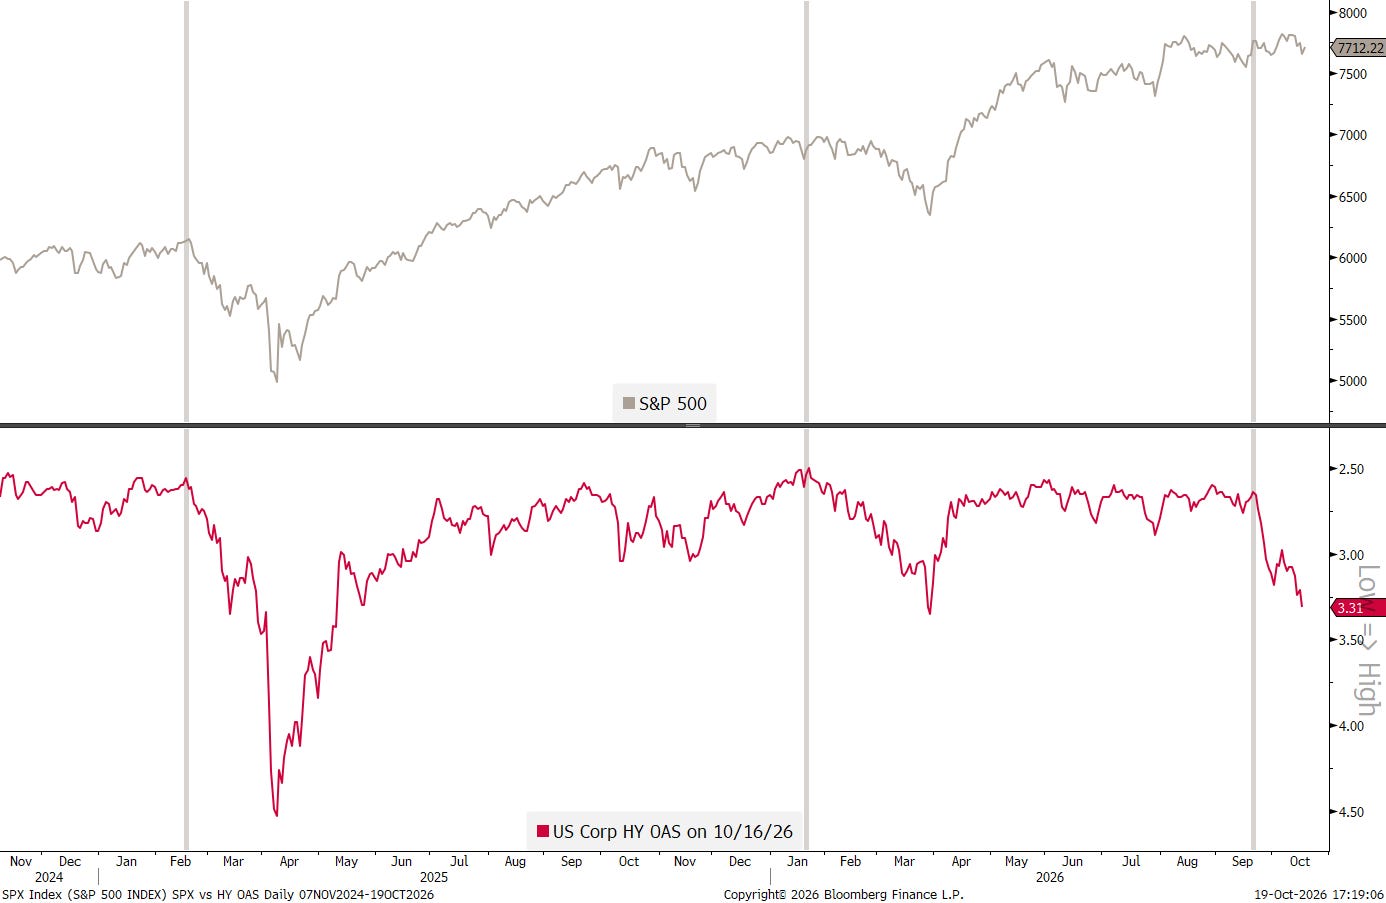
Yes, equity investors always get the memo last. Or, better put, they get the memo but prefer not to read it…
Unfortunately, it has gotten late on this busy Monday, and I need to hit the send button on what feels like unfinished business.
But hey, c’est la vie (to stay topical).
But one more thing just before I leave … I nearly forgot to mention why it today’s title is “Party likes it’s …1966”.
My working assumption for the next secular bear market, whether it is just beginning or will only do so over the next one to two years, has always been that it will look something like the secular bear from 1966 to 1982:
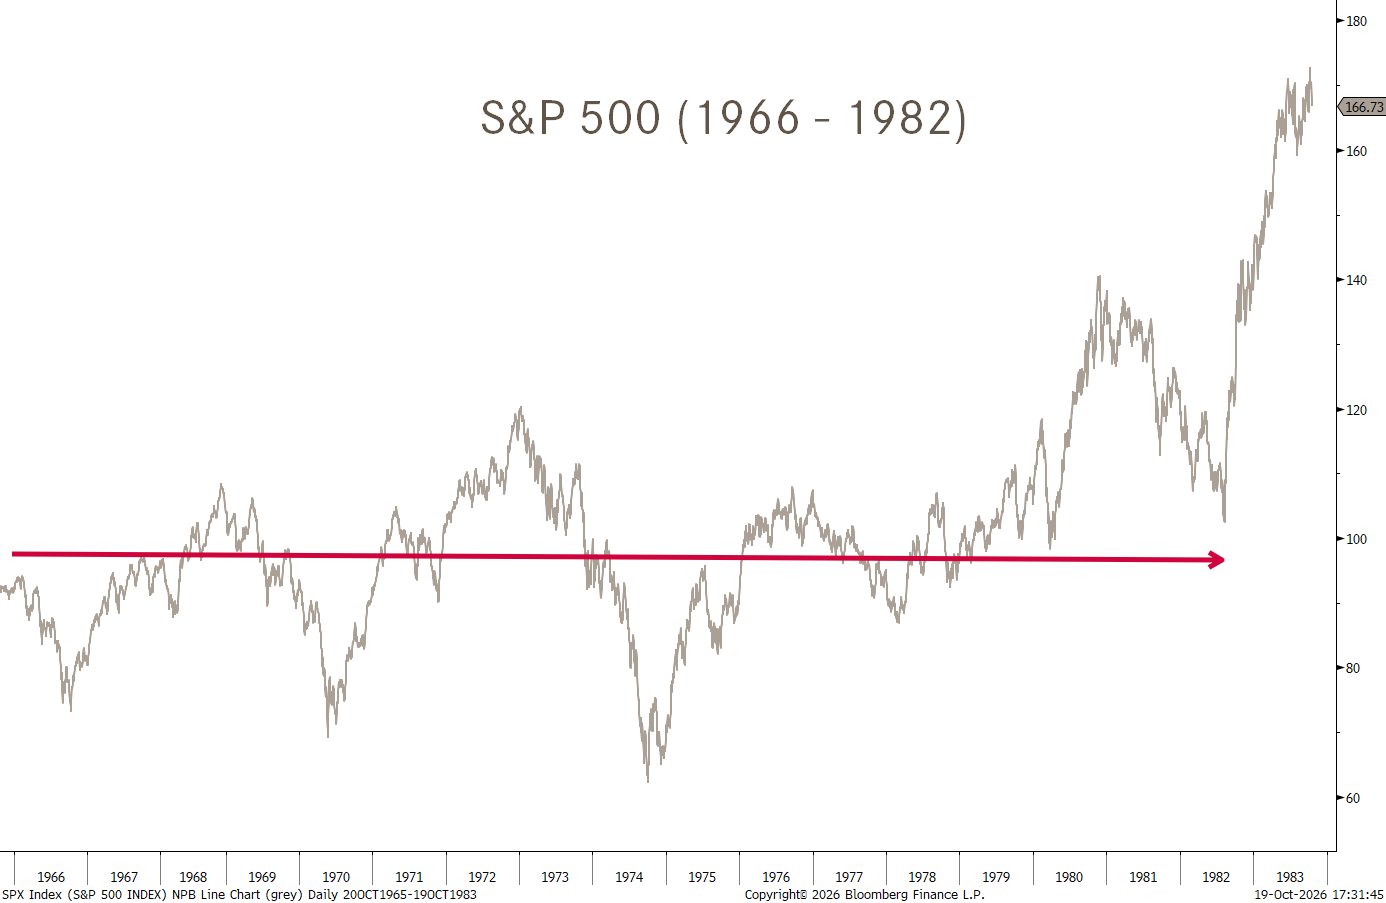
16 years of nothingness, but with wild volatility and money to be made for the non-passive, active investor!
It may not be pretty, but better 1966 than 1929, no?

Markets rarely ring a bell at the top. But right now, quite a few bells are ringing simultaneously.
Deteriorating breadth, speculative excess, sovereign debt concerns and widening credit spreads are an increasingly uncomfortable combination. Particularly as equity investors seem determined to ignore what bond investors are telling them.
Does this mark the end of the secular bull market? Too early to tell. But the probability of a meaningful correction has increased substantially.
And remember, a secular bear market doesn’t necessarily mean a collapse. It might simply mean that buying and holding stops working for a very, very long time.
May the Trend be with You!
André
*Unless I am wrong, which is a high-probability scenario😜

The Important One:
Everything in this document is for educational purposes only (FEPO)
Nothing in this document should be considered investment advice
Investing real money can be costly; don’t do stupid shit
Leave politics at the door—markets don’t care.
Past performance is hopefully no indication of future performance
The views expressed in this document may differ from the views published by NPB Neue Privat Bank AG
The Legal One: