Pounded
The Quotedian - Vol V, Issue 144
"It's like déjà vu all over again."
— Yogi Berra
DASHBOARD
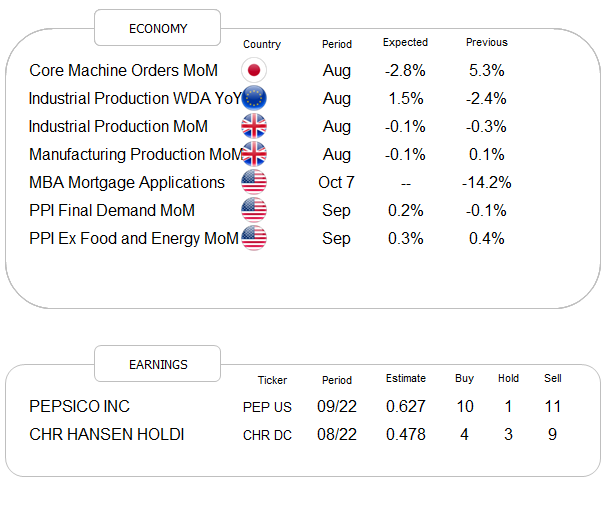
AGENDA
CROSS-ASSET DELIBERATIONS
Many, many, many, many moons ago, when I was a young, ambitious FX trader on the Nostro-Desk of a Swiss bank (which has its own worries nowadays, but that’s a story for another day), there was one particularly successful investor by the initials of GS (not Goldman Sachs) who took upon one specific central bank on a small island, who was showing some ignorance or arrogance or both. Long story short, GS won with dire implications for the nation's currency.
Fast forward astonishing precisely 30 years, and we got these headlines after the European market close from Bank of England governor Andrew Bailey (highlights mine):
*BOE'S BAILEY: SERIOUS RISK TO FINANCIAL STABILITY IN UK
*BOE'S BAILEY: MESSAGE TO FUNDS IS `YOU'VE GOT THREE DAYS LEFT'
*BOE'S BAILEY SAYS INTERVENTION IN MARKETS WILL BE TEMPORARY
Especially the ‘Three days left’ seems like yet another central banker in the search of a Mario Draghi "whatever it takes … and believe me, it will be enough” moment. Will it work? Perhaps. Though IMHO, central bank bluffing tends to get challenged quite quickly by Mr Market and more often than not with the latter emerging as the ‘winner’. I just refer you back to today’s “Quote of the Day”.
Let’s get back into our normal routine of reviewing yesterday’s equity session first and get back to bond and FX markets in a moment …
Stocks held bravely above key support levels discussed yesterday during most of the session and actually crept into positive territory (US market) for a short while until the ‘three days left’ mentioned above weighed heavily on investors’ confidence.
Surprisingly enough, it was the tech-heavy, long-duration Nasdaq that took the strongest hit, despite bond yields trading lower on the day. But maybe the market map of the S&P 500 gives some insight into that:
Indeed we observe that there was actually quite a lot of green and that some of the ‘largest’ red was concentrated on the FAAMG stocks, which also happen to be the heaviest index weights in the Nasdaq.
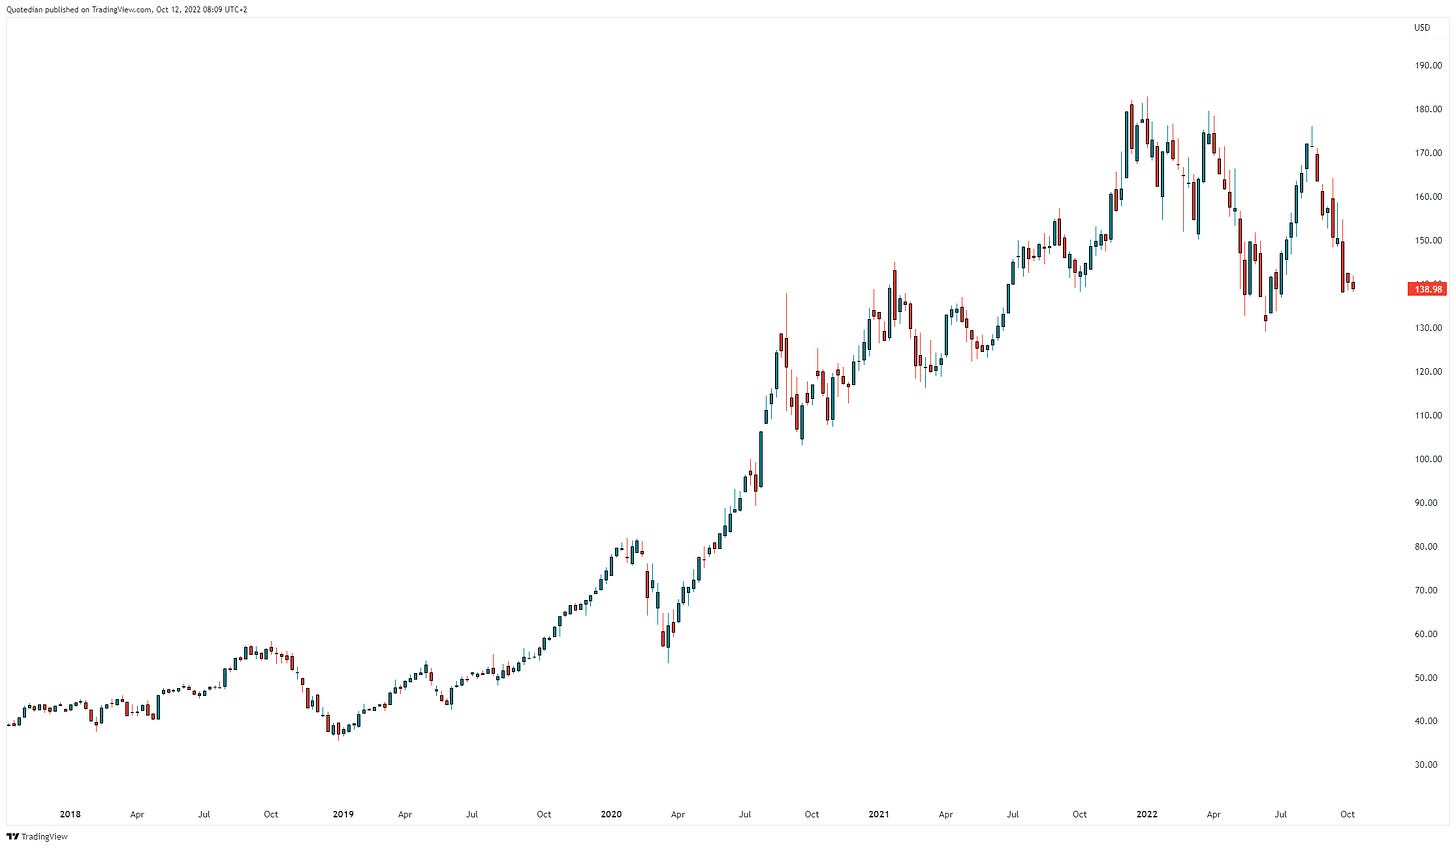
Let’s spend some time on this for a moment, as it is actually something I meant to write about for a while now. Whilst the major indices (S&P, Nasdaq) where arguably held up by those heavy hitters for a long time, it now seems they are becoming a drag to the index calculations, whilst other stocks are trying to move on (i.e. up). A real quick (5-year) look at each of them individually:
Meta (aka Facebook) - Ouch, back to 2019 levels and over $700 million(!) in market cap gone since the top:
Apple - minimum price target for me remains $110 (sorry):
Amazon.com - retest of $110 on the books?
Microsoft - nothing good happening on this chart:
Alphabet (aka Google) - similarly to MSFT, little good news on this chart:
In conclusion, from a technical, chart-point-of-view the drag on the major indices from the mega caps could continue for a while.
Briefly back to yesterday’s session, where the stock up versus stock down ratio was precisely two-to-three, but only three out of eleven sectors closing higher on the day:
Asian equity markets are giving a pretty mixed picture this morning, with the benchmark indices in countries such as China, Korea, Australia or India printing green, whilst their equivalents in Japan, Taiwan or Hong Kong are down. Index futures on both sides of the Atlantic are in comfortably positive territory as I type.
On to fixed income markets, where a lot of focus will be on British Gilts today, as Bailey’s comments came after their closing yesterday. I think to understand that the UK bond price slide (as much as the Pound sell-off) have been halted somewhat, after reports that the BoE may offer to extend bond purchases beyond those now notorious 3-days. BUT, this is TBC …
In any case, the chart of UK yields is … impressive … for the lack of a better word:
In the US, the 10-year yield is waiting for tomorrow’s CPI number, having (for now) topped out at the previous resistance at the 4%-mark:
Talking CPI, it should really not be the focus of markets, but courtesy of the Federal Reserve Bank, it now is. The PCE deflator was the inflation measure of choice for the Fed for decades and even today’s PPI is actually more important than tomorrow’s number, but hey, it is what it is. Whatever tomorrow’s number, I still think locking in some money for two years at a rate of 4.25% is not the worst idea ever:
Especially when considering headlines as such:
One more chart before we head over to FX markets and start wrapping up. The Bond volatility index (MOVE), is trading at its highest level ex-GFC. This is ominous and probably means a few things will still break before we get some calm back:
In currency markets, as mentioned at the outset of today’s Quotedian, the focus, for now, will be on British Pound. Here’s a close-up snapshot of yesterday’s and today’s session so far for the Cable:
Meanwhile, in the shadow of so much Sterling excitement (is that a pun?), the Japanese Yen hitting new multi-decade lows again is getting little attention:
This is putting our “magazine front page” reversal indicator at danger, but it’s so cute, let me repeat it anyway:
Finally, turning to commodity markets, Gold, which had attempted a lift-off out of its danger zone has dropped back to that key pivot level at just below $1,700:
A difficult read indeed.
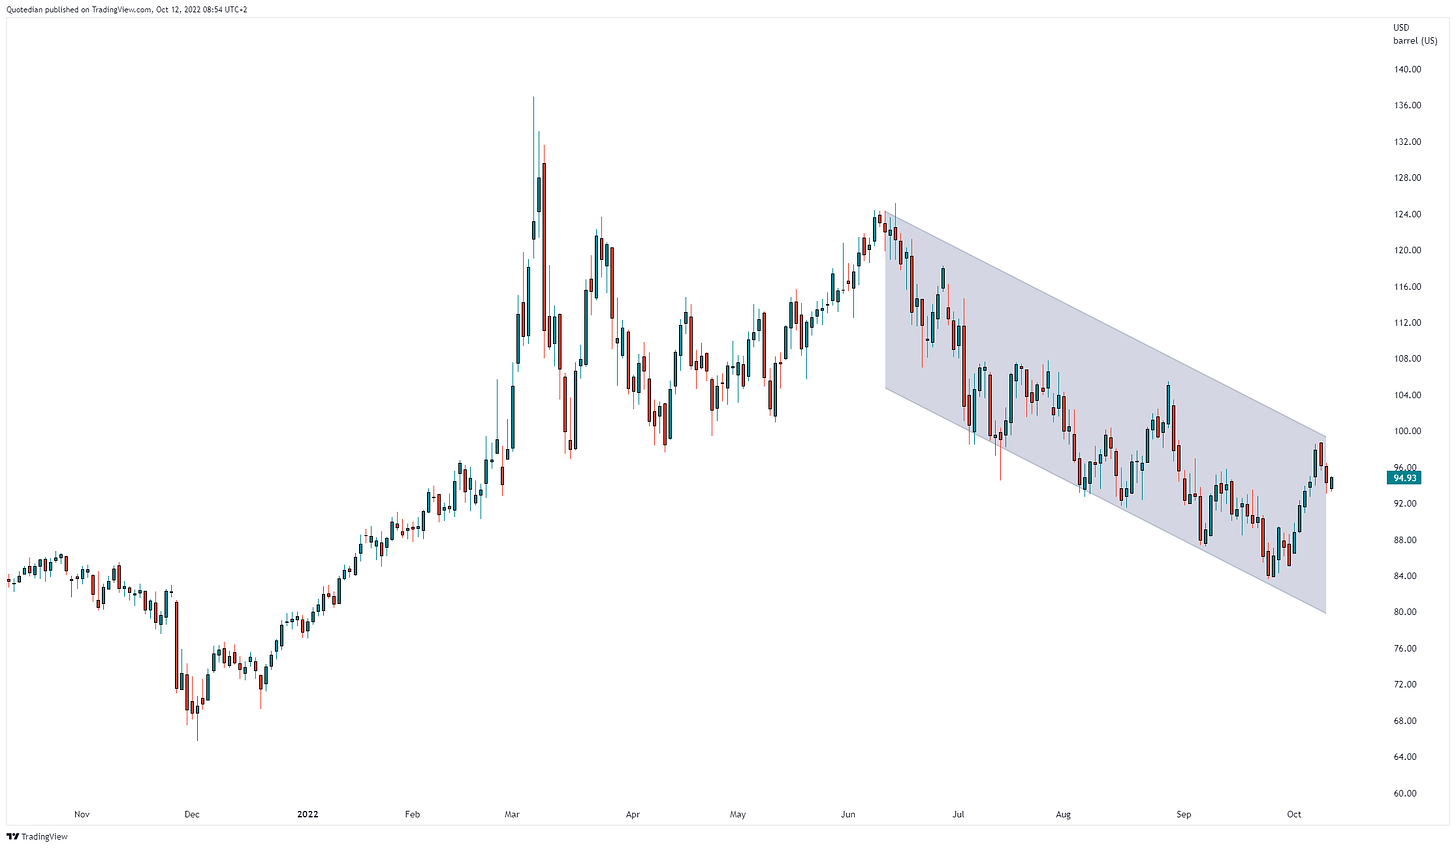
Oil (Brent) is for now being rejected at the upper end of its trend channel:
Staying with oil, last week (and on previous occasion) I have shown charts how the US has “sold off” its SPR (Strategic Petroleum Reserve) to the lowest level in 40 years. Here’s another good picture on that, showing that SPR is now also below ‘normal’ US inventory:
What will happen to the price of oil once the SPR (after elections?) is started to be refilled?
Ok, time to hit the Send button, but just before that, I just finished reading Peter Zeihan’s “The End of the World is just the Beginning”. Whilst it is very US-centric there is still a tonne of very interesting historical information in there and can be recommended for that alone. Also, remove any sharp objects close-by whilst reading.
Stay safe!
André
CHART OF THE DAY
In the bond section, we discussed how it may be a good idea to look in some cash at the current comparatively elevated 2-year bond yields, especially in light of all the economic recession warnings we are getting. Today’s chart by the fine folks at BCA Research would give some further fuel to that argument. Stay tuned …
Thanks for reading The Quotedian! Subscribe for free to receive new posts and support my work.
DISCLAIMER
Everything in this document is for educational purposes only (FEPO)
Nothing in this document should be considered investment advice
Past performance is hopefully no indication of future performance


