

Raw Earth
Vol VIII, Issue 29 | Powered by NPB Neue Privat Bank AG

“A good hockey player plays where the puck is. A great hockey player plays where the puck is going to be”
— Wayne Gretzky
Enjoying The Quotedian but not yet signed up for The QuiCQ? What are you waiting for?!!
** Housekeeping **
Today’s letter will be a bit shorter - not because dog ate my homework - but because of this:
So it turns out that the Substack platform, on which this letter is written, is also run on Amazon’s AWS and was down and out for the biggest parts of this Monday morning. Hence, the brefity going forward.

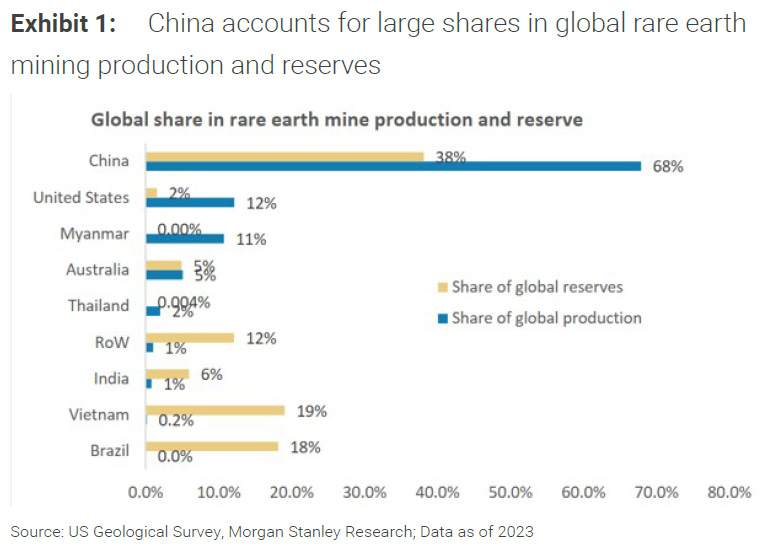
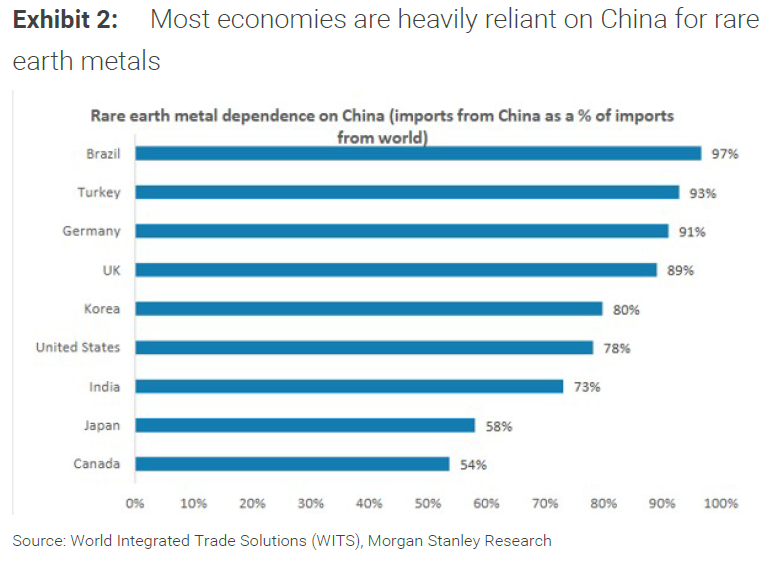
The following is a comment from Deng Xiaoping in 1992:
The Middle East has its oil, China has rare earths… it is of extremely important strategic significance.
Talking about Chinese patience … here are two fantastic charts from a recent article by Bloomberg’s unbeatable John Authers:
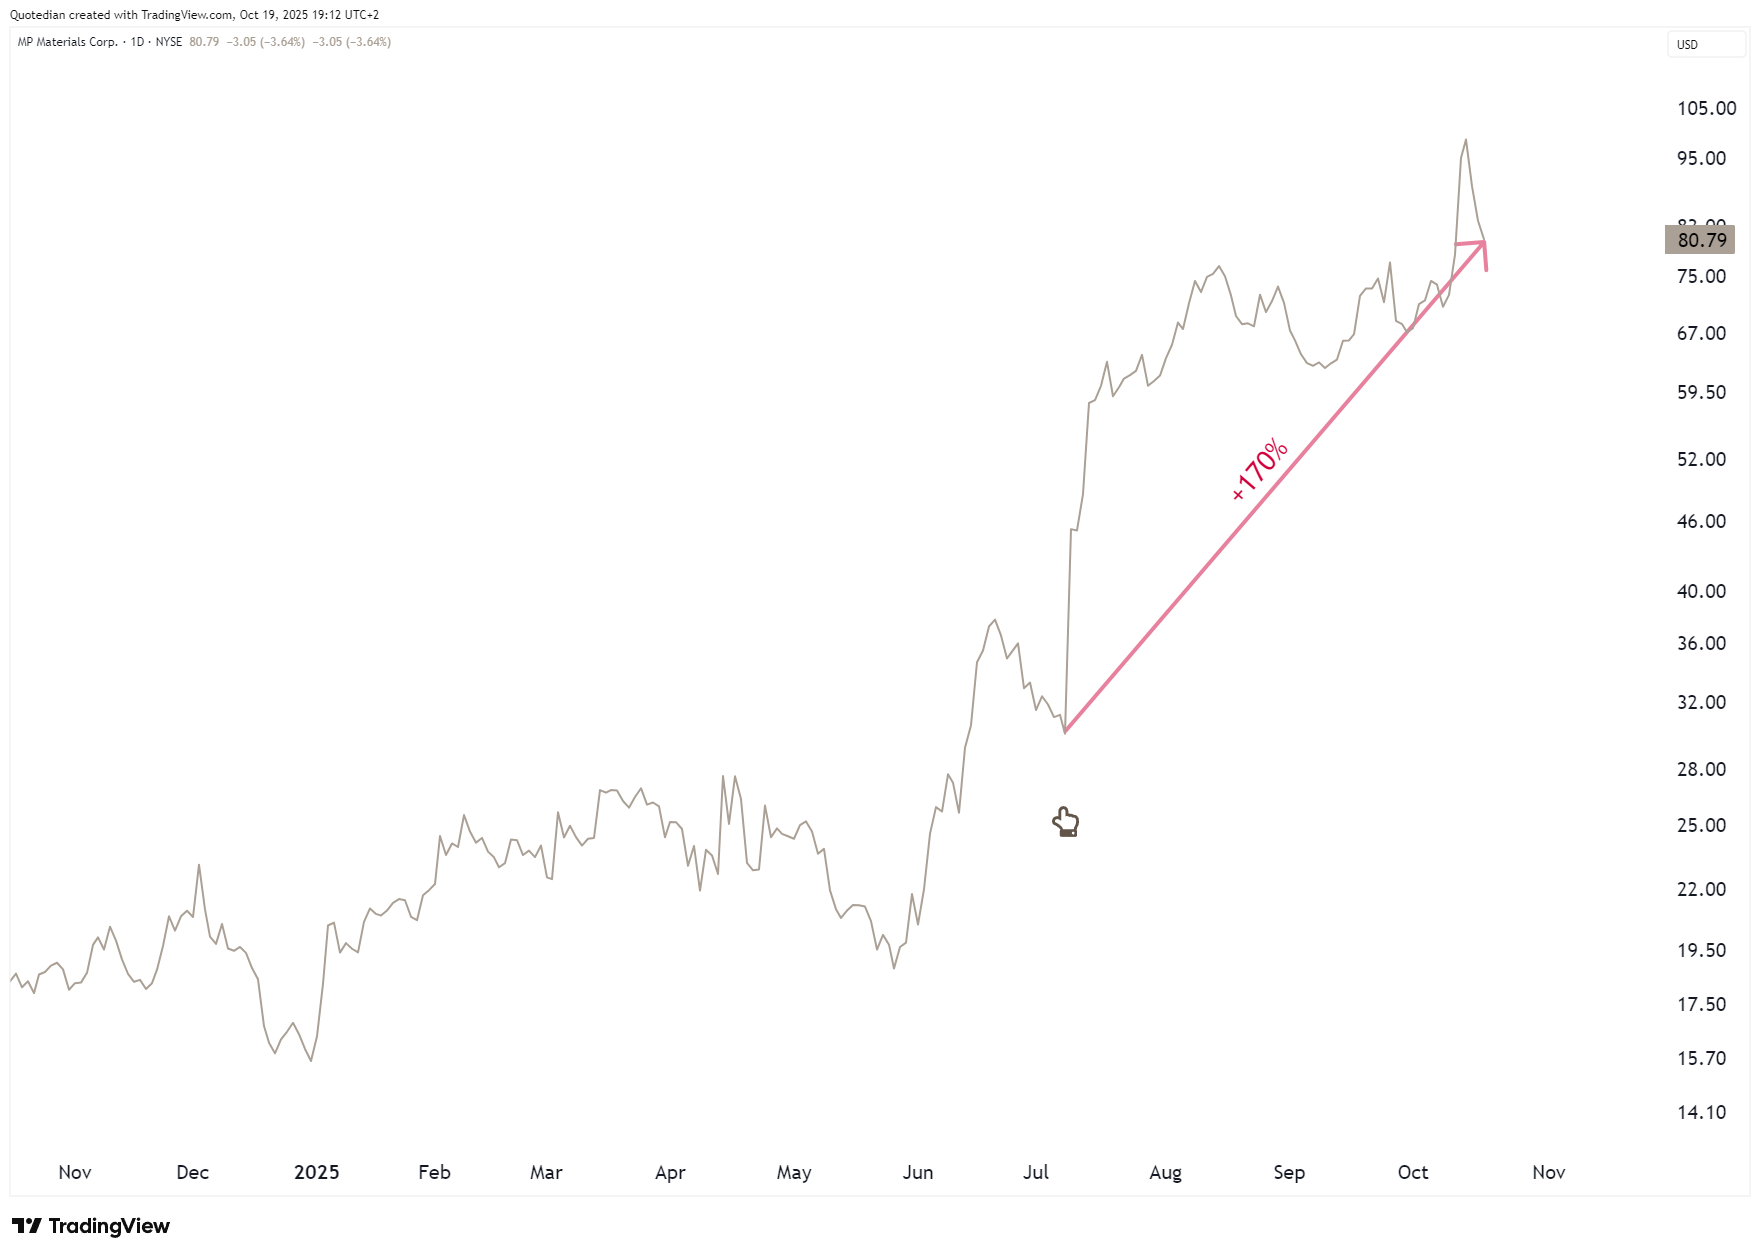
Hence, surprise, surprise, recently the US Government announced investments in rare earth suppliers such as MP,
or Trilogy Metals:
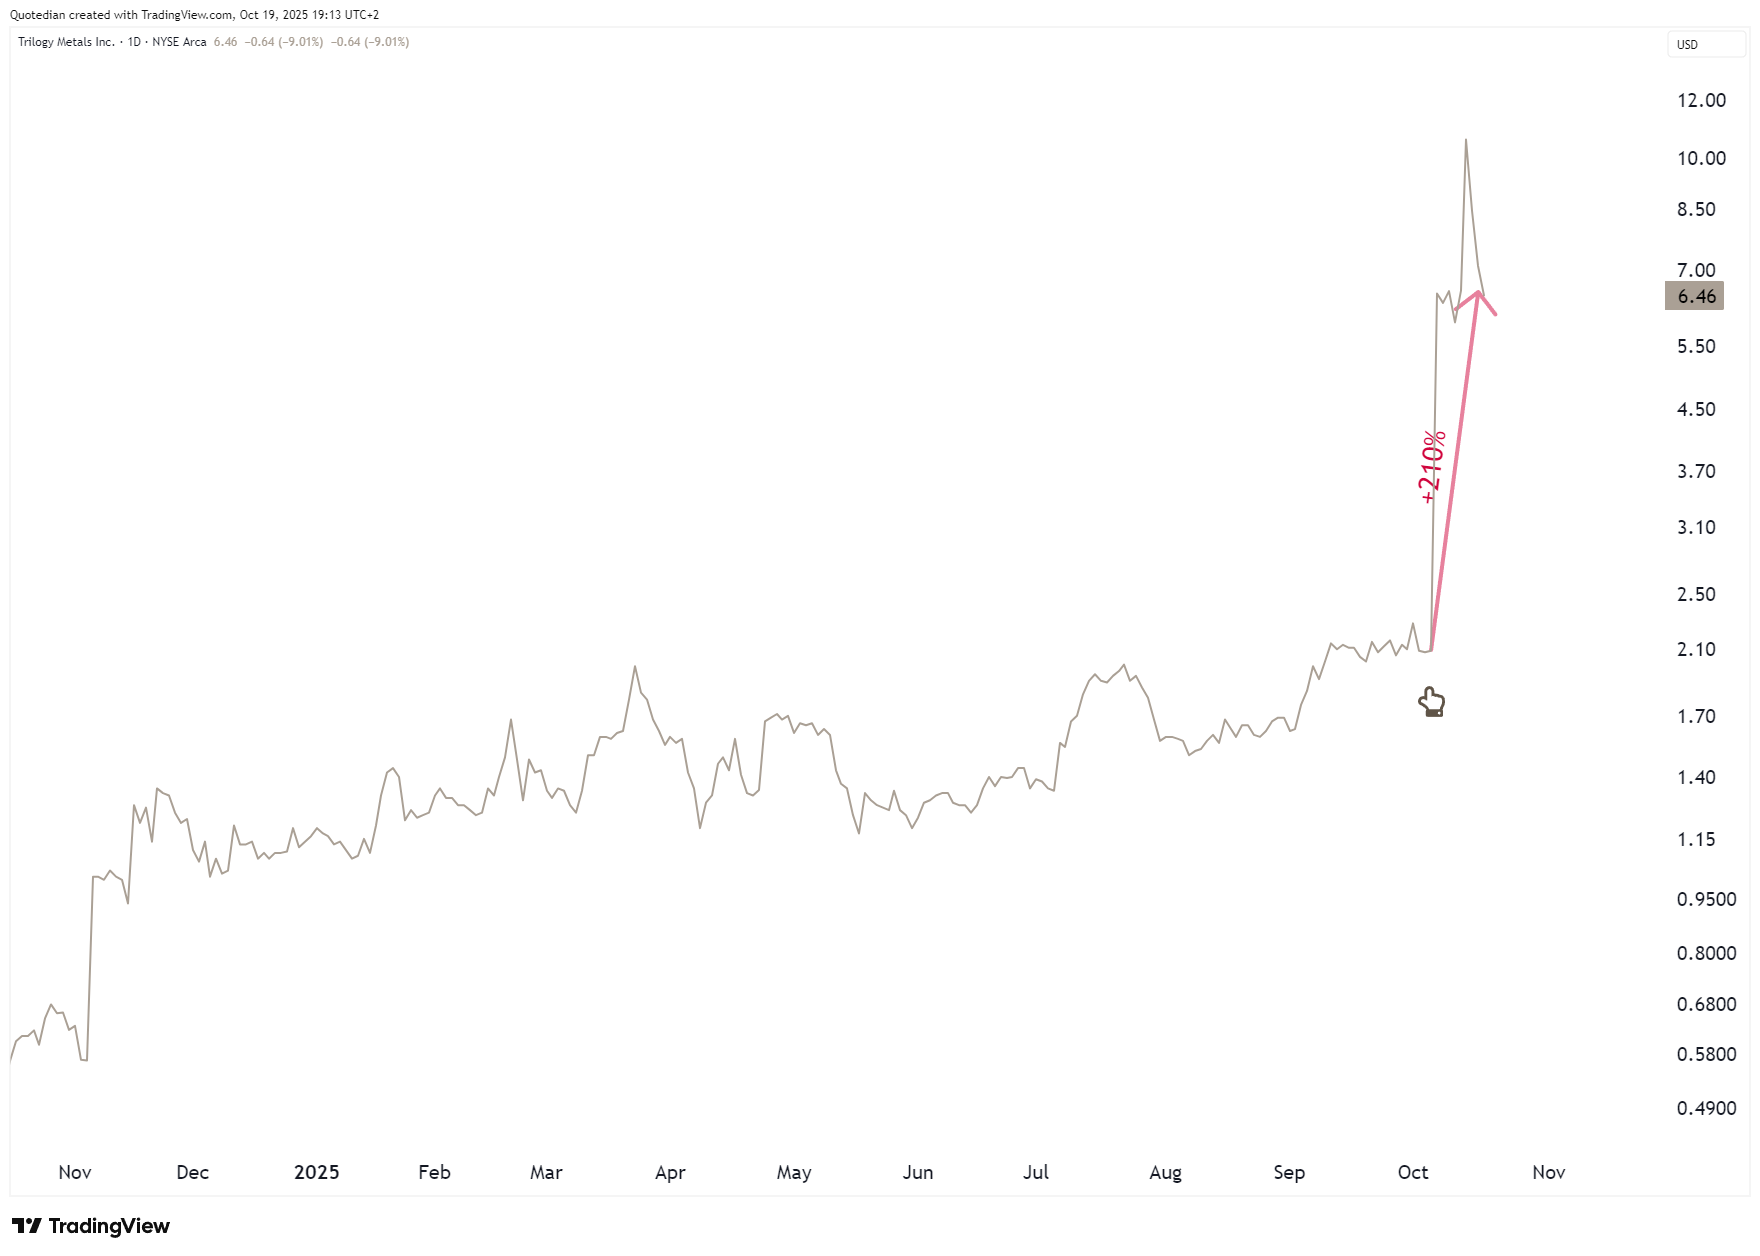
Also, they had announced a massive investment in Intel:
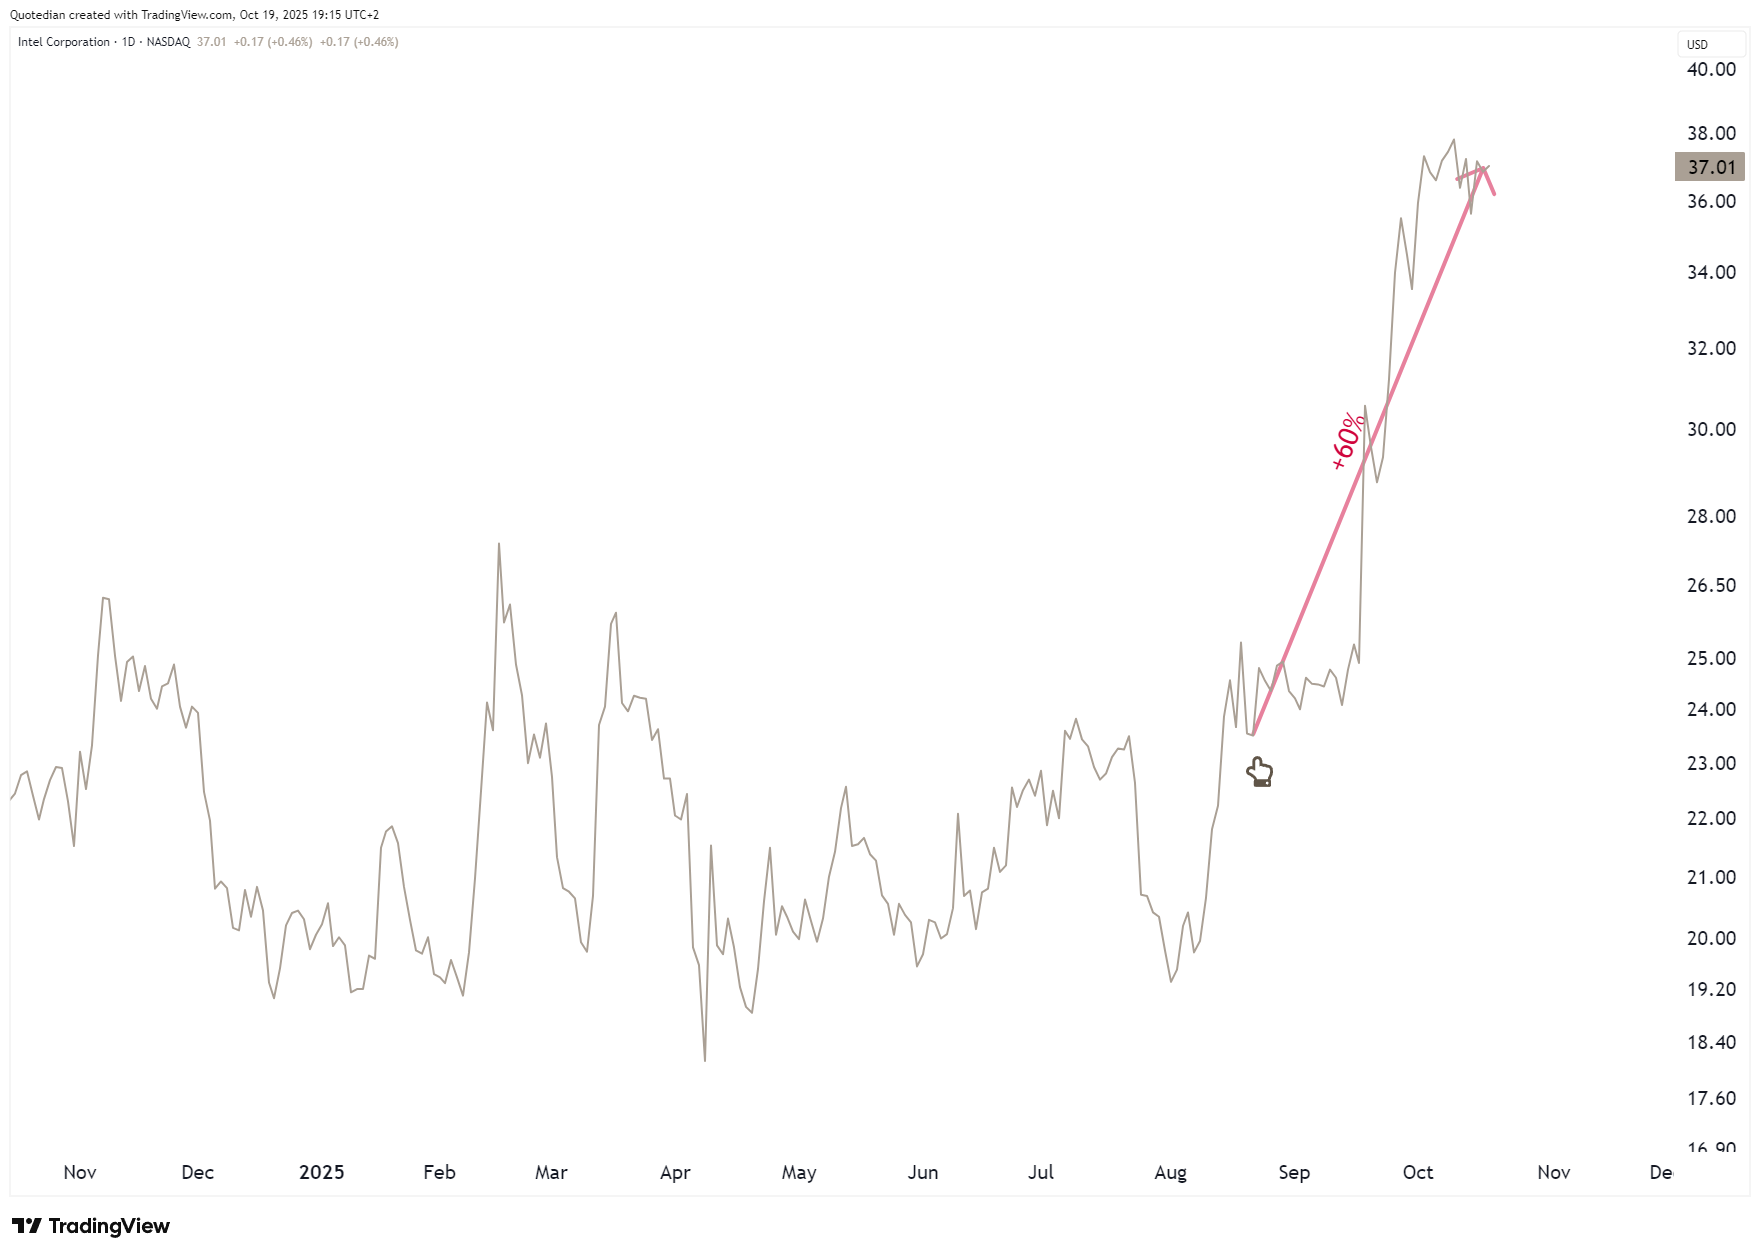
Dude, if you still don’t get it:
DO NOT INVEST WHERE THE PUCK HAS BEEN (MAG 7), BUT RATHER WHERE IT IS GOING (FOLLOW THE GOVERNMENT):
The whole rare earth story starts to look like a strategic mistake to rank with Germany’s decision to rely on energy supplied by Russia and if President Trump even mixes up raw with rare, well … (check video below starting around 07:45 for the raw earth moment just beyond the eight minutes time mark):
(or click here for another angle)
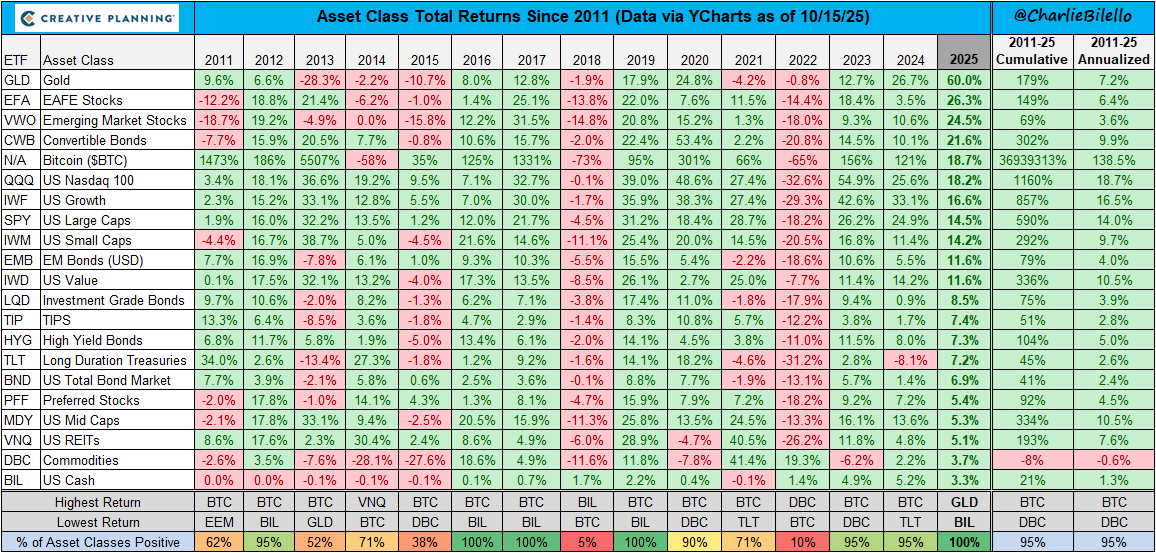
But before we go (albeit only briefly) through our usual sections, here’s an excellent table from the always formidable Charlie Bilello, showing that even the worst investors had a hard time losing money this year:

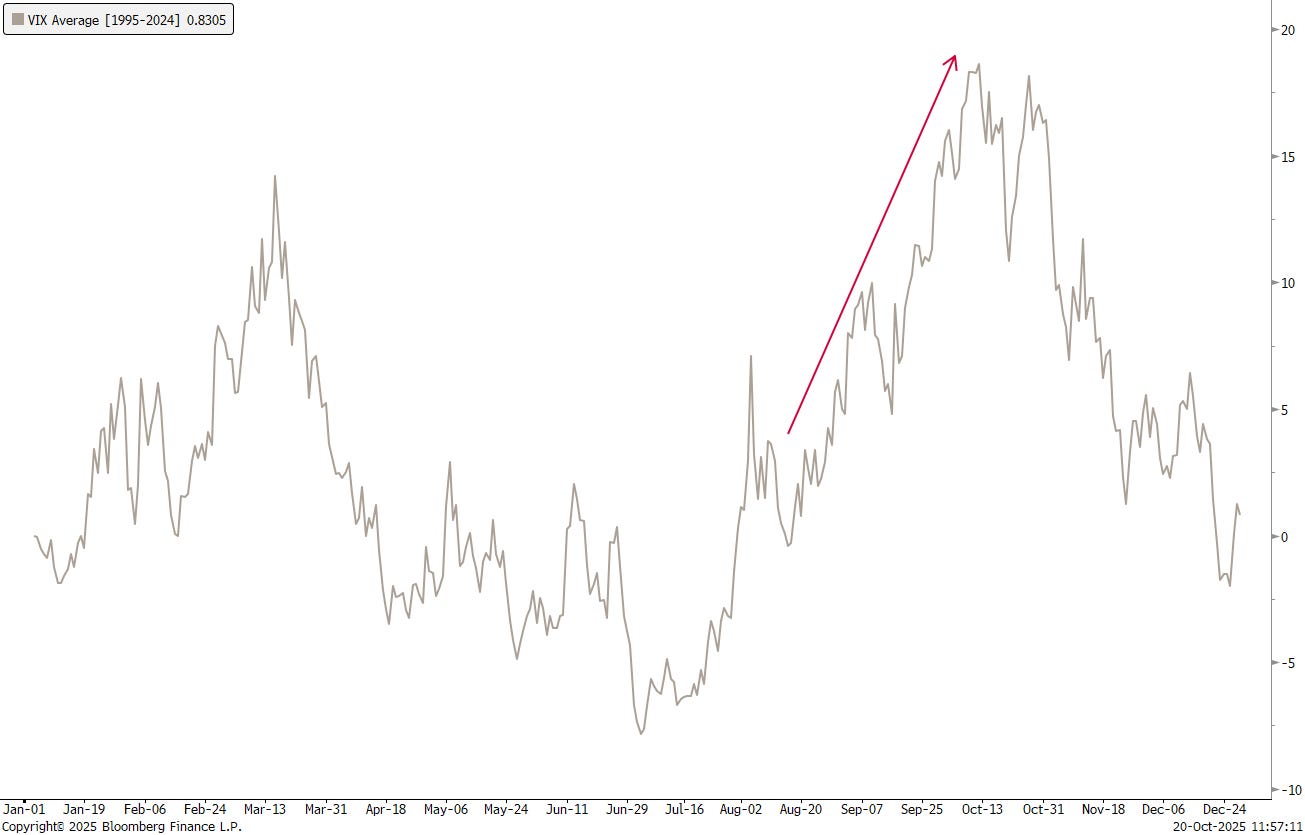
Stocks markets have been a bit rocky since late September/early October, with volatility picking up. Here’s the CBOE S&P 500 Volatility Index, better known as the VIX:
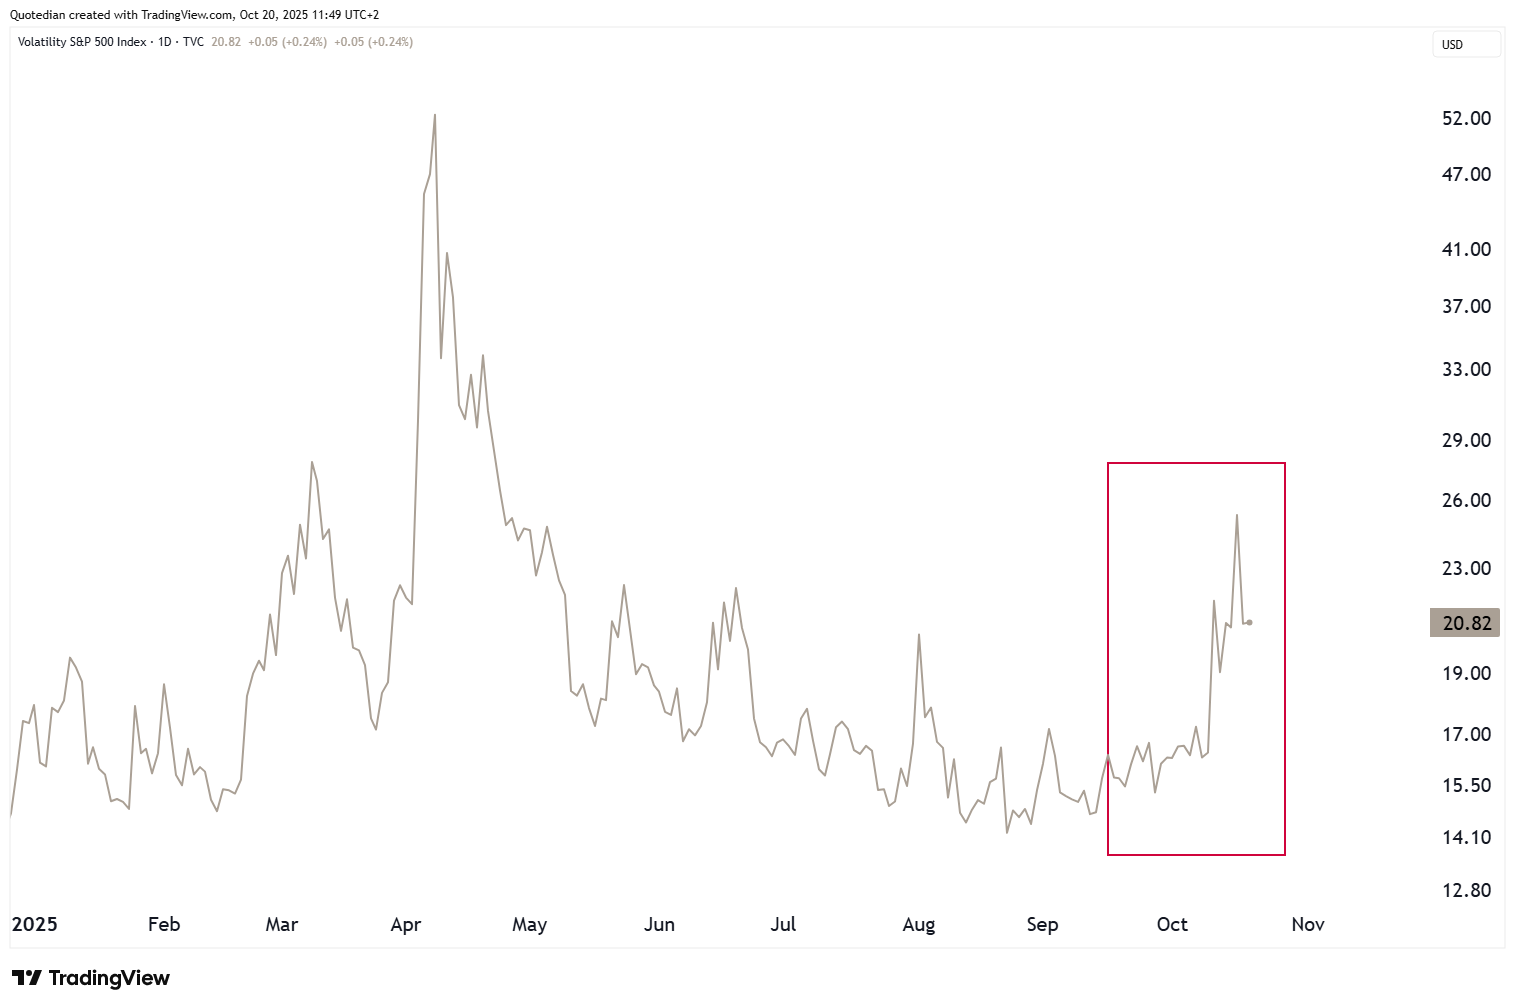
However, as we have discussed in this space before and as Mark Twain well knew, a pick-up in volatility in Autumn and especially in October is not untypical:

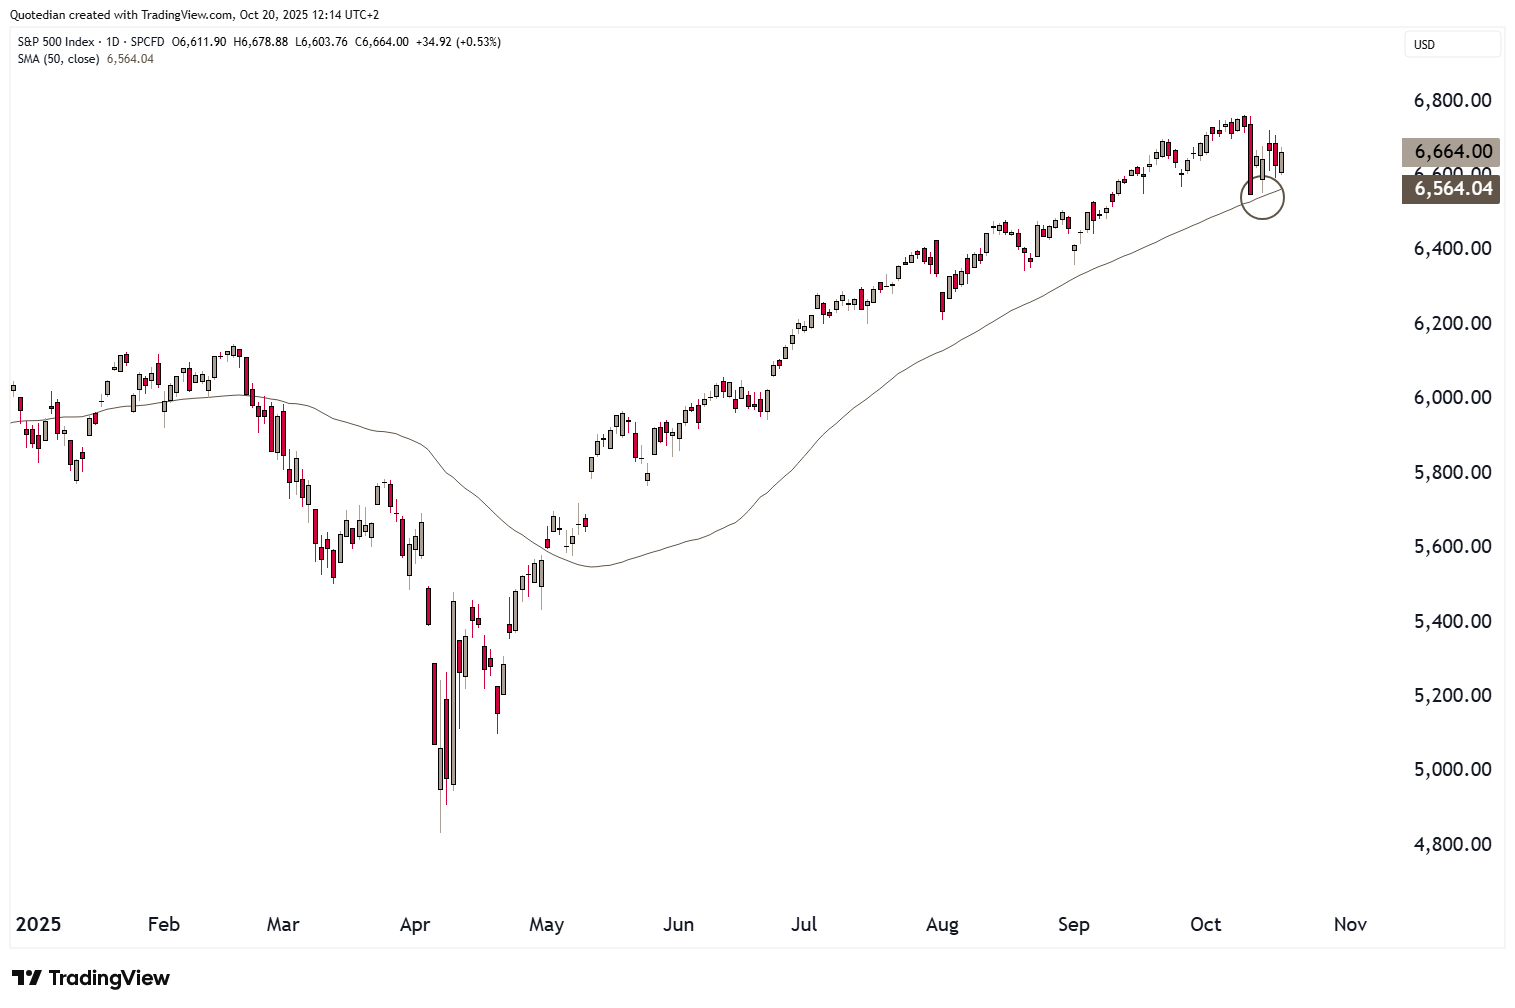
For now, the correction on the S&P 500 has been limited, with the 50-day moving average once again providing good support:
There’s a small chance of a shoulder-head-shoulder pattern forming, which could take the index down to 6,350ish (-5% from current level) if the neckline at 6,550 should break:
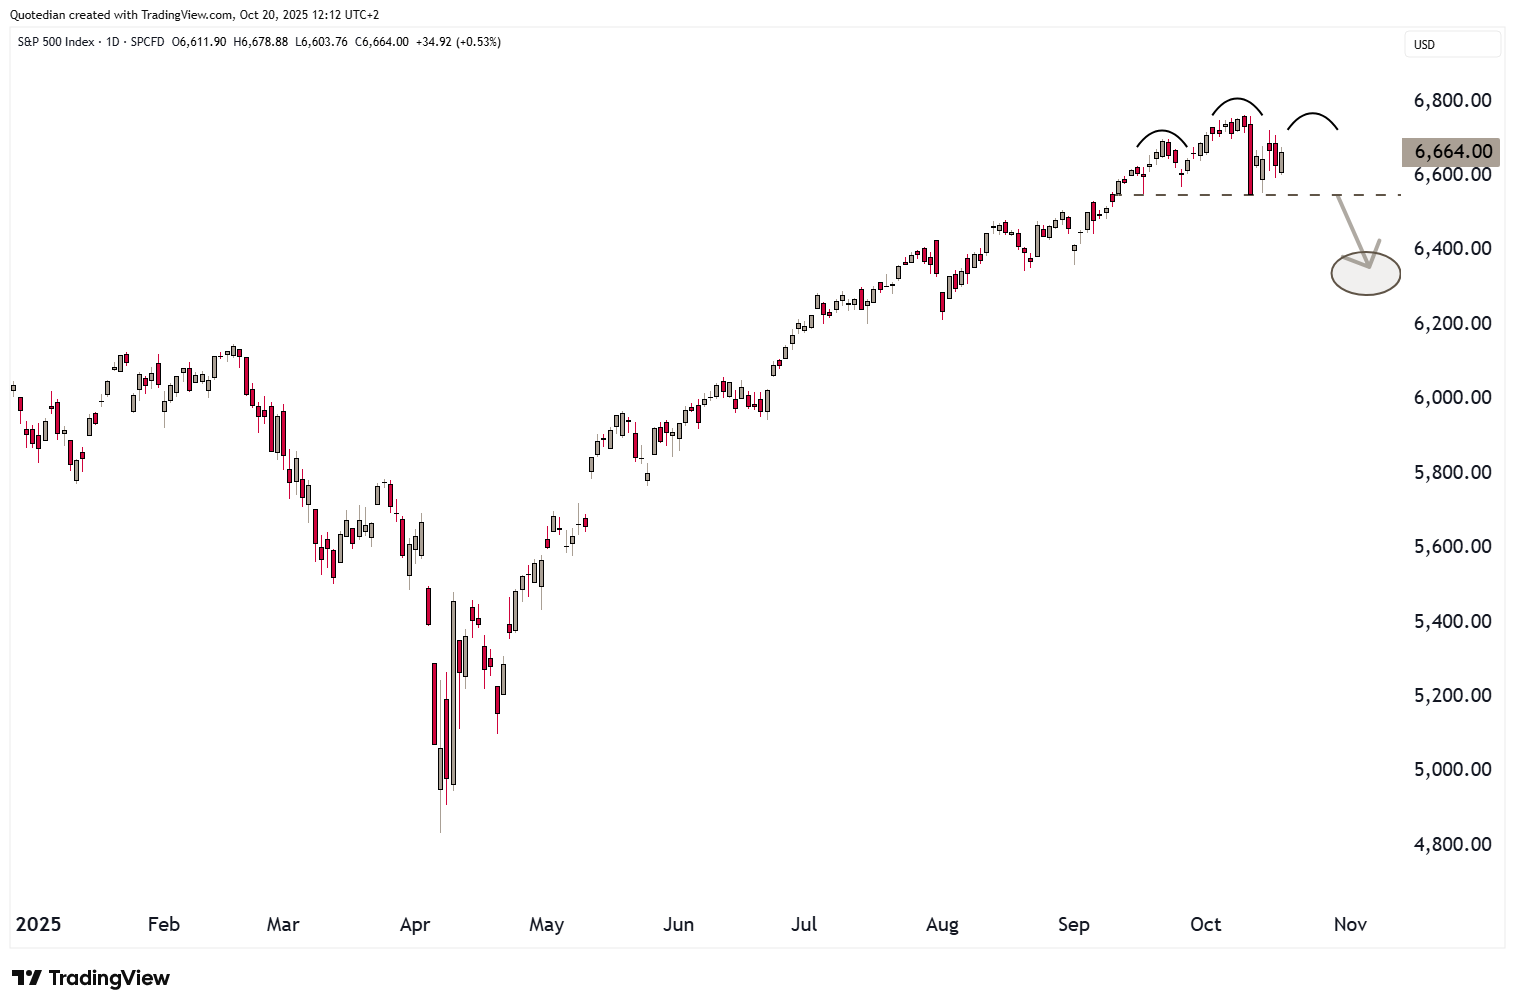
But given that we are entering now into positive seasonality, it is rather likely that this well turn out to be a failed reversal pattern and hence pretty bullish for stocks.
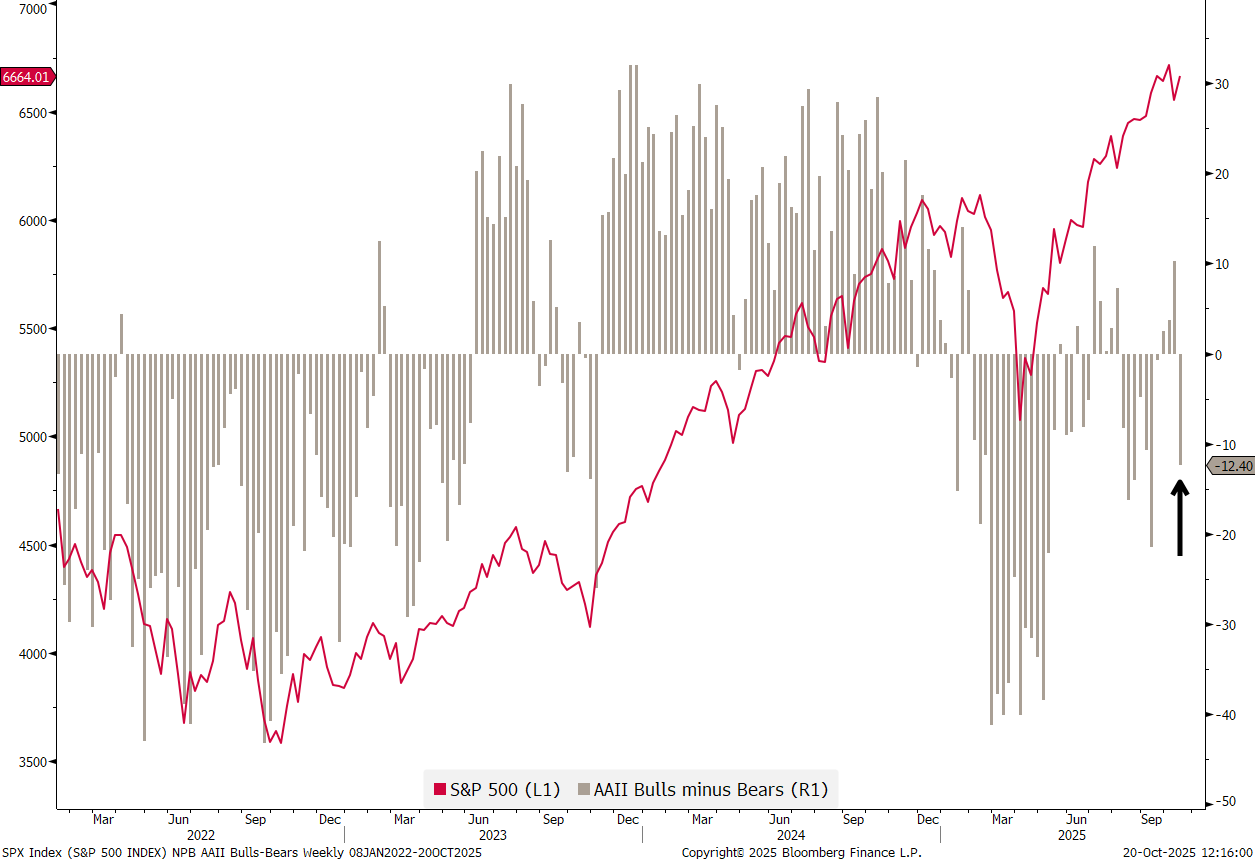
This is further helped by negative sentiment towards stocks, as seen in the AAII bears gaining overhand again,
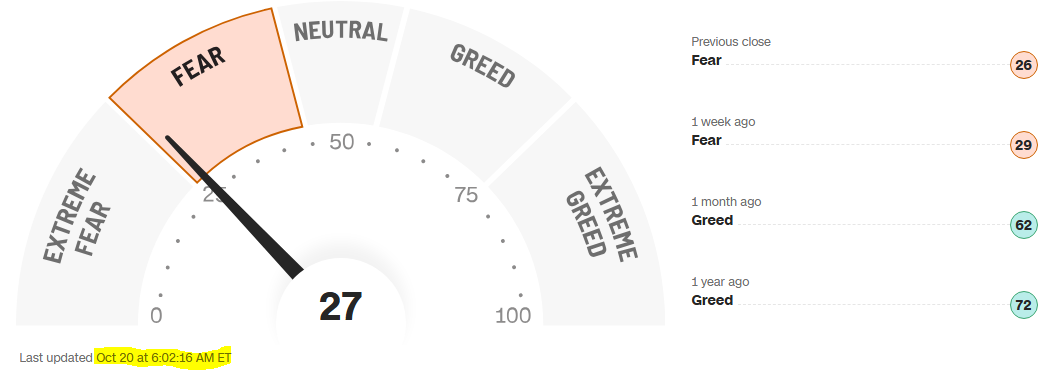
a CNN Greed and Fear indicator that is in Fear territory,
and last but not least a BofA Global Fund Managers Survey (FMS) showing that every professional money manager and their mothers think that stocks are overvalued:
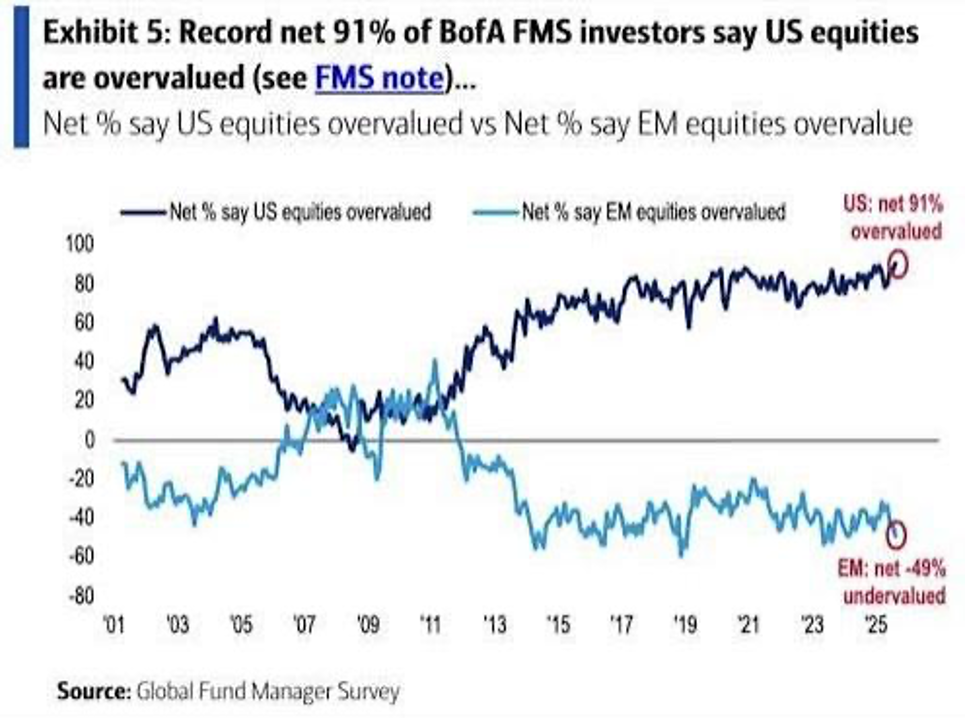
Hence, as we wrote in our latest quarterly investment outlook (click here), embrace the bubble (for now).

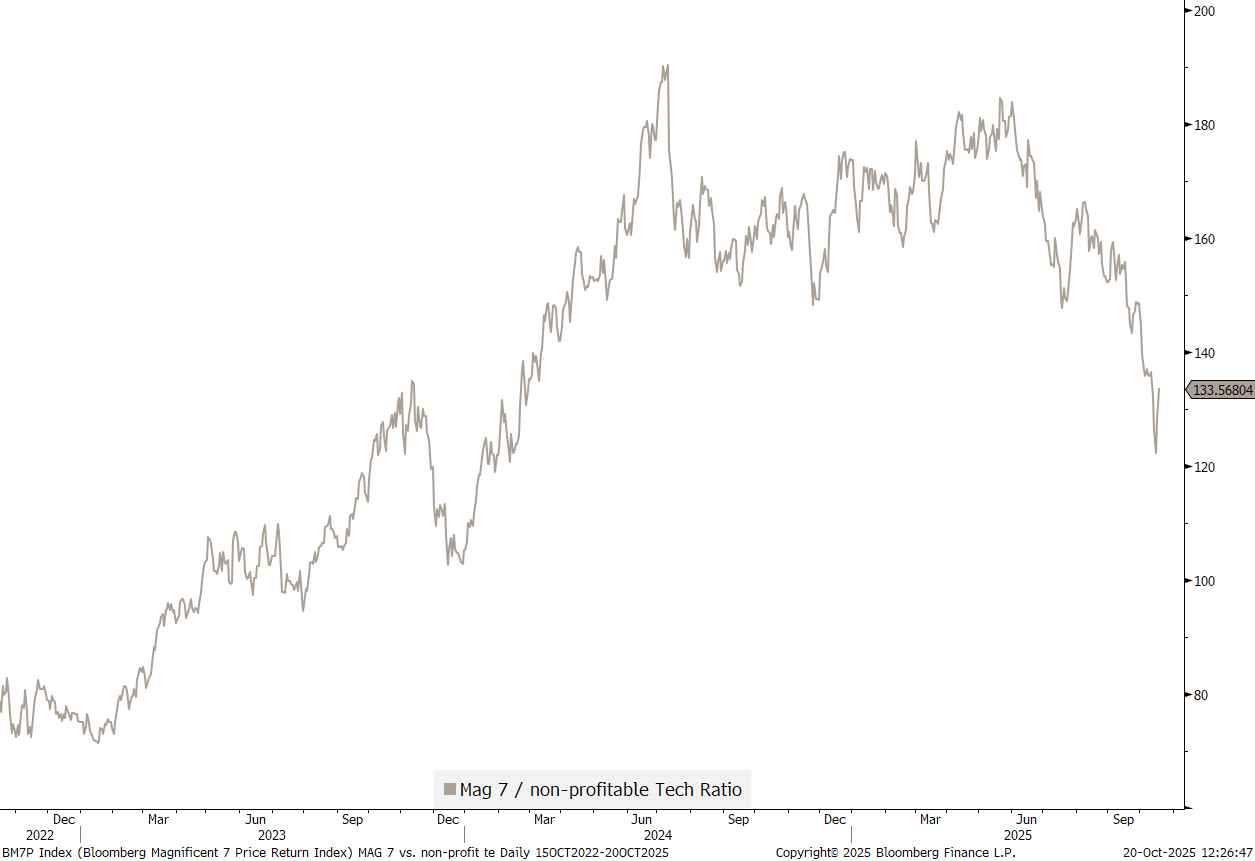
Though even I have to admit that the rally has been a bit “trashy” recently. Here’s the ratio of the Magnificent Seven stocks to the GS non-profitable tech index:
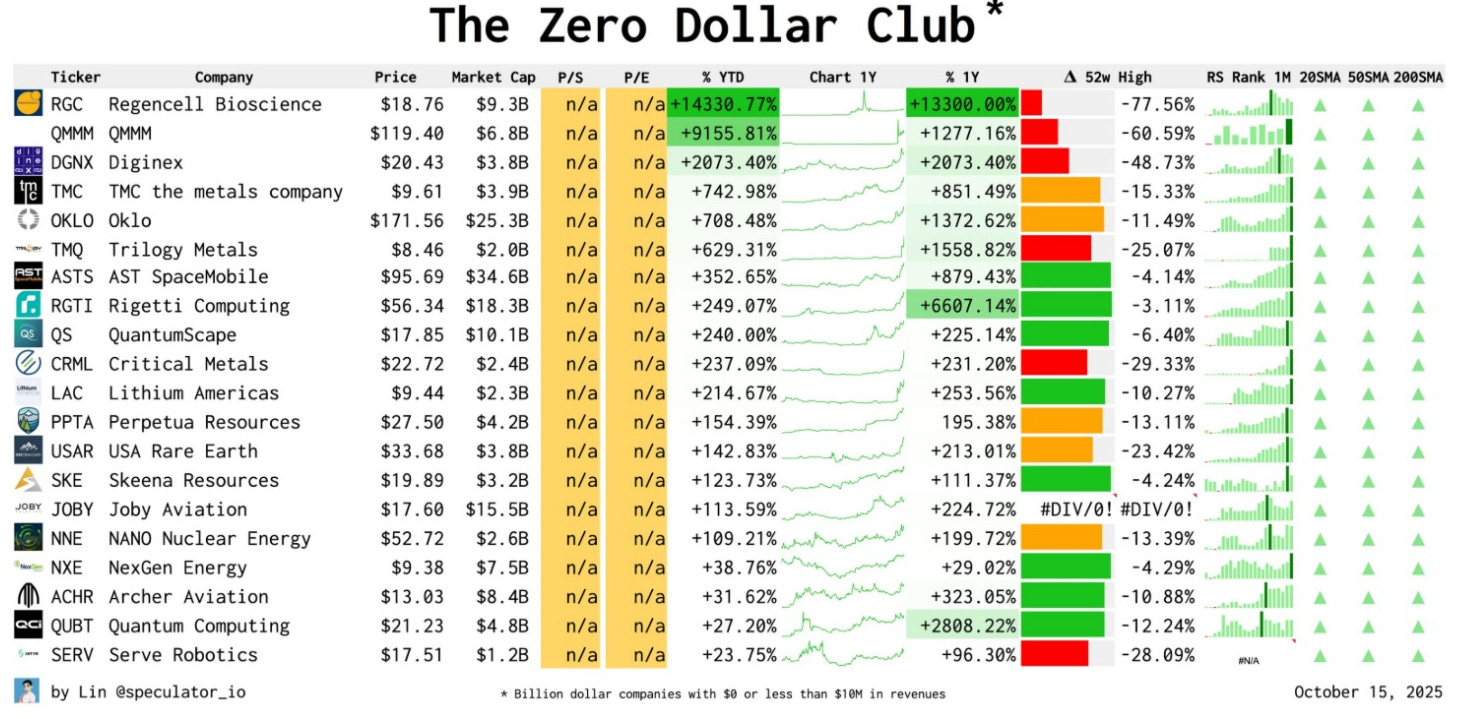
And here’s an interesting table of some of the best performing “investments” with their respective earnings (hint: none) this year:

US small cap stocks (Russell 2000) continue to struggle to move significantly beyond their 2022 highs (dashed line):
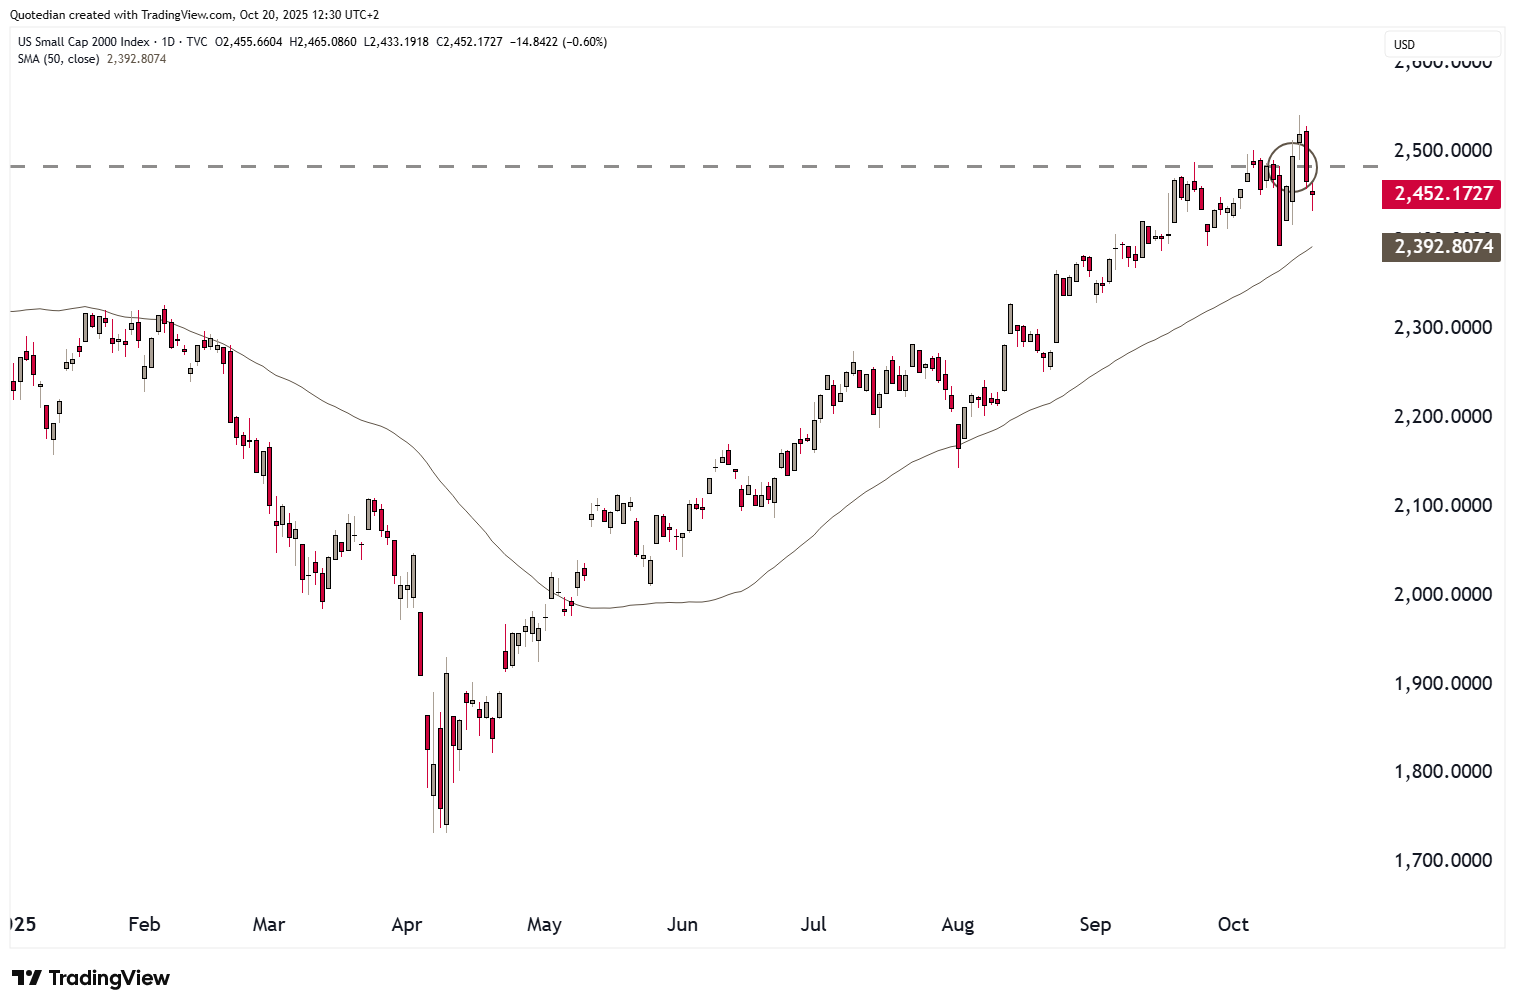
Coming FOMC interest rate cuts (see rates section below), should help small cap stocks over the coming months to move higher.
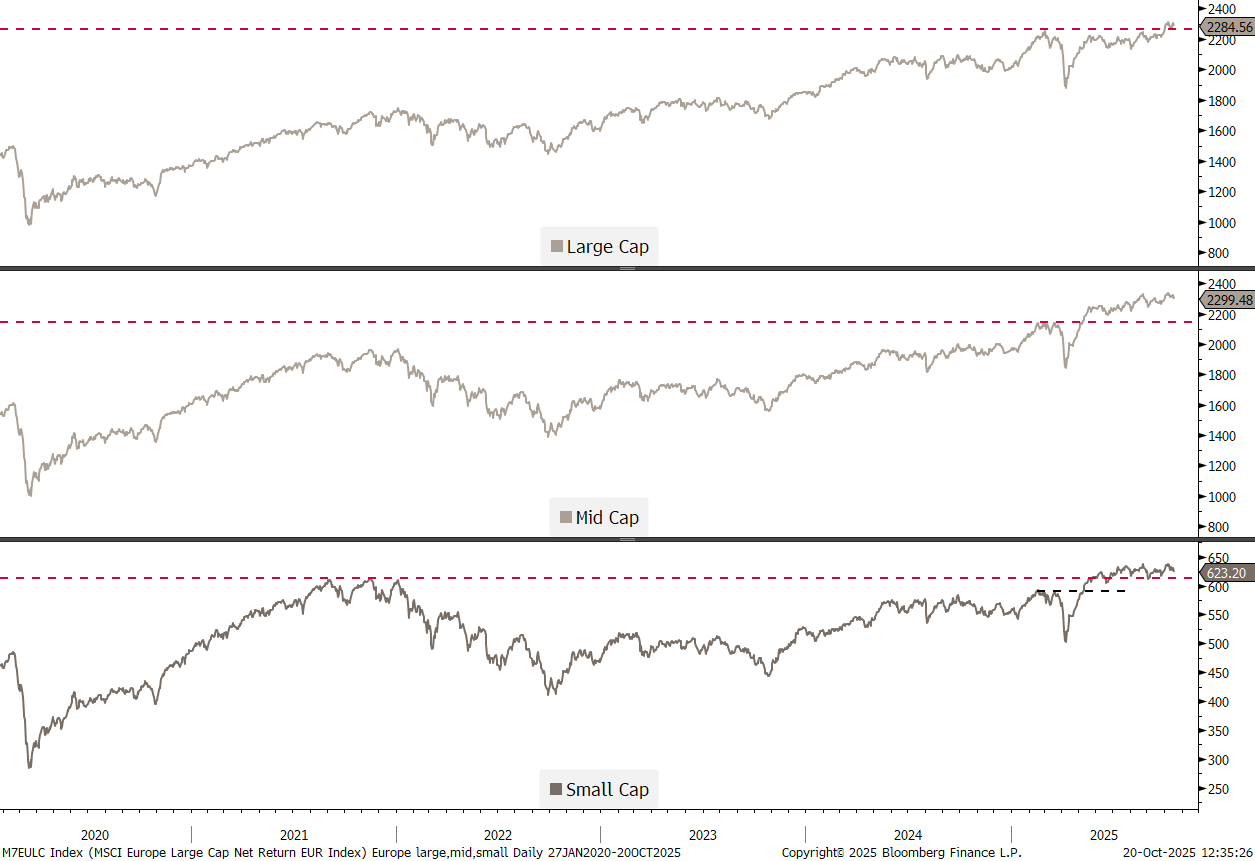
In Europe, where the rate cutting cycle has probably ended, small- and mid-cap stocks have broken above their previous (all-time) cycle highs a while ago:
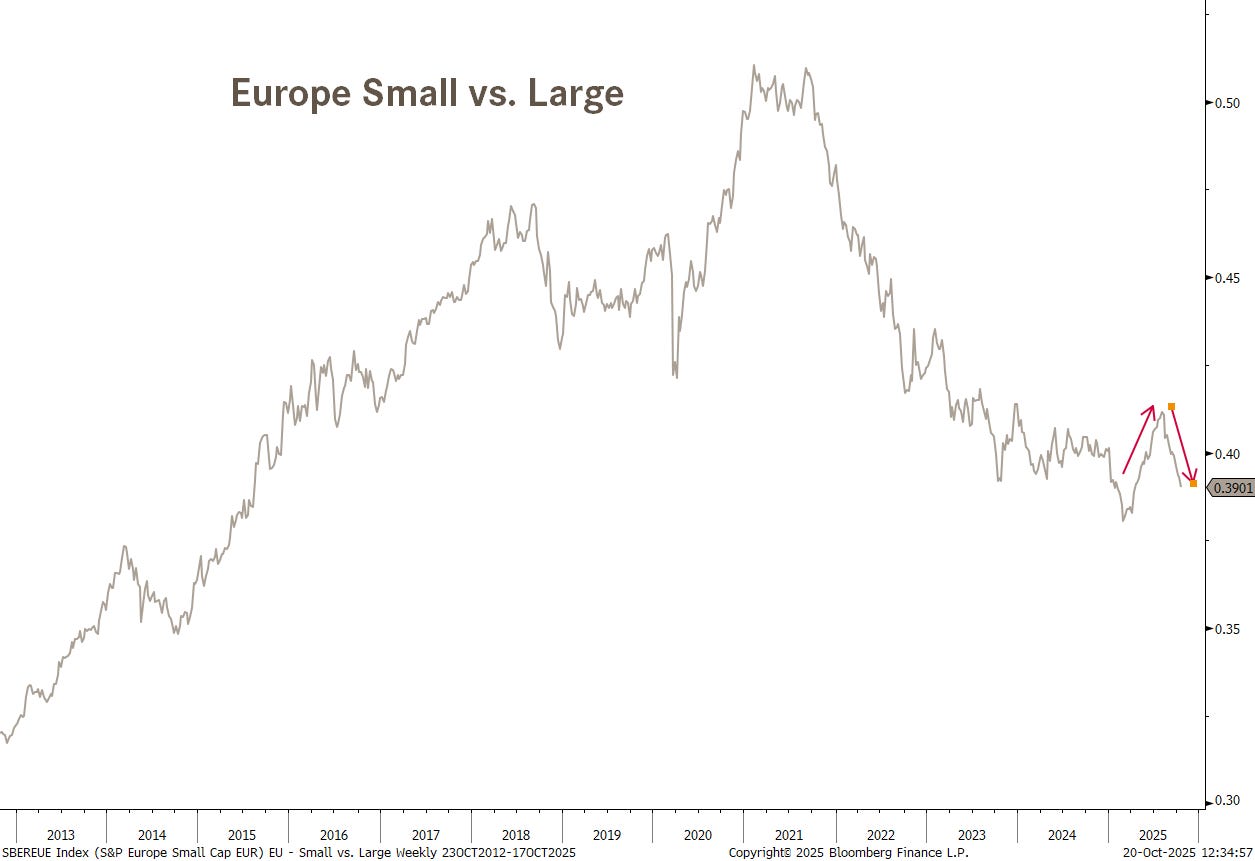
Though in relative terms the continue to struggle to outperform their larger siblings:
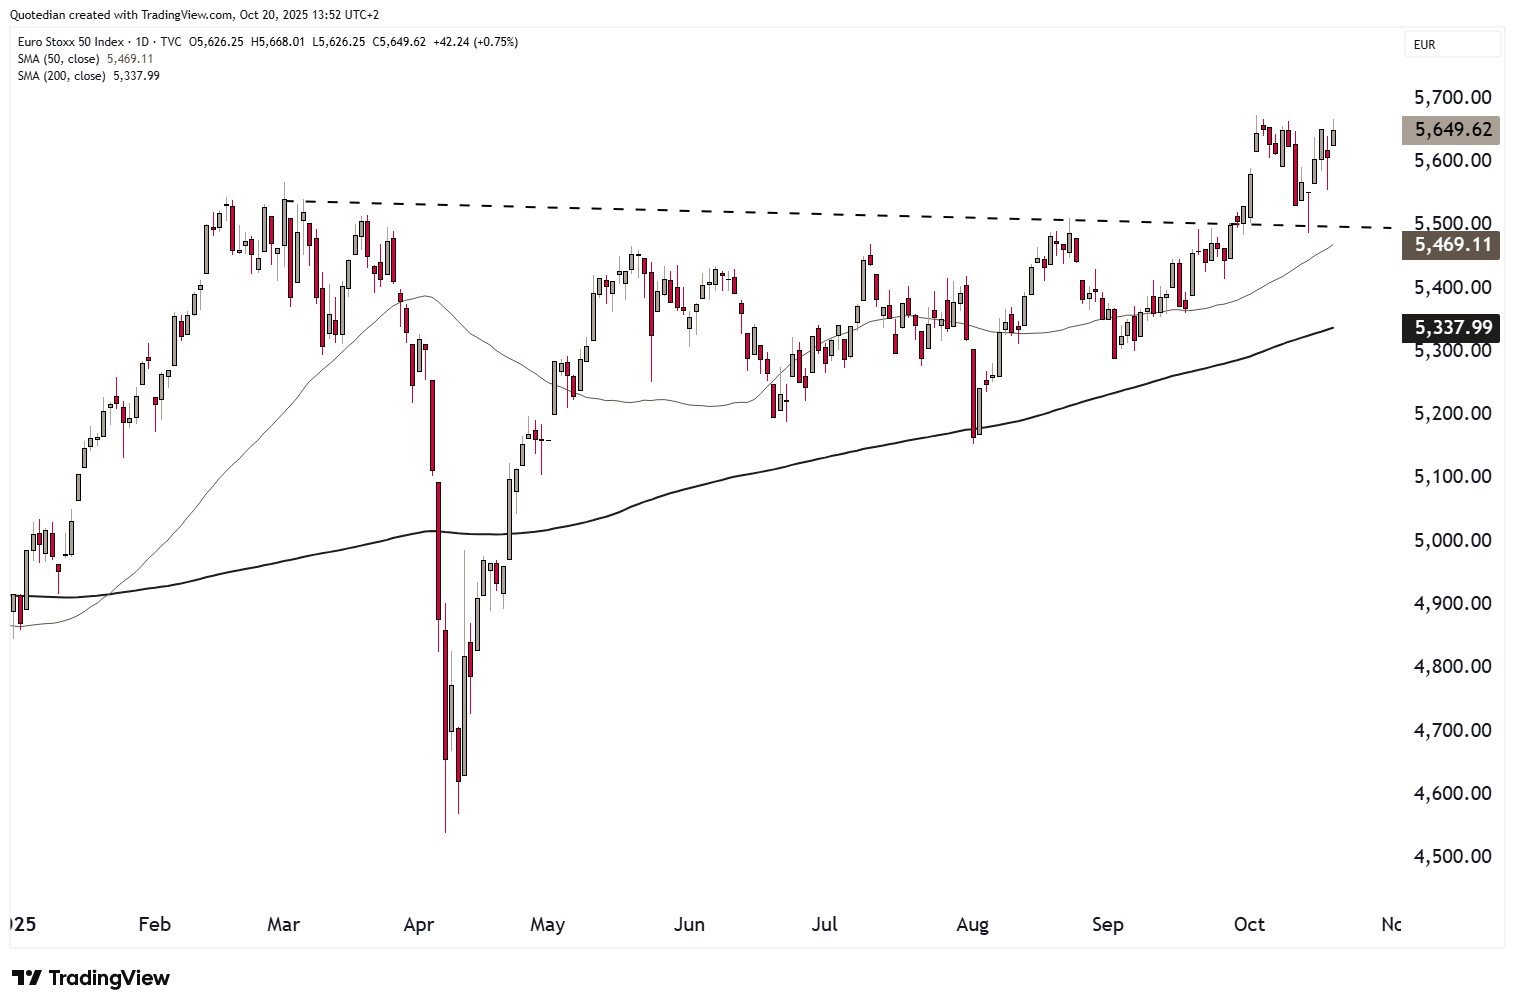
The chart of the Euro STOXX 50 looks bullish, with the index only a few basis points away from making a new ATH:
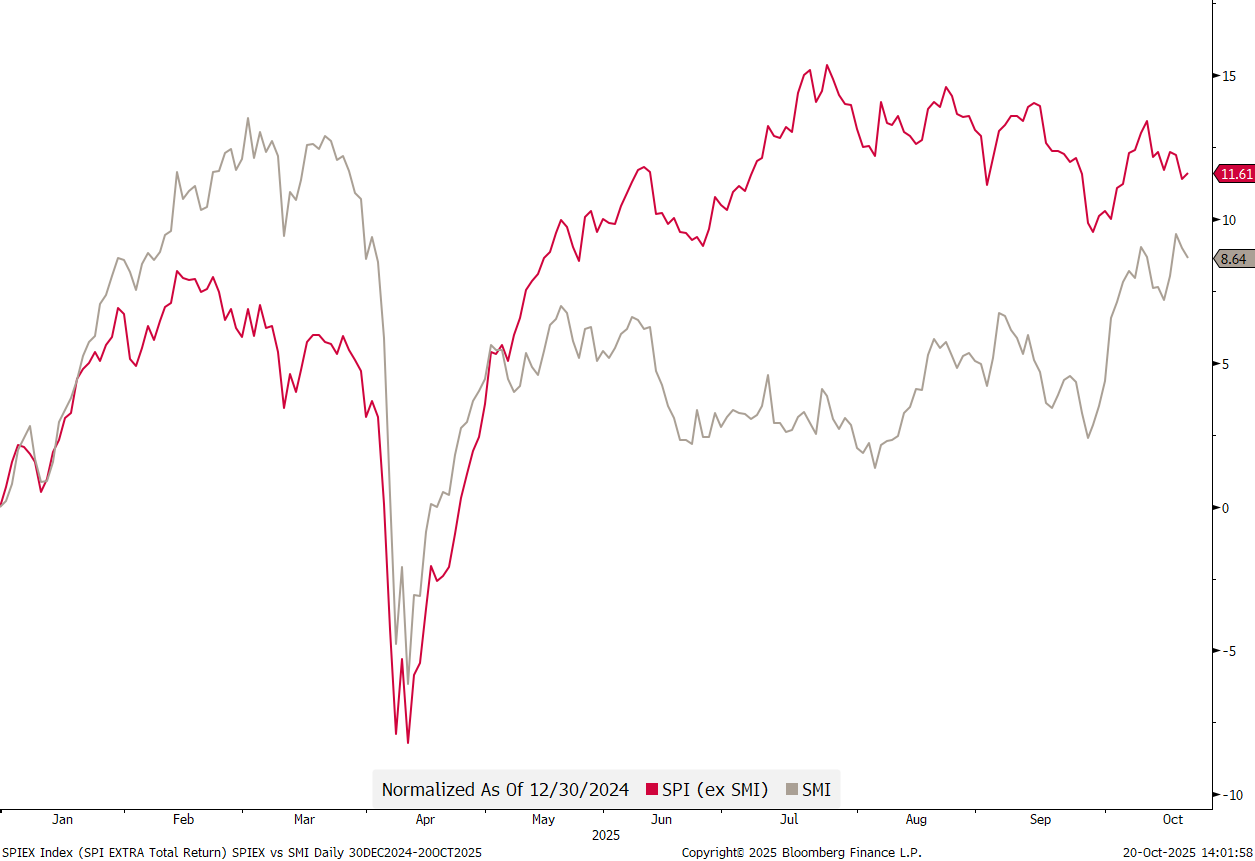
In Switzerland it had been best to invest away from the largest cap stocks (SMI) since liberation day … at least until early October; since then the performance “scissor” has been closing again:
In Japan, the Nikkei 225 closed up over three percent this morning at a new all-time high.
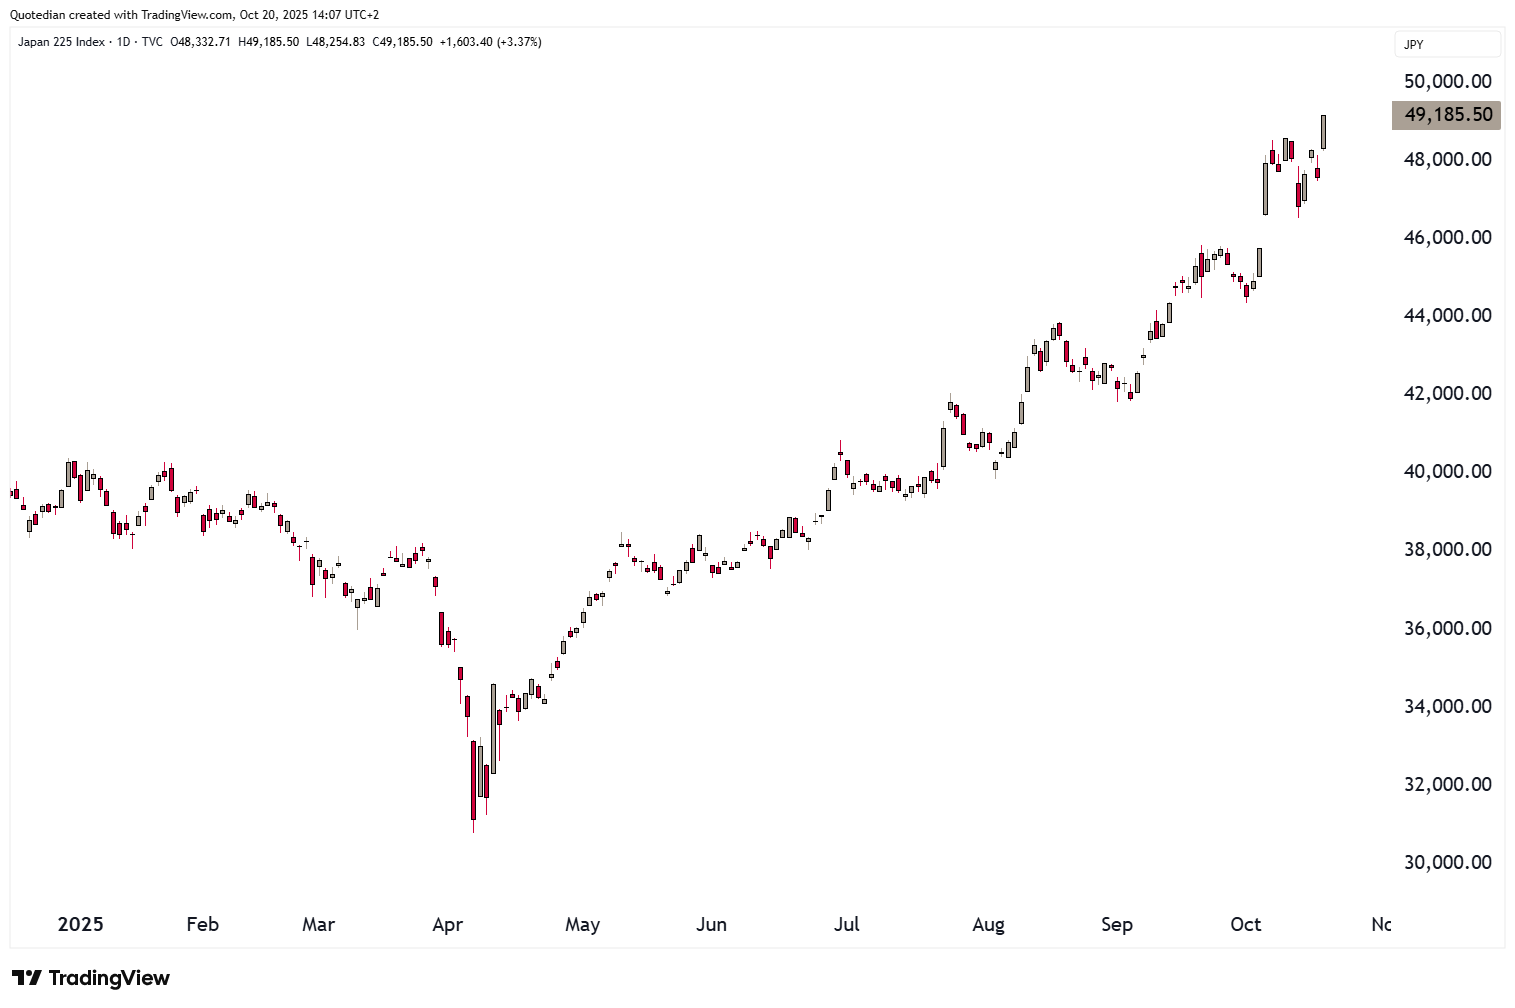
The reason given by Bloomberg for the fresh peak is that the ruling Liberal Democratic Party looks set to finalize a new coalition deal, fueling hopes that pro-stimulus Sanae Takaichi will become the nation’s next prime minister.
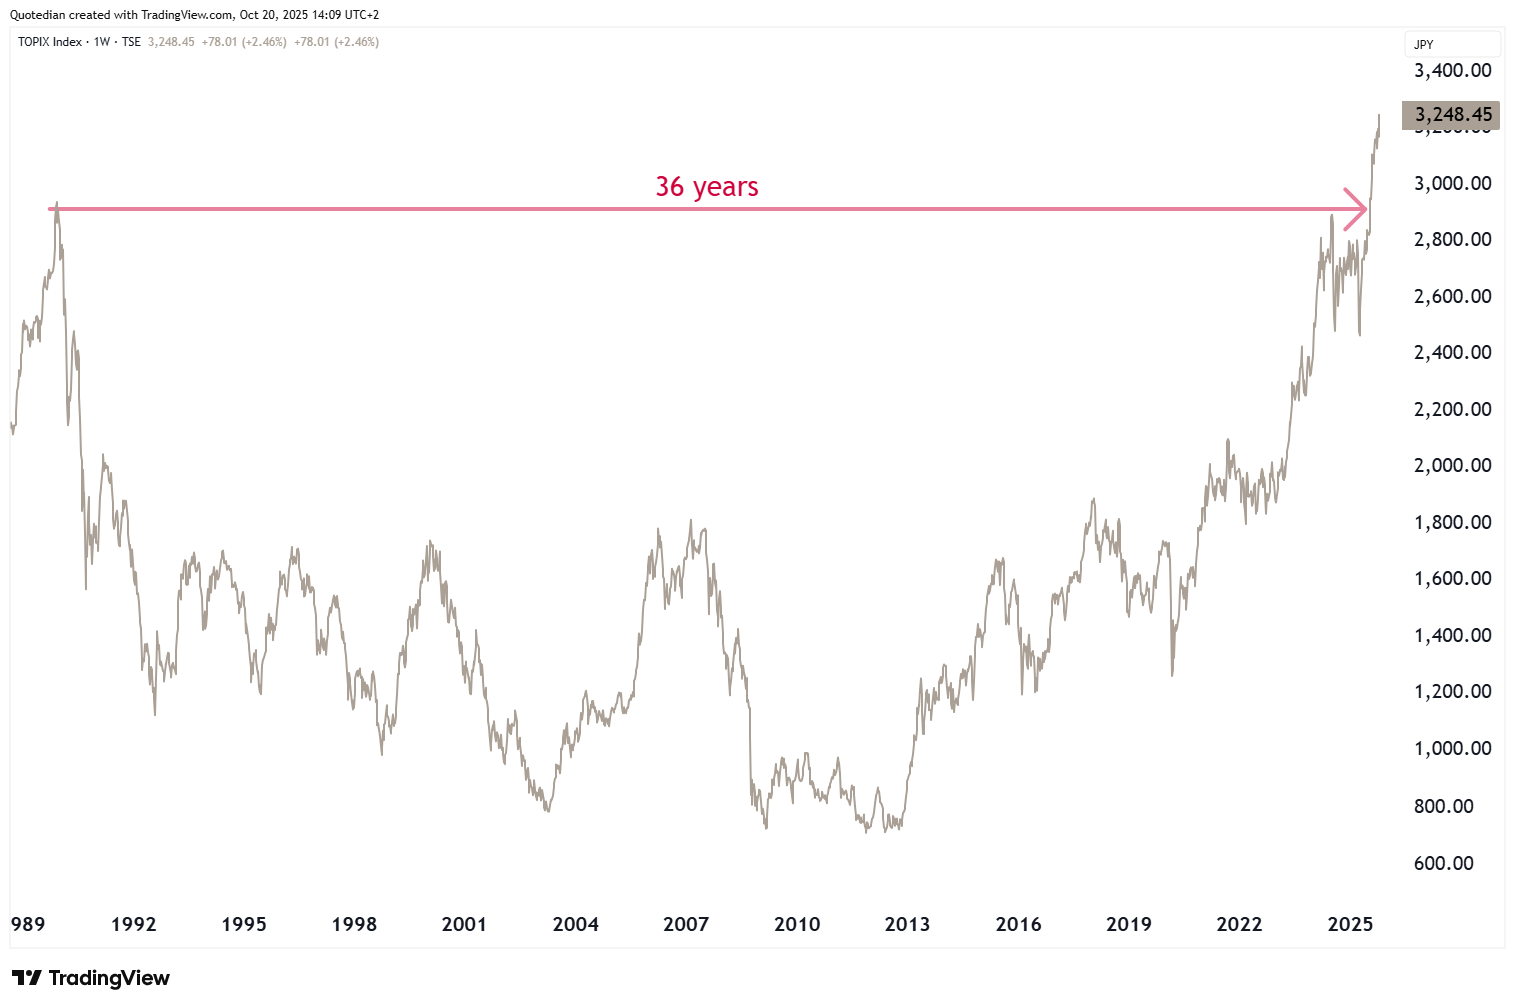
Perhaps. But to me the major reason for continued Japanese equity gains is expressed in this chart:
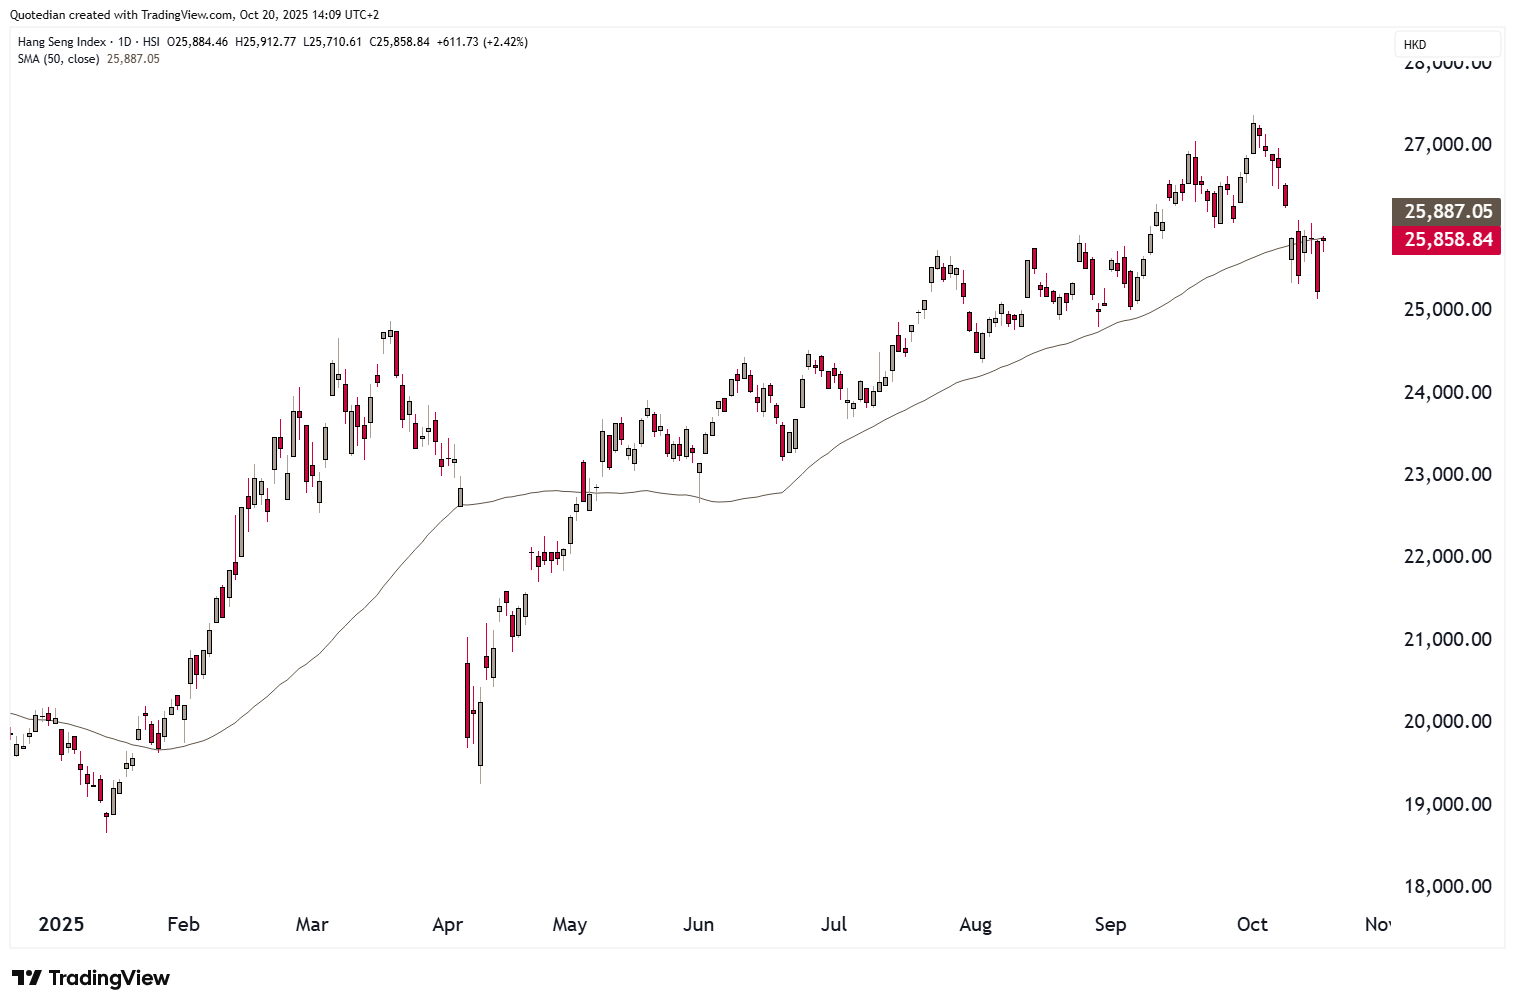
Hong Kong stocks (HSI) are battling with the 50-day moving average - a move above that threshold would be very constructive for the medium-term outlook:
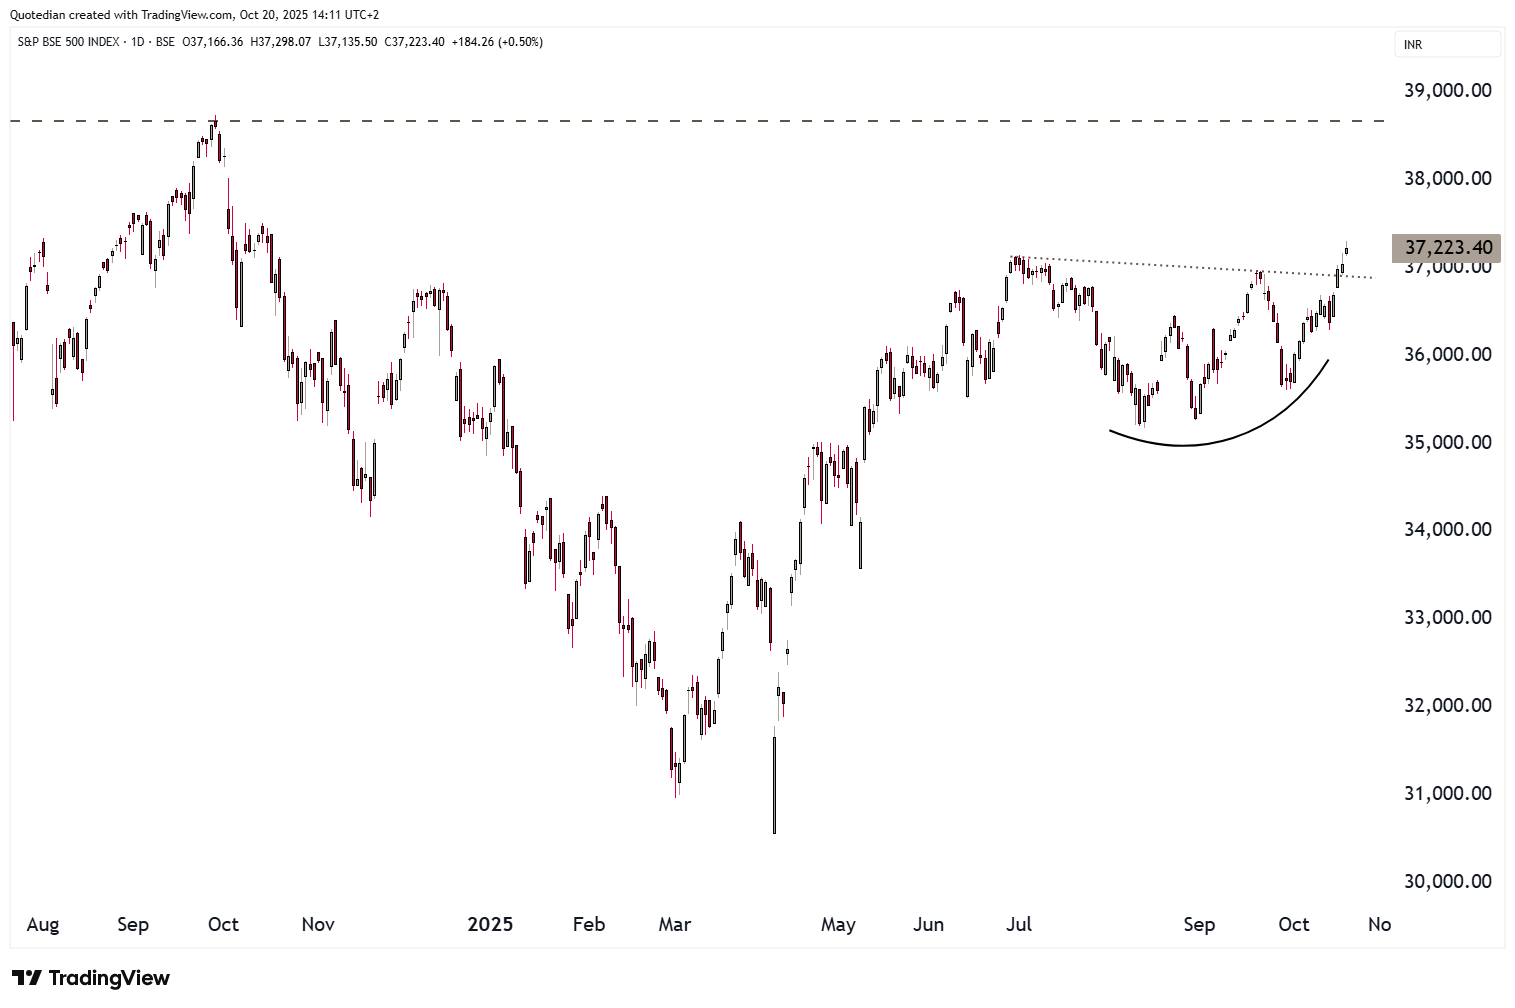
The Indian stock market has just given a very bullish buy signal, buy moving above the previous cycle high. The all-time high on the BSE 500 is now suddenly only four percent away from current levels:
Two more charts on the same subject to end the equity section.
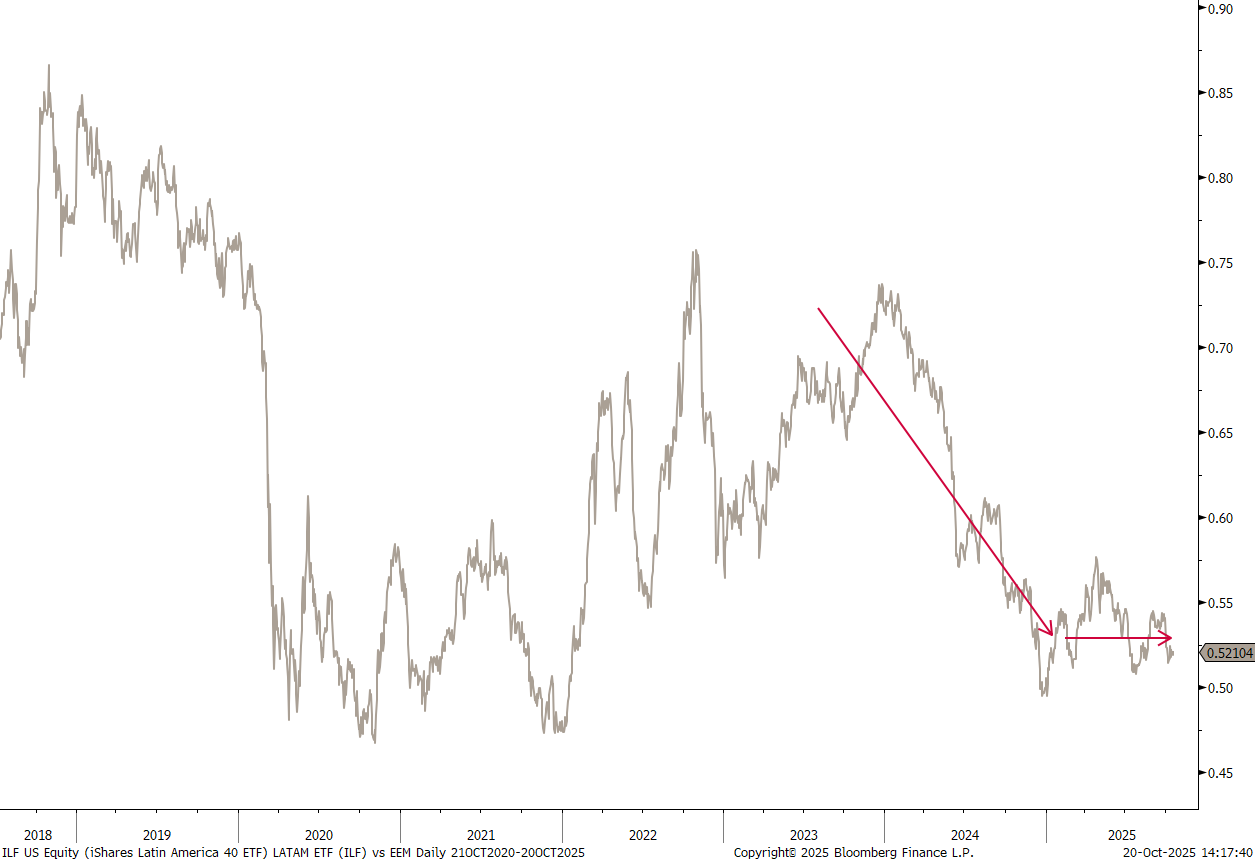
Latin America stocks have been relative underperformers to the wider emerging markets:
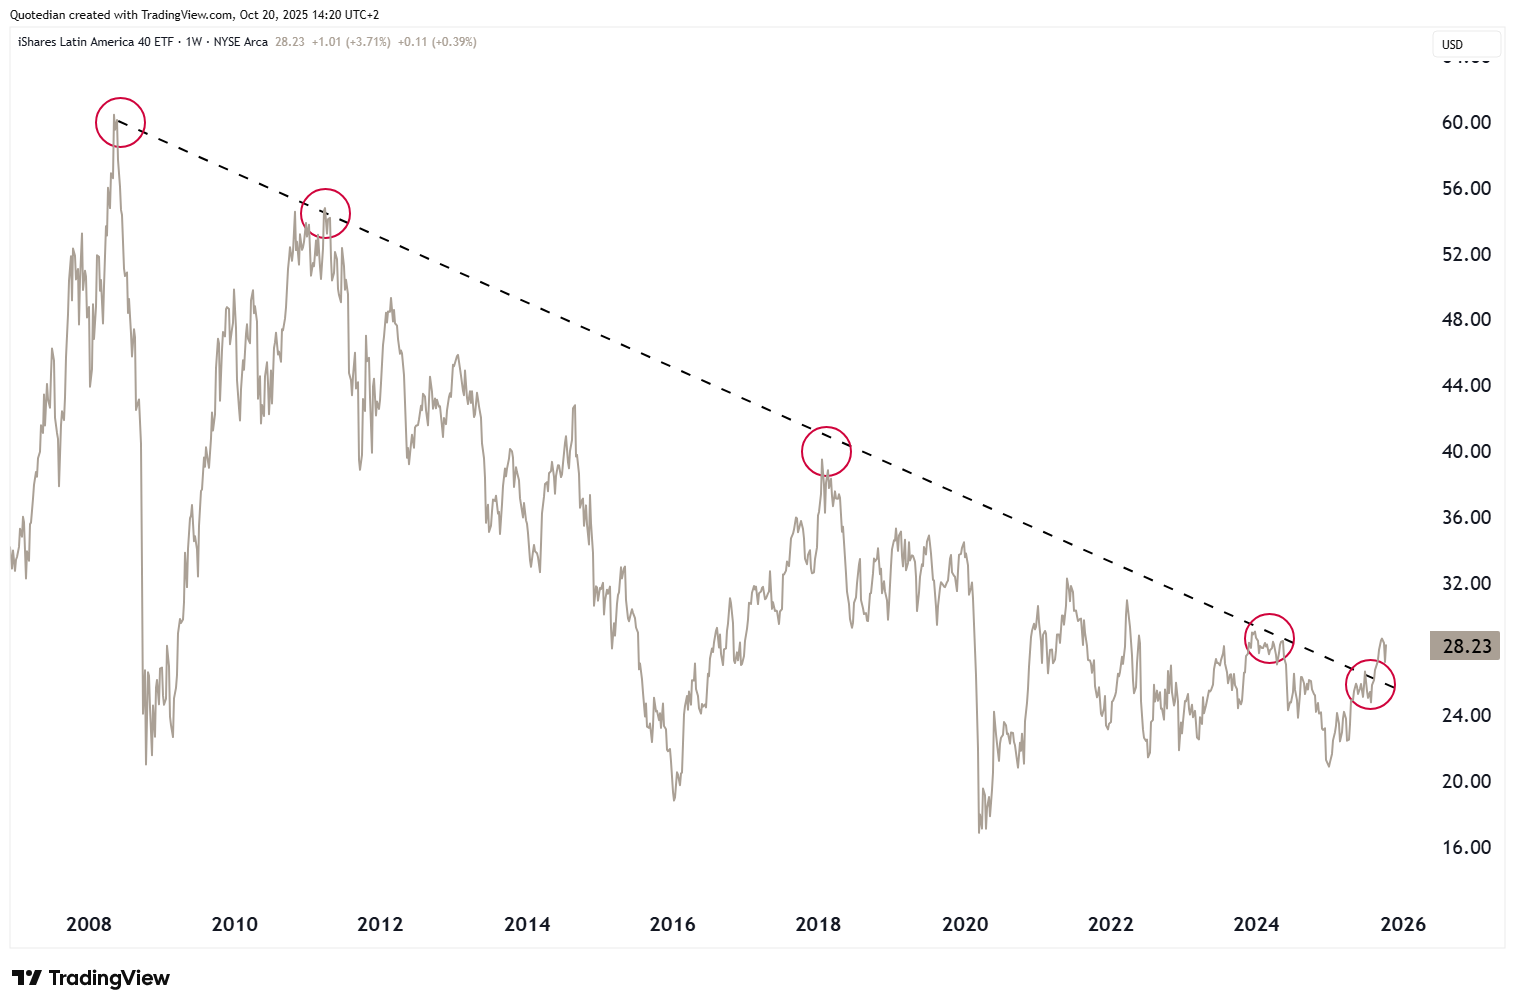
However, in ABSOLUTE terms, an interesting breakout has just taken place on the long-term chart of the iShares Latin America ETF (ILF):

In fixed income/credit/rates markets, people are starting to nervously shuffle their feet below the tables. Remember, we wrote about this in “Pirate Credit” at the beginning of the month (click here)! Here’s an excerpt from a recent FT.com article (highlight mine):
Jamie Dimon’s warning about market “cockroaches” and its implication for the $1.7 trillion private debt market isn’t sitting well with the other side of the street. The JPMorgan CEO’s comments came as investors seem increasingly spooked by the implosion of auto lender Tricolor Holdings and car-parts supplier First Brands Group, and the possibility that they are signs of more pain to come.
“When you see one cockroach, there are probably more,” Dimon said. But according to Blue Owl Capital Co-CEO Marc Lipschultz, it’s the banks that might want to look behind the refrigerator. Tying private credit to the fallout from those bankruptcies is an “odd kind of fear-mongering,” he said.
The clash comes at a time when “there’s land mines starting to go off everywhere,” said Akshay Shah, who runs distressed-debt firm Kyma Capital. “Marc is saying it’s in the banking corner, and Jamie might say it’s elsewhere. I would say it’s going off in both corners.”
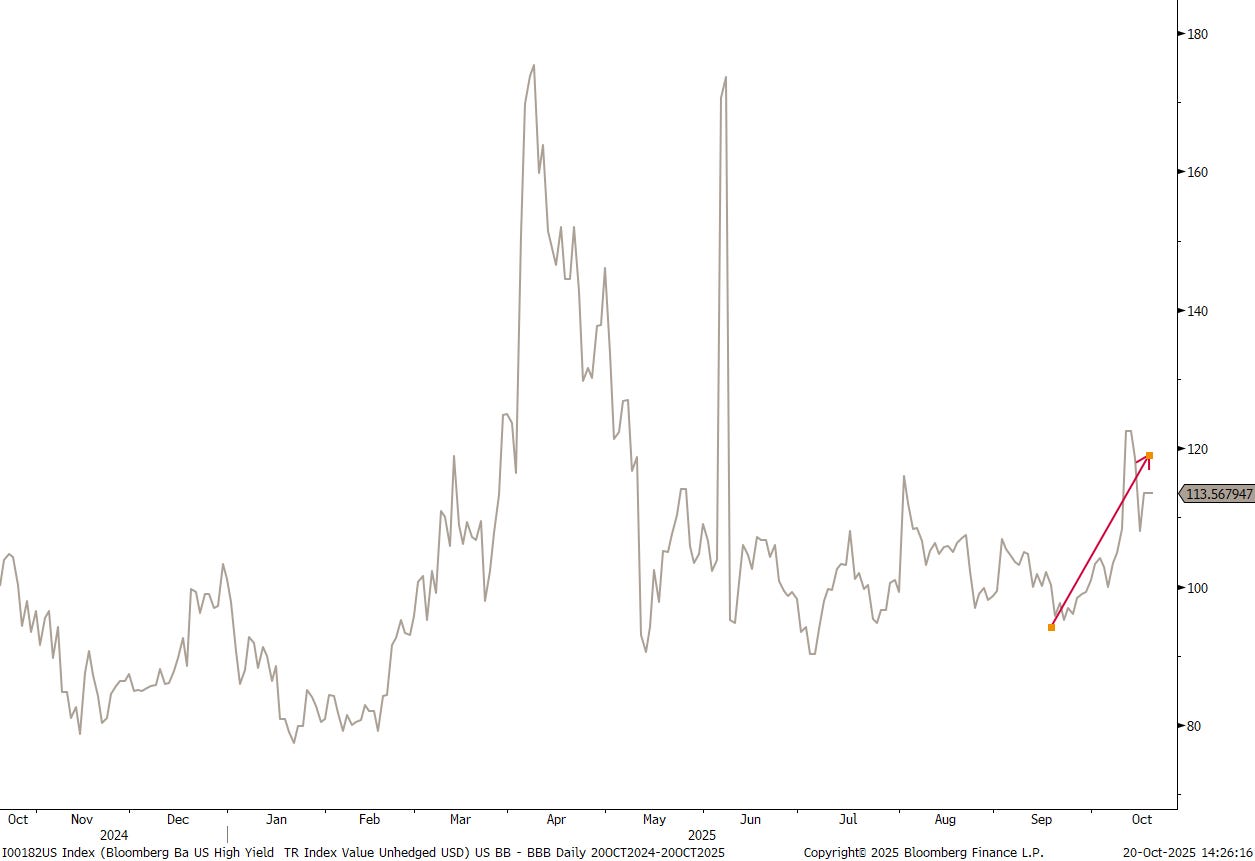
Clearly, credit spreads have been picking up lately, looking our call to underweight the lower credit quality (read: junk) segment very timely. Here’s the BB - BBB spread chart:
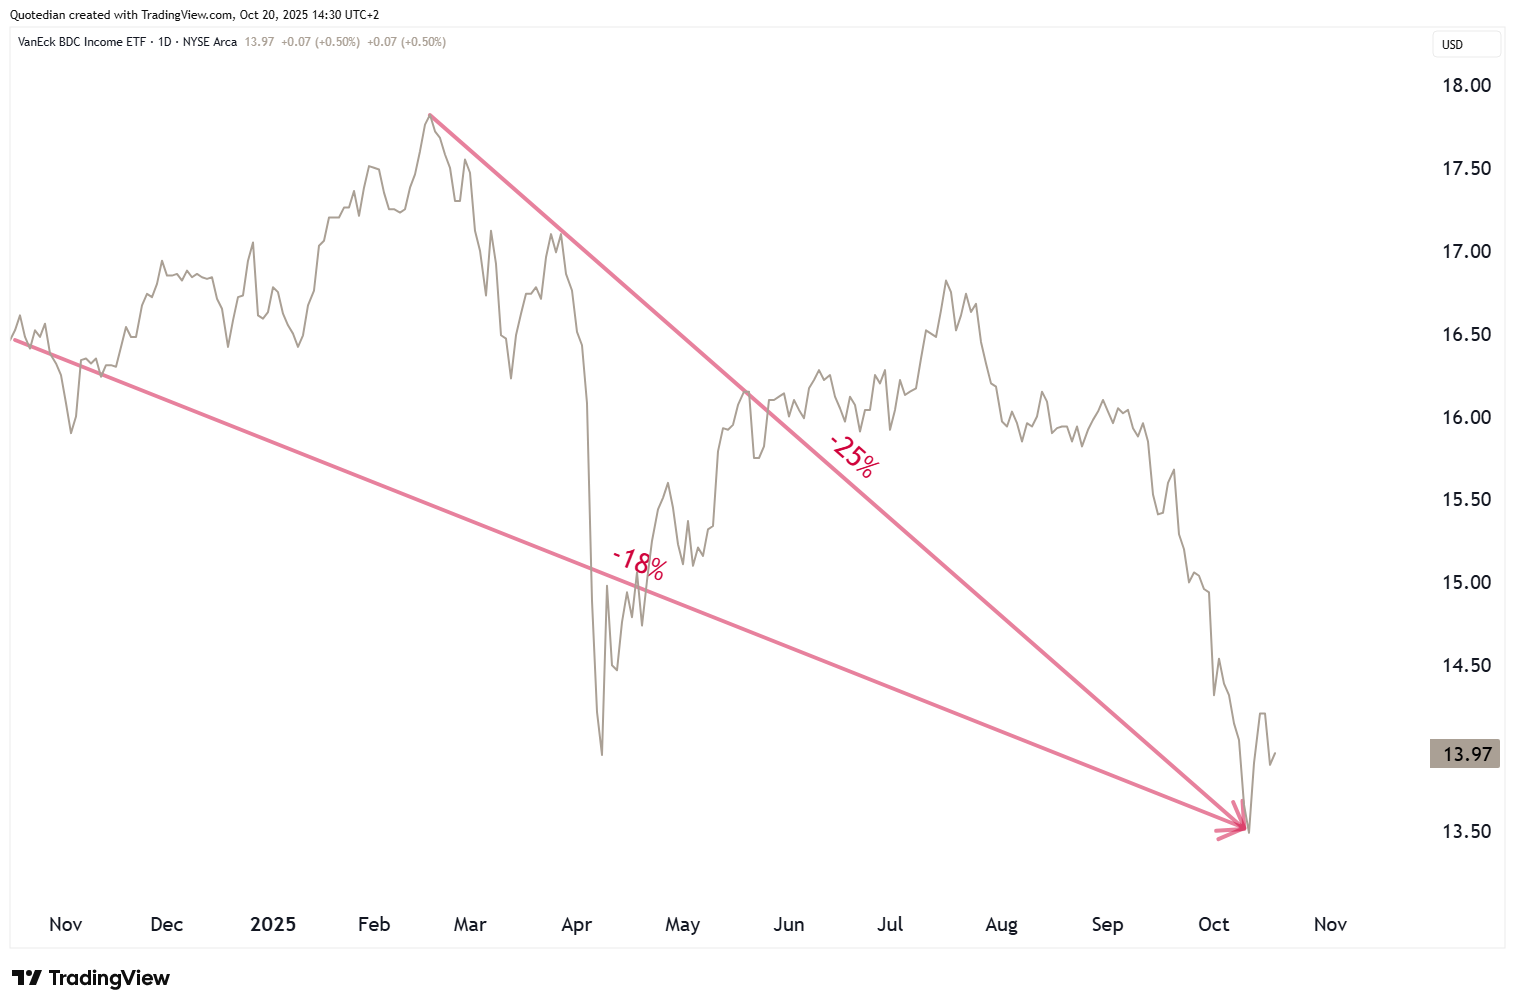
Our favourite proxy for this wonkier corner of the private credit market, the VanEck BDC Income ETF (BIZD) is down 18% year-to-date and down 25% since the February highs:
Some of the ETFs components have mediocre YTD returns:
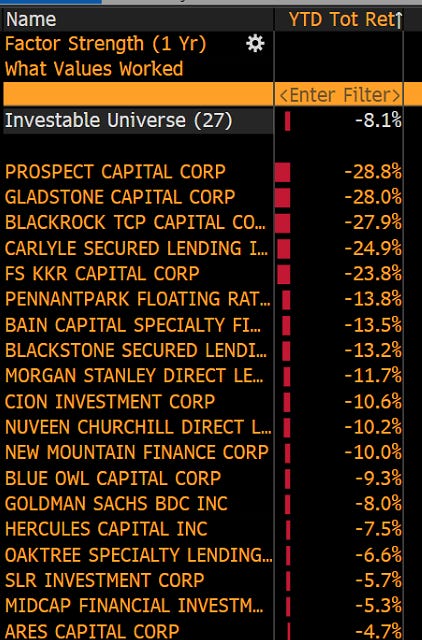
And yes, many of those “special lending vehicles” will carry part of names you very well recognise ….
So far contagion to the rest of the credit market is contained … so far …
In rates markets, the US 10-year Treasury has dropped below 4% where I would expect it to stay for the next few weeks:
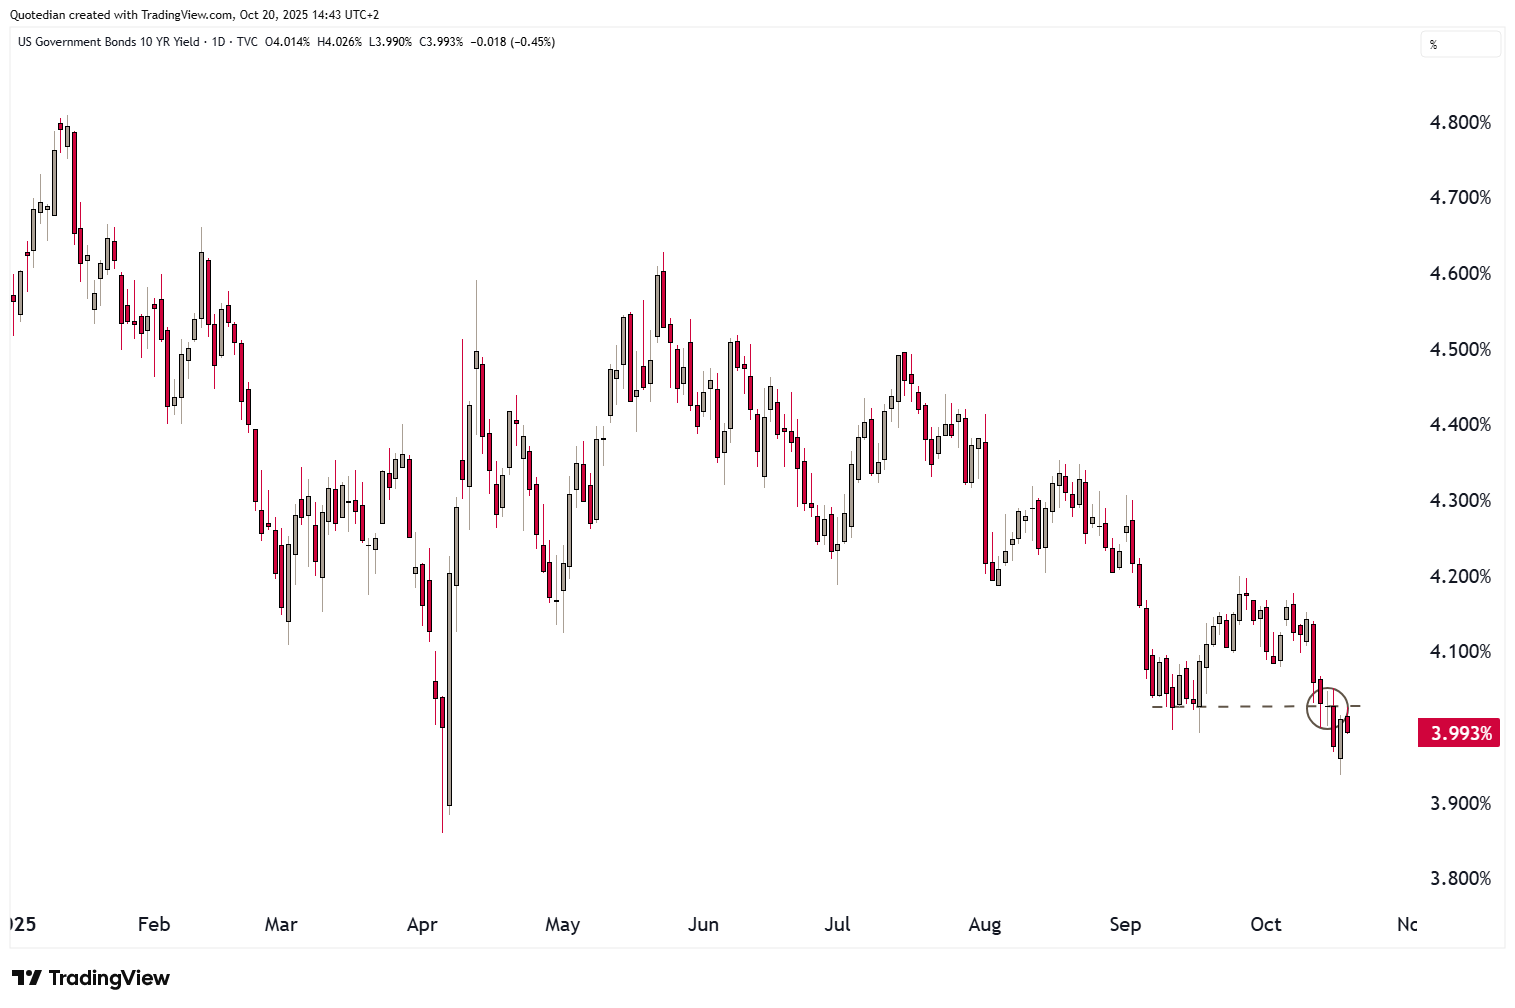
The wildcard for this yields below 4% call is of course economic data. Should the government suddenly re-open and produce some weird economic data (CPI, non-farm payroll, PPI, etc.) there could be one or the other curve ball in there.
Regarding central bank policy, the market (via futures) continues to expect the FOMC to cut another two times (October & December) this year and a total of five cuts by the end of next year:
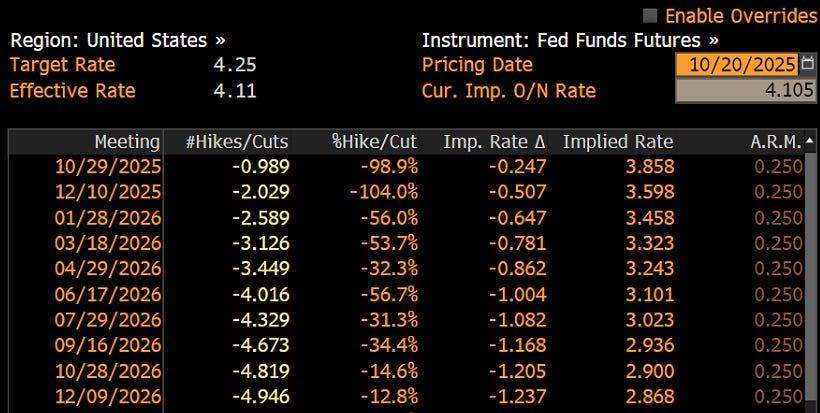
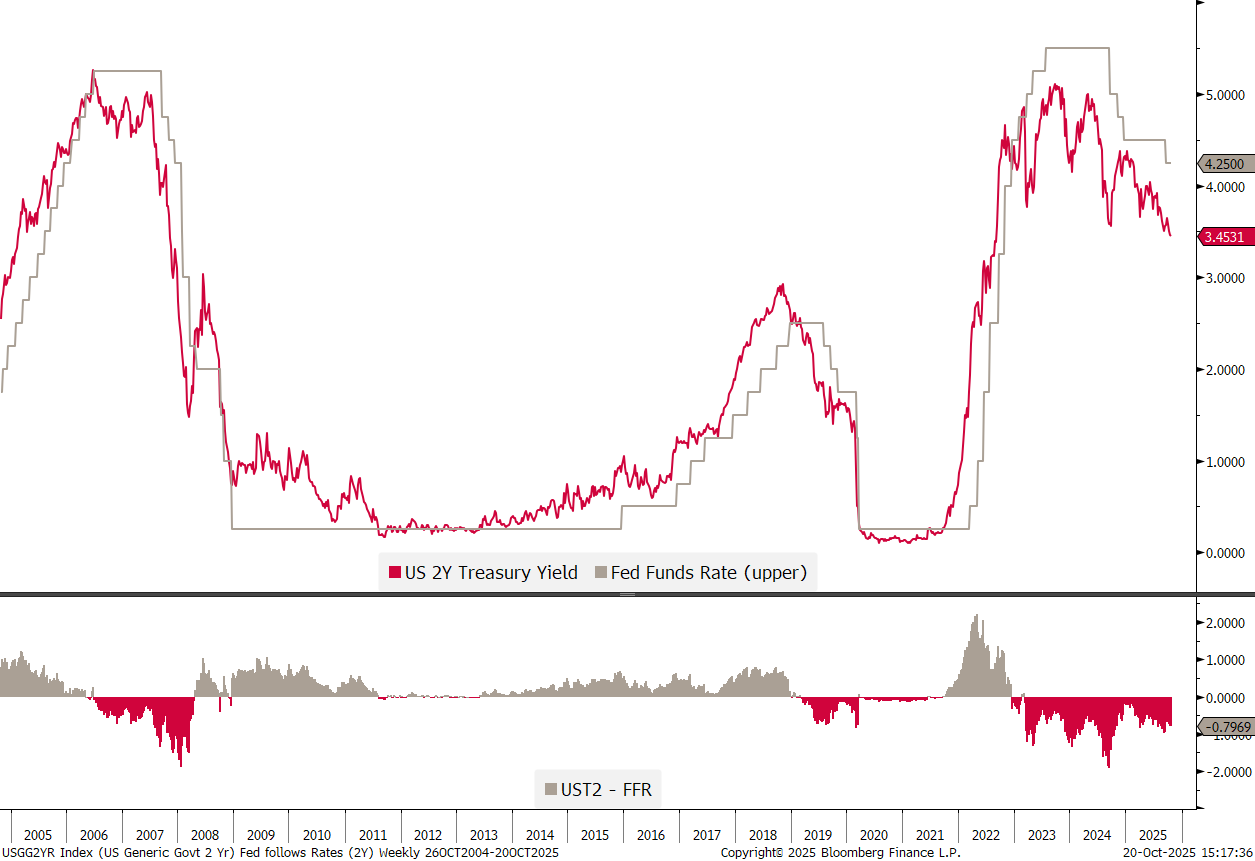
This would imply a terminal rate of below 3%, which is lower than today’s 2-year treasury yield which trades roughly at 3.5%:
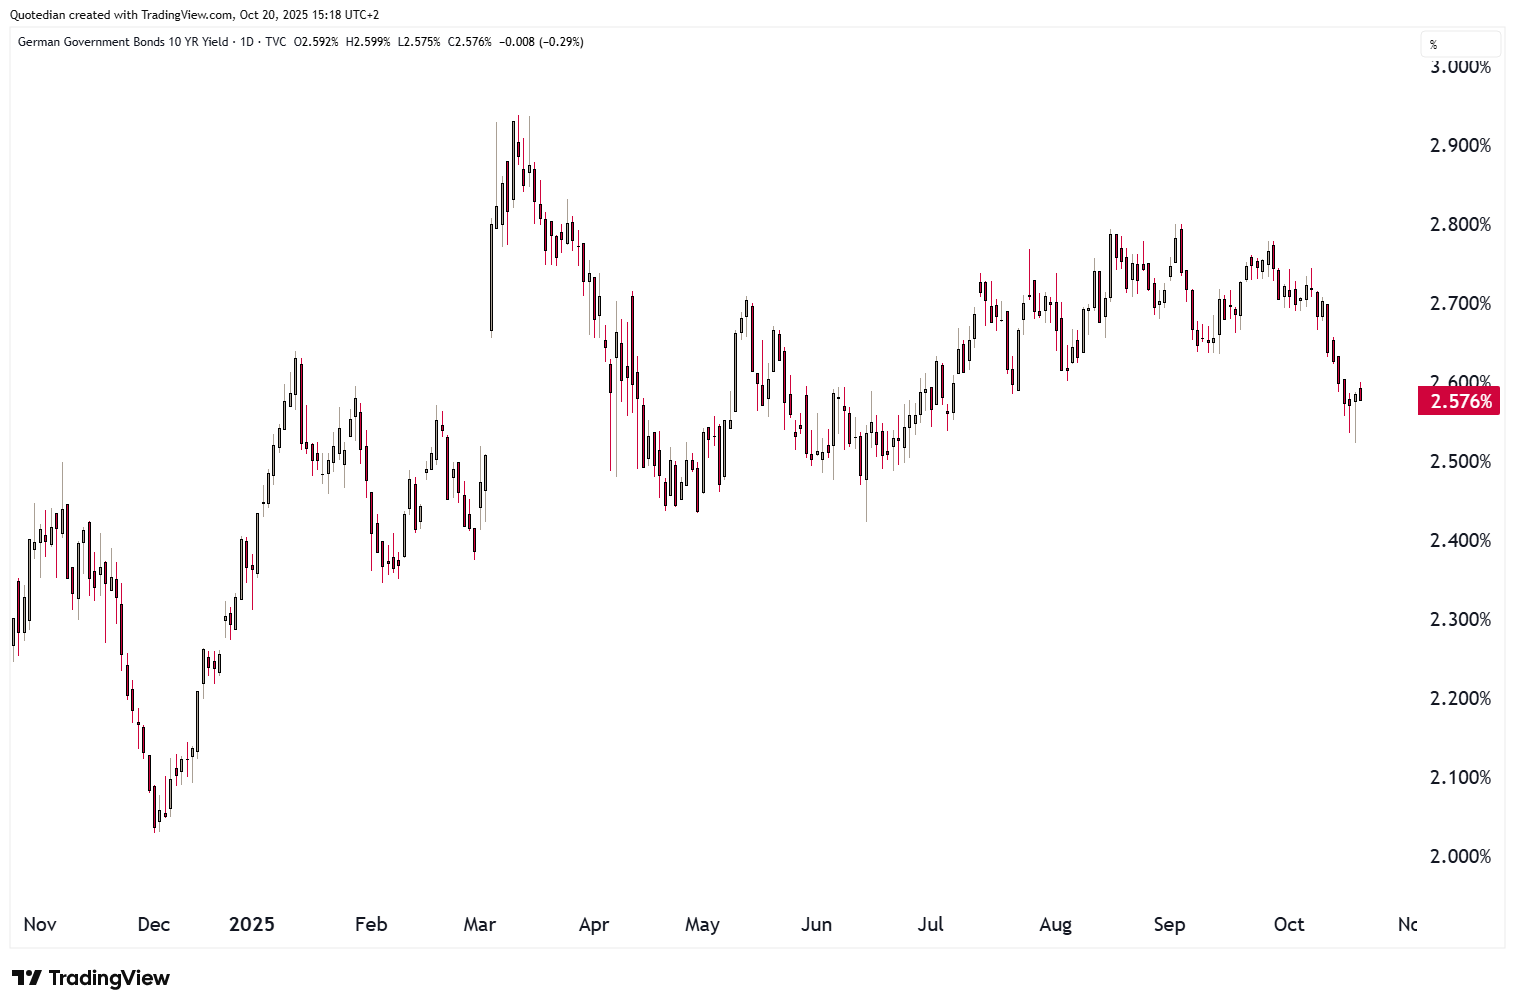
European yields, proxied via the German Bund, continue to trade around 2.5% with little immediate change on the horizon:
Finally, and only on a have serious note, the French-to-German 10-year yield spread trade sharply wider today:
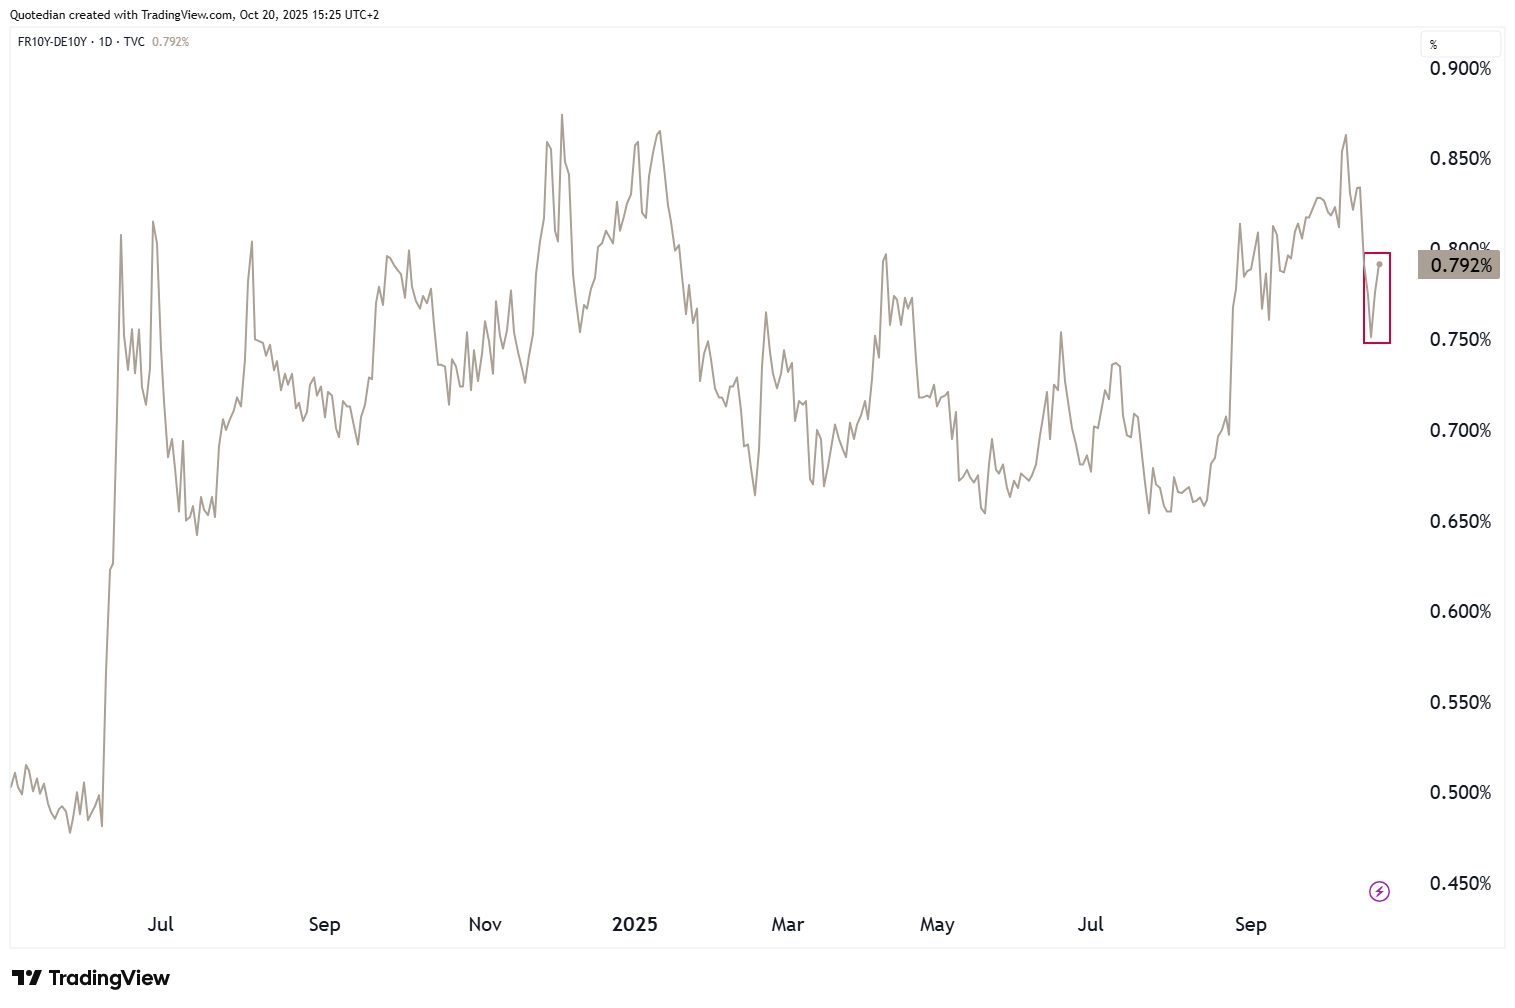
No wonder with French finances now even worse, post the Louvre museum robbery of this weekend!


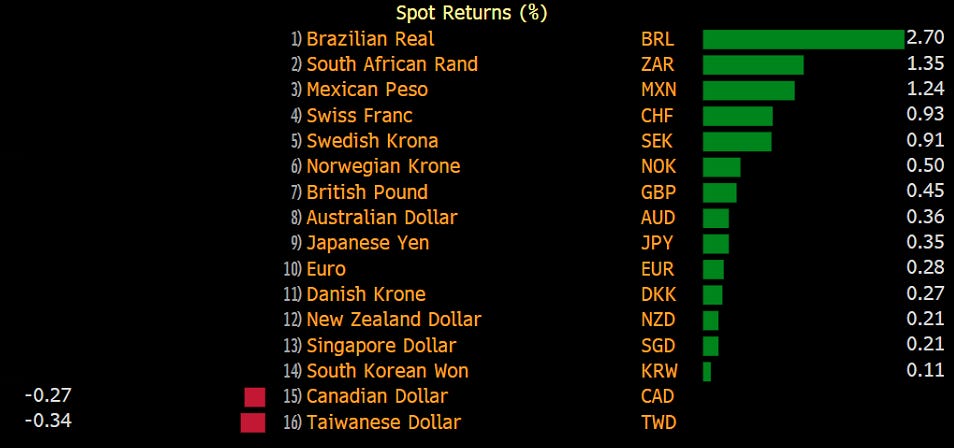
In FIAT currency markets, the US Dollar has been soft versus all other major currencies over the past week:
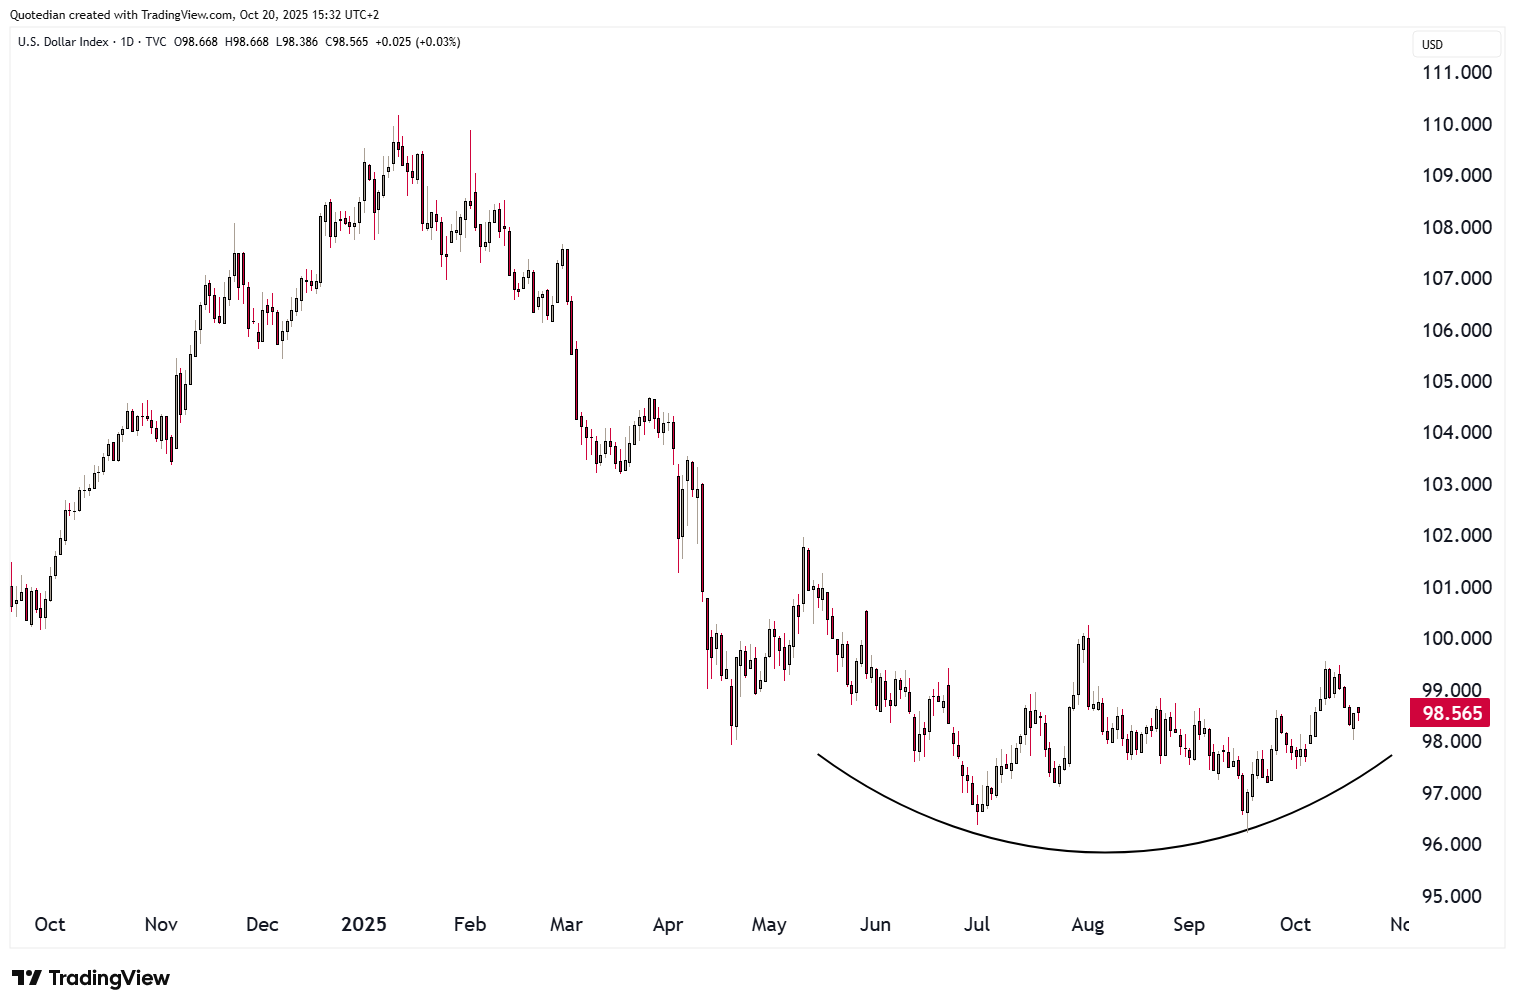
The US Dollar Index (DXY) can currently be interpreted both ways. Here’s the Bull version:
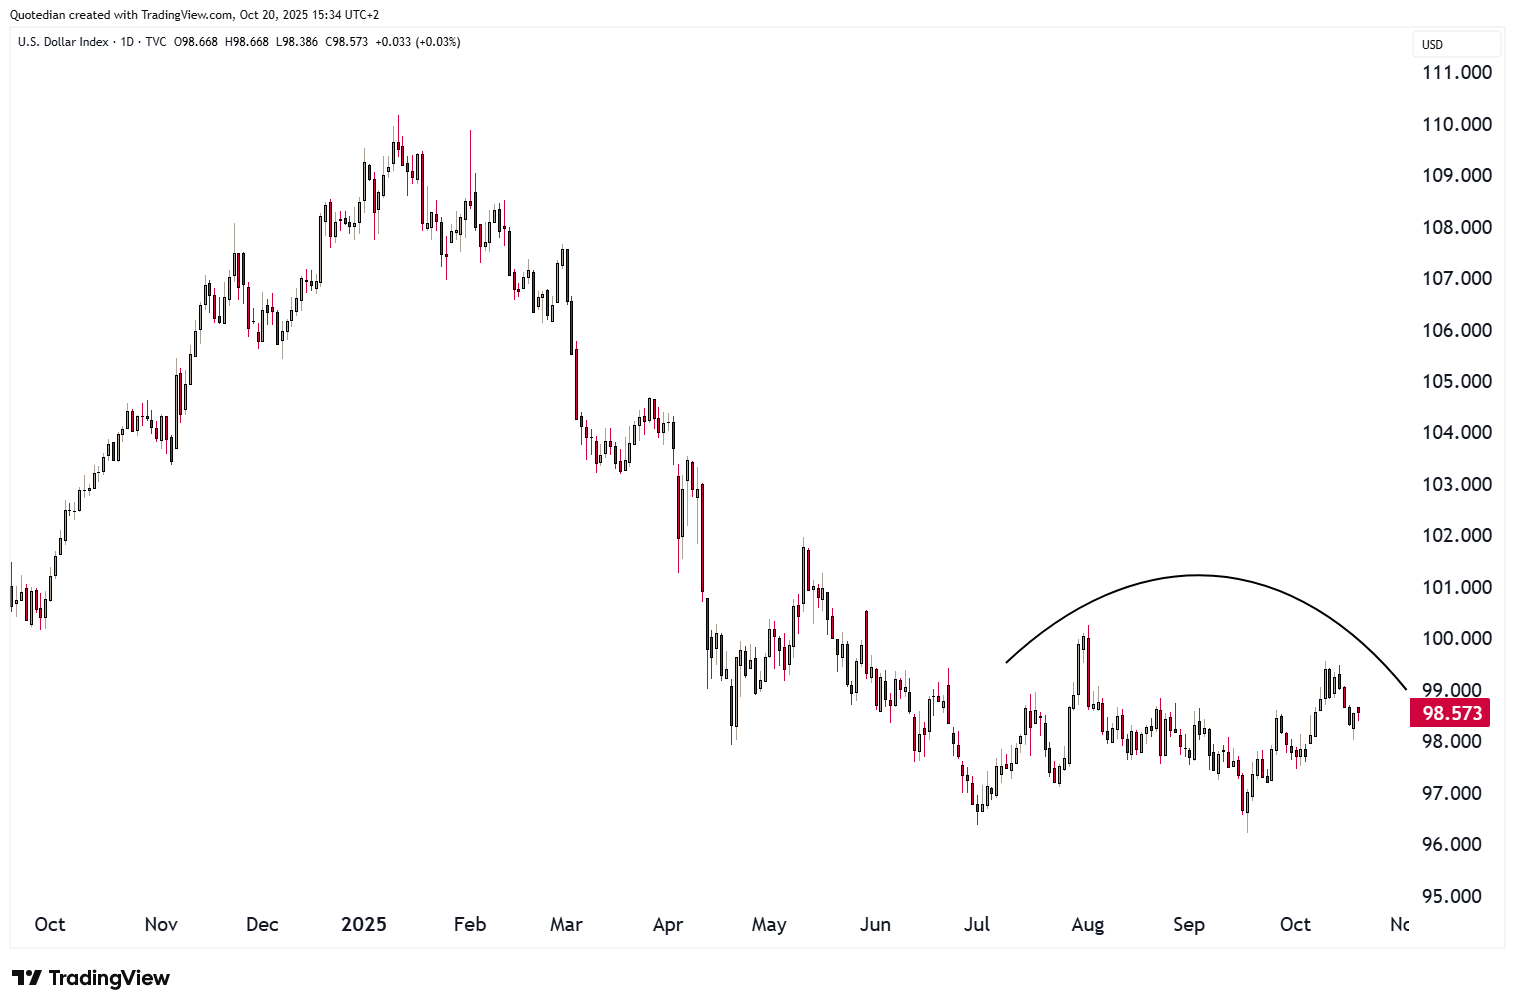
And here the chart for the Dollar bears:
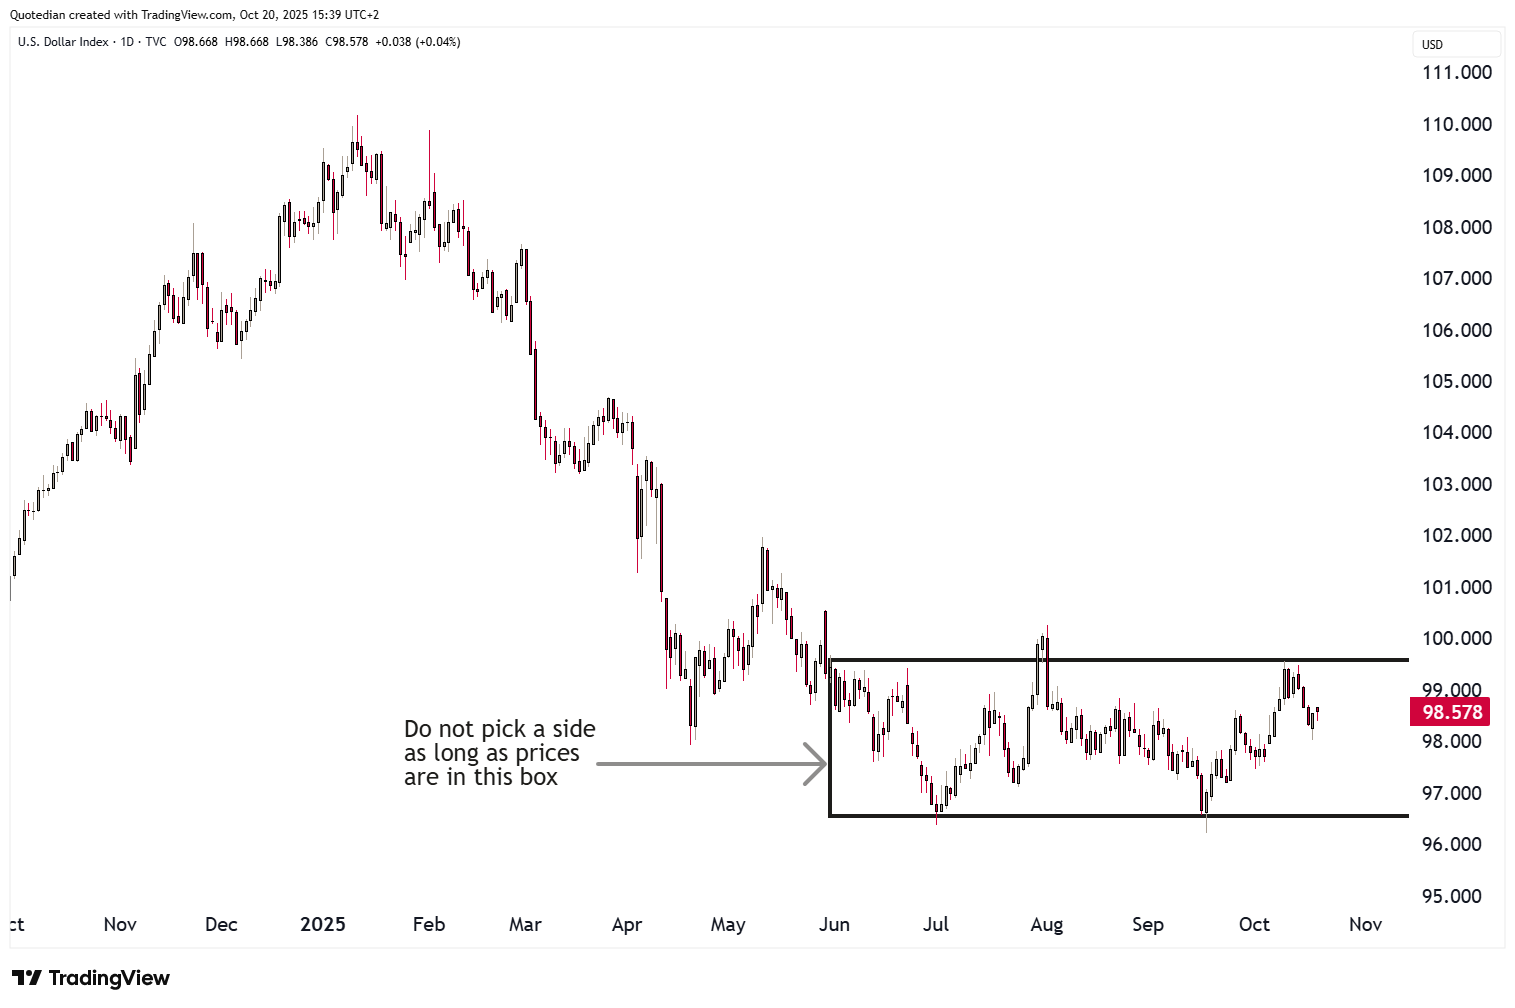
And here’s the DXY-chart for the unbiased, smart investor:
If you are looking for a possible trading opportunity, look at this USD/JPY chart
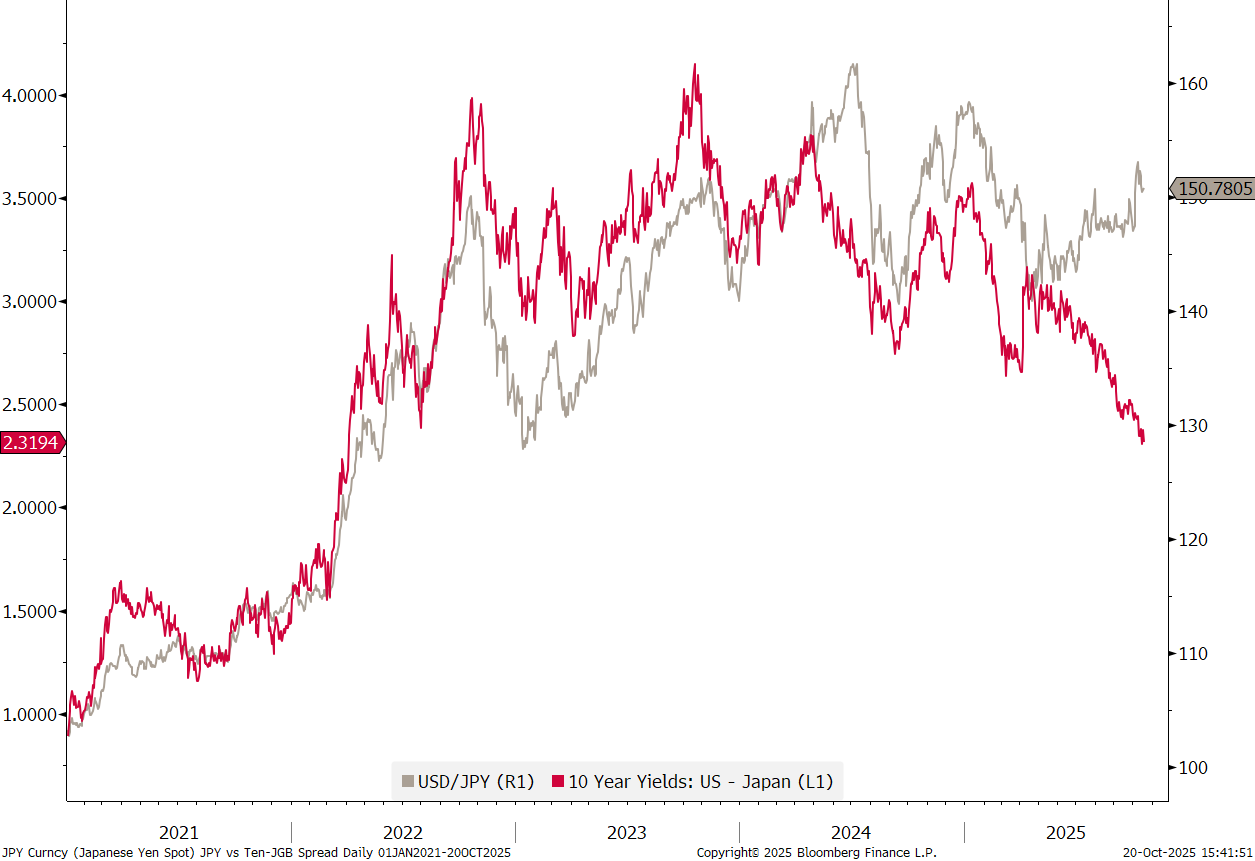
The red line is the interest rate differential between US Treasury and JGB yields and the grey line is US Dollar/Japanese Yen cross-rate:

The JPY has been stubbornly weak in comparison to other G10 currencies, but I think the crocodile’s mouth above will eventually close (by USD/JPY going lower).
Moving into the CRYPTO currency realm, and as a segue into the REAL currency world (aka Gold), consider the following chart:
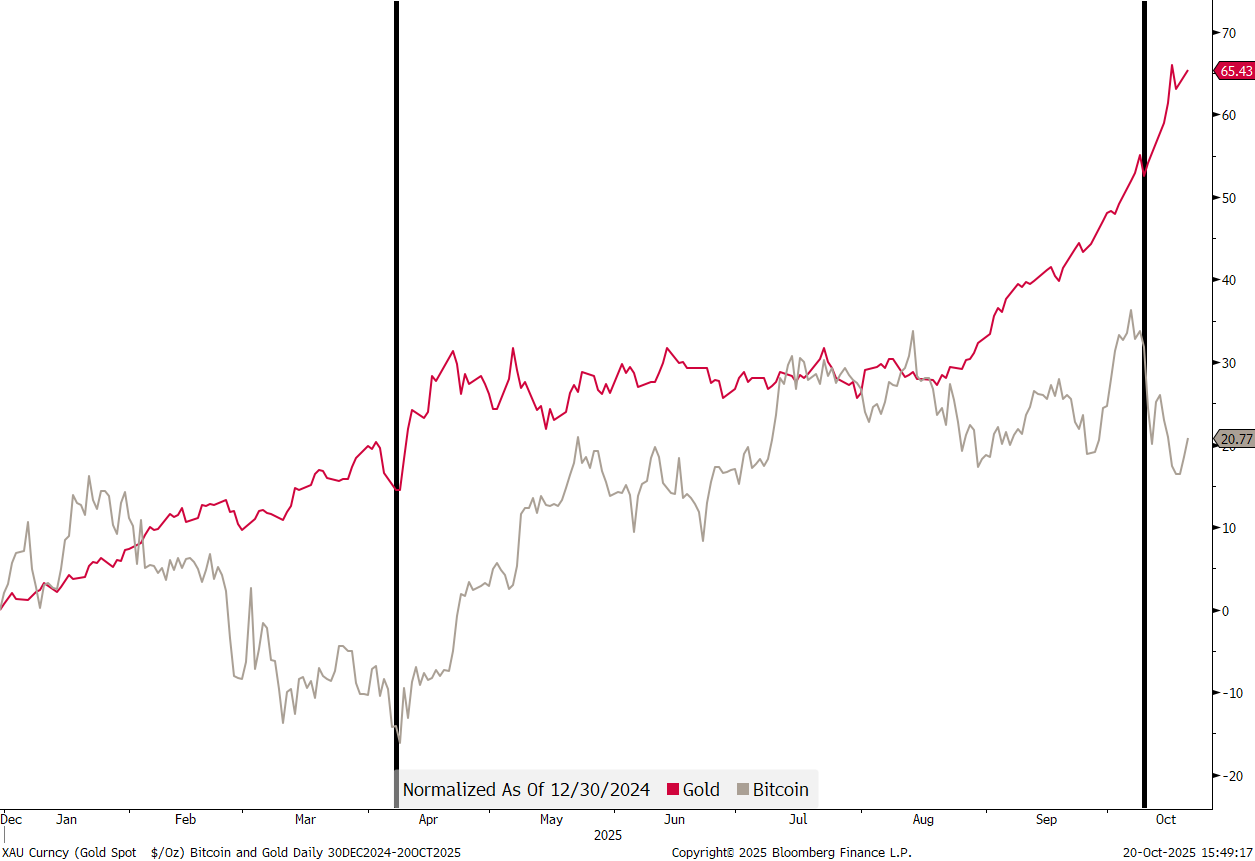
During this year’s two biggest flare-ups (black, vertical lines) over rare earths, in April and again in the last few days, gold has held steady or even rallied, while Bitcoin has tumbled.
As a matter of fact, if Bitcoin would end its year today, it would the fourth weakest year in terms of return since ‘inception’:
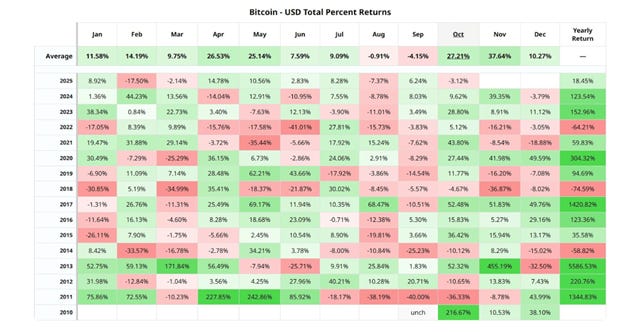
And this in the first year that this cryptocurrency has found kind of broad acceptance amongst money managers …

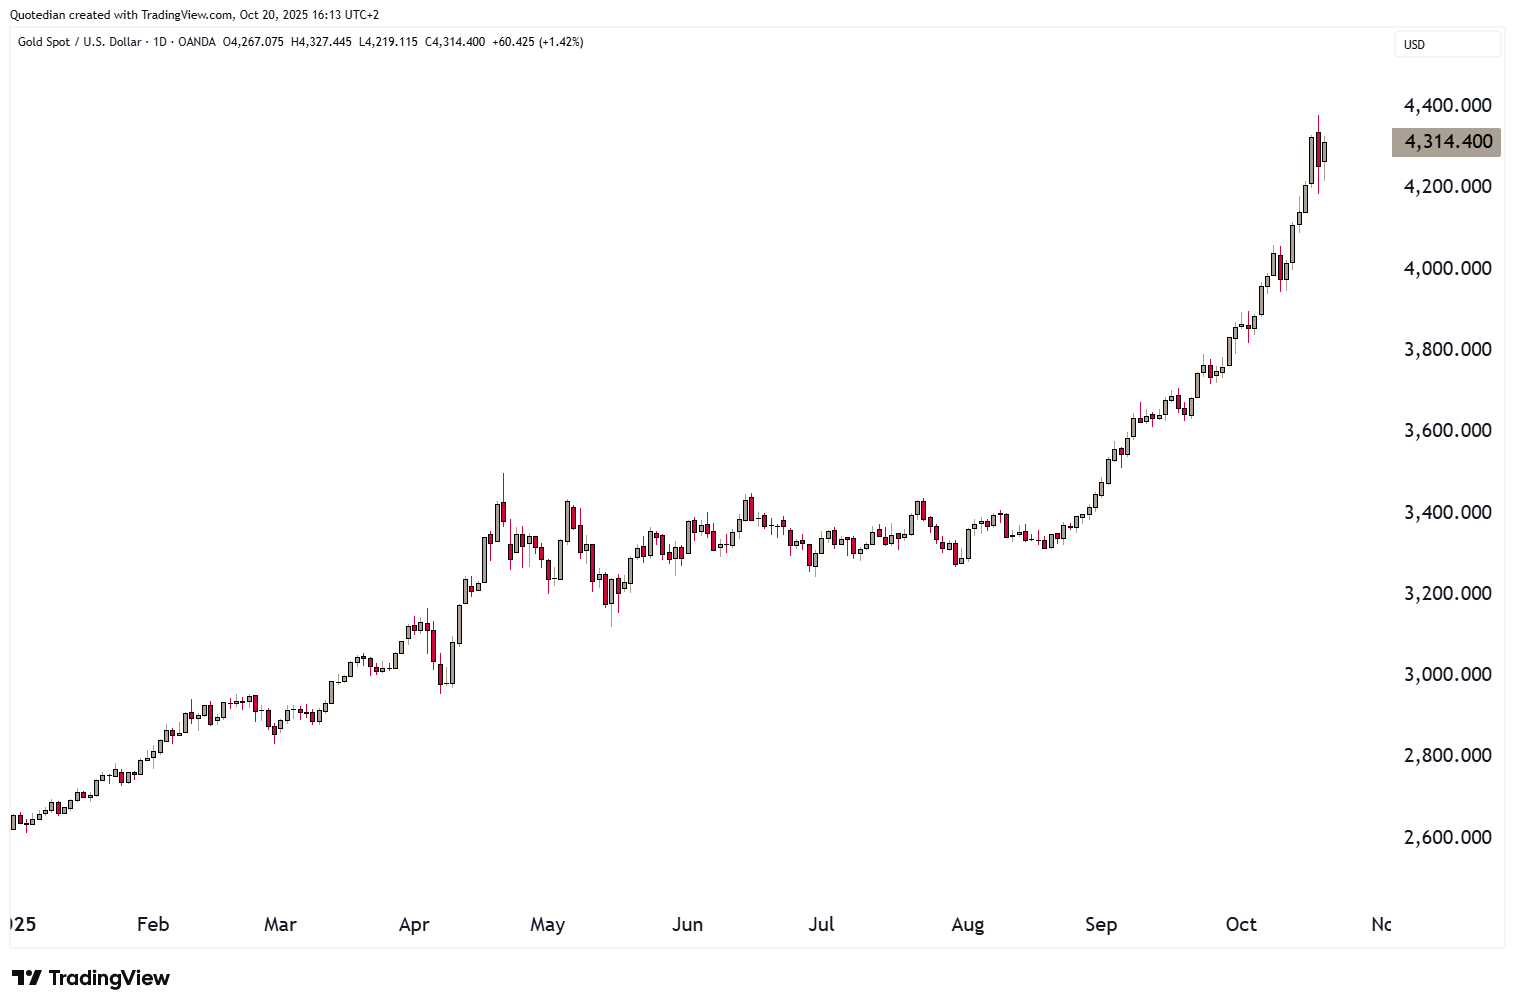
Gold is struggling to have a bad day:
The yellow metal is on track for its 10th consecutive up week:
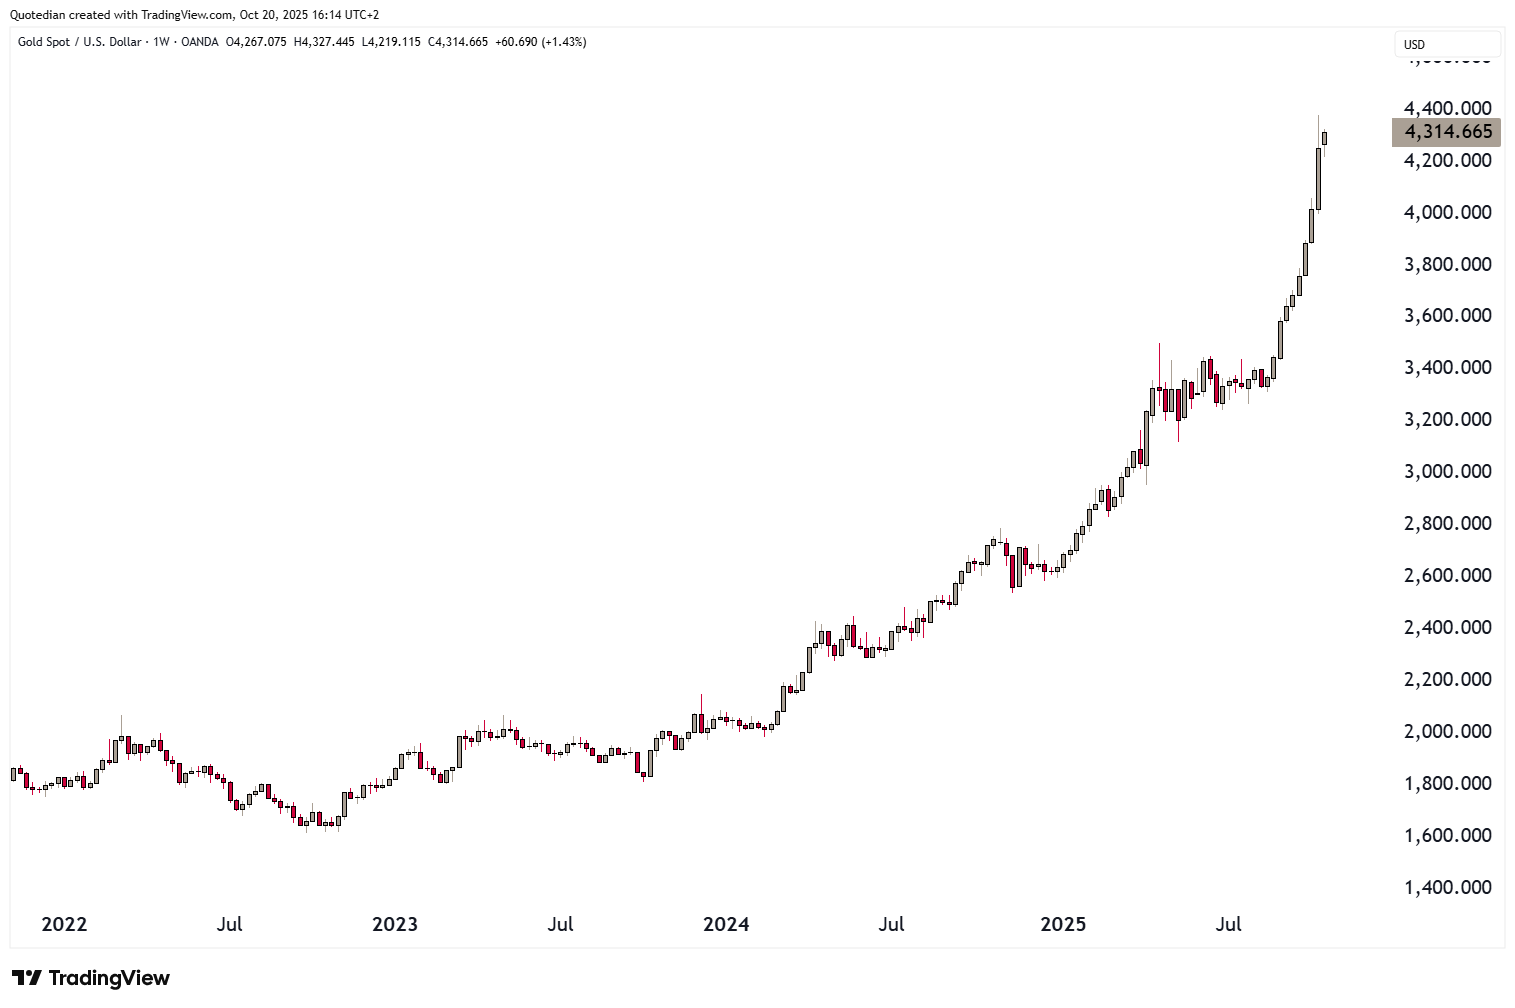
The long-term monthly chart is eye-watering:
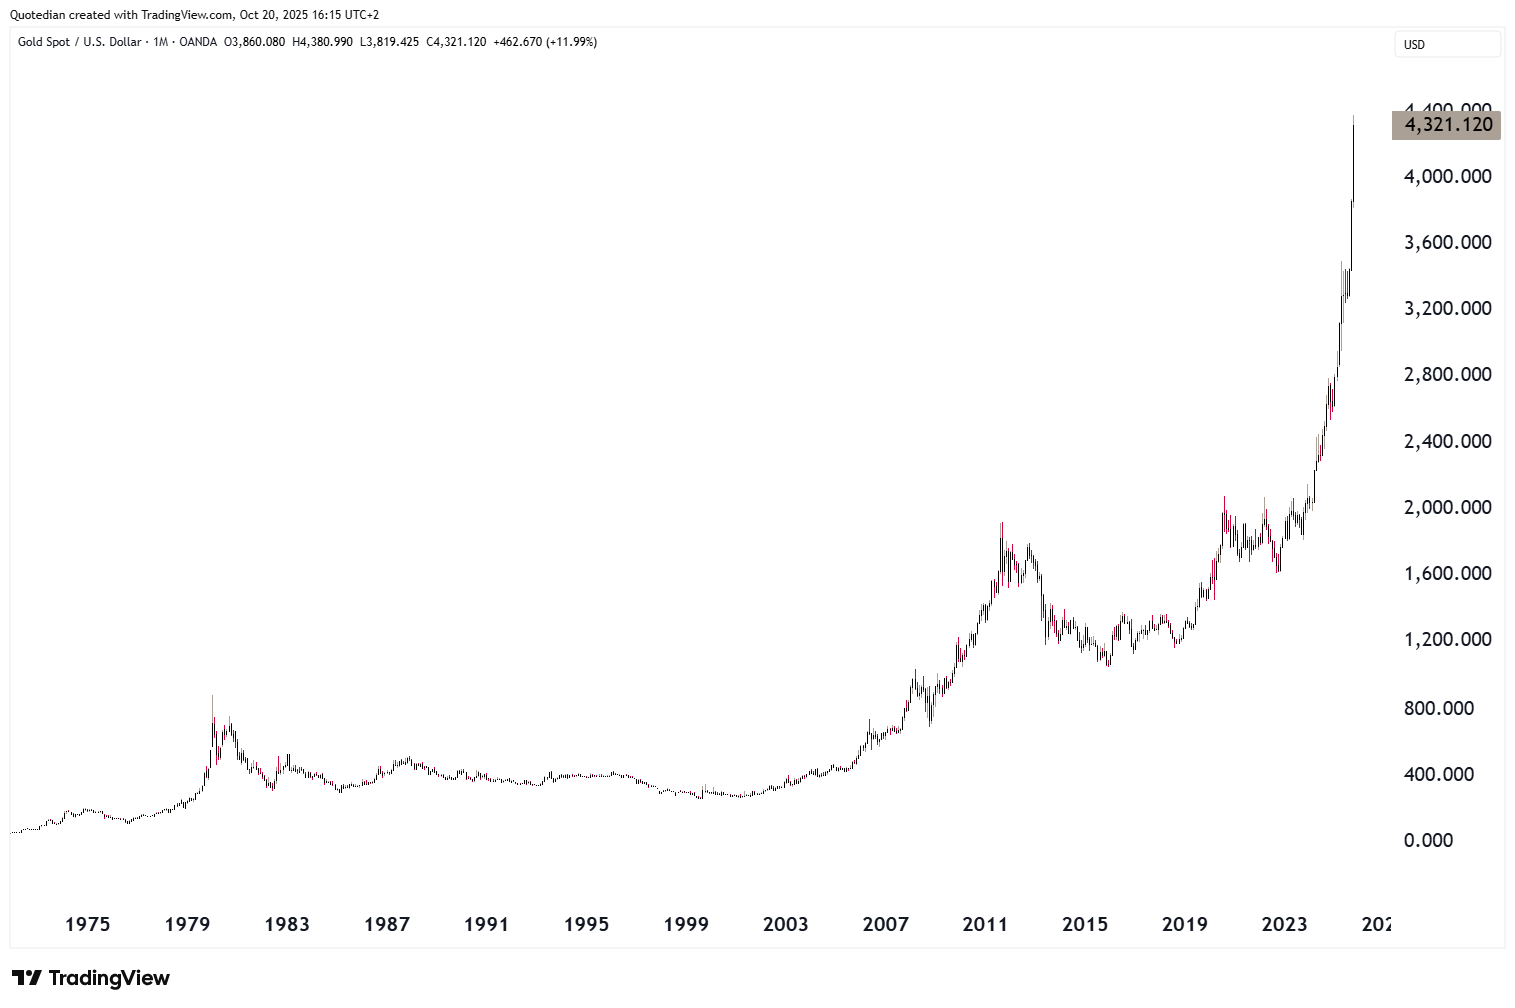
This year Gold broke the 3,000 AND the 4,000 barrier:
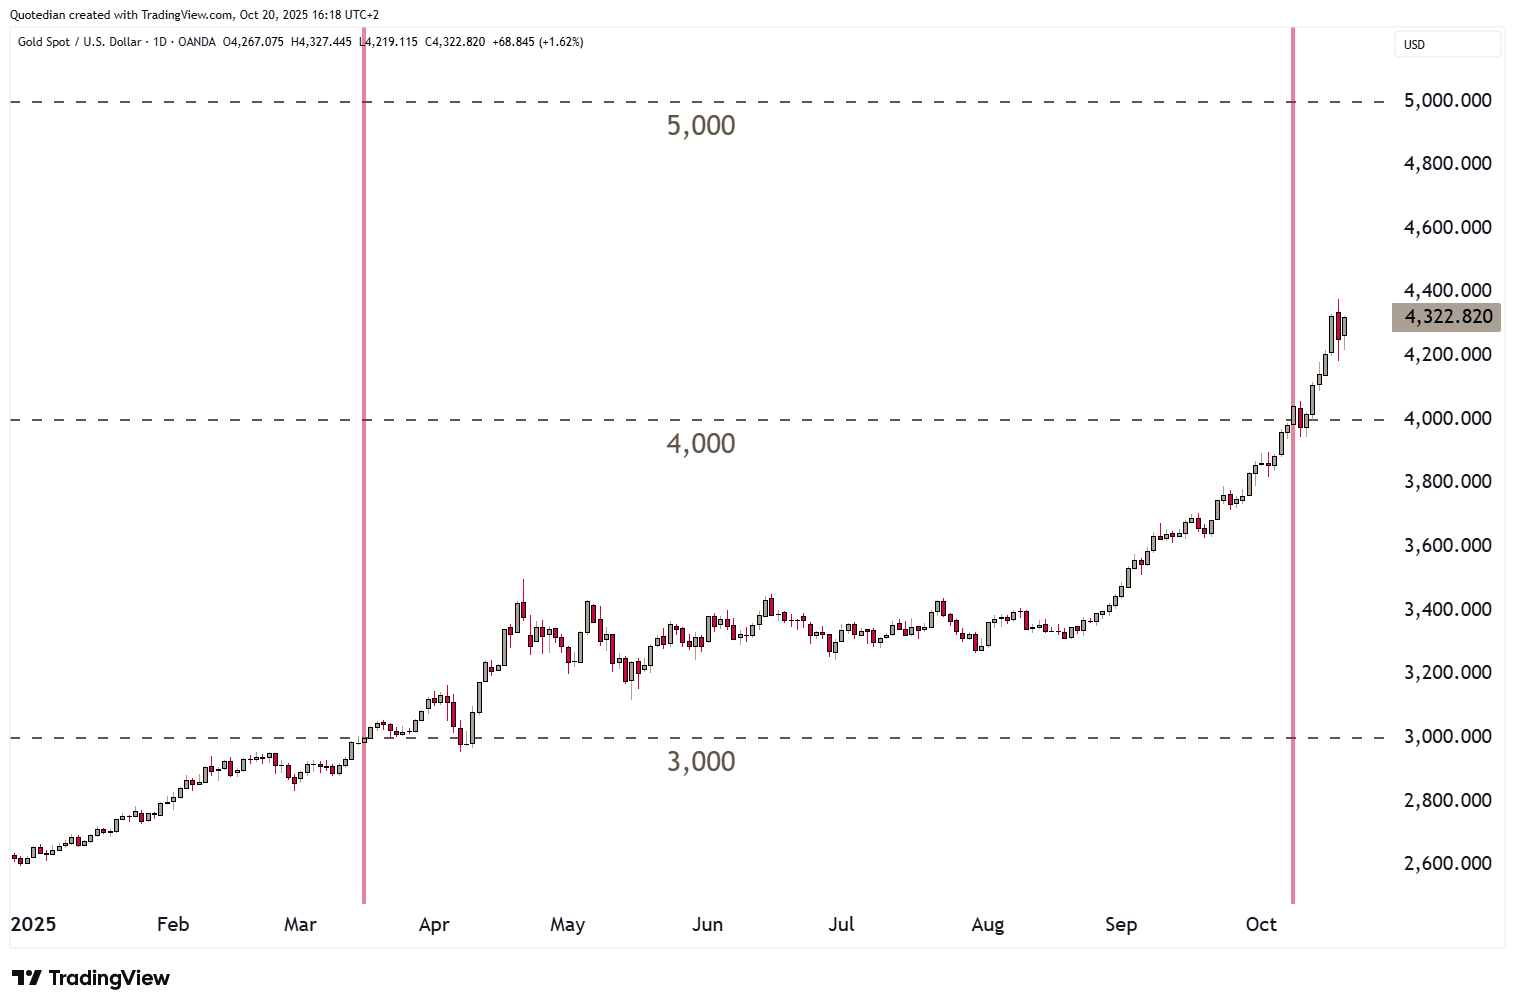
Could it possibly also try to squeeze in the 5,000 level??!!!
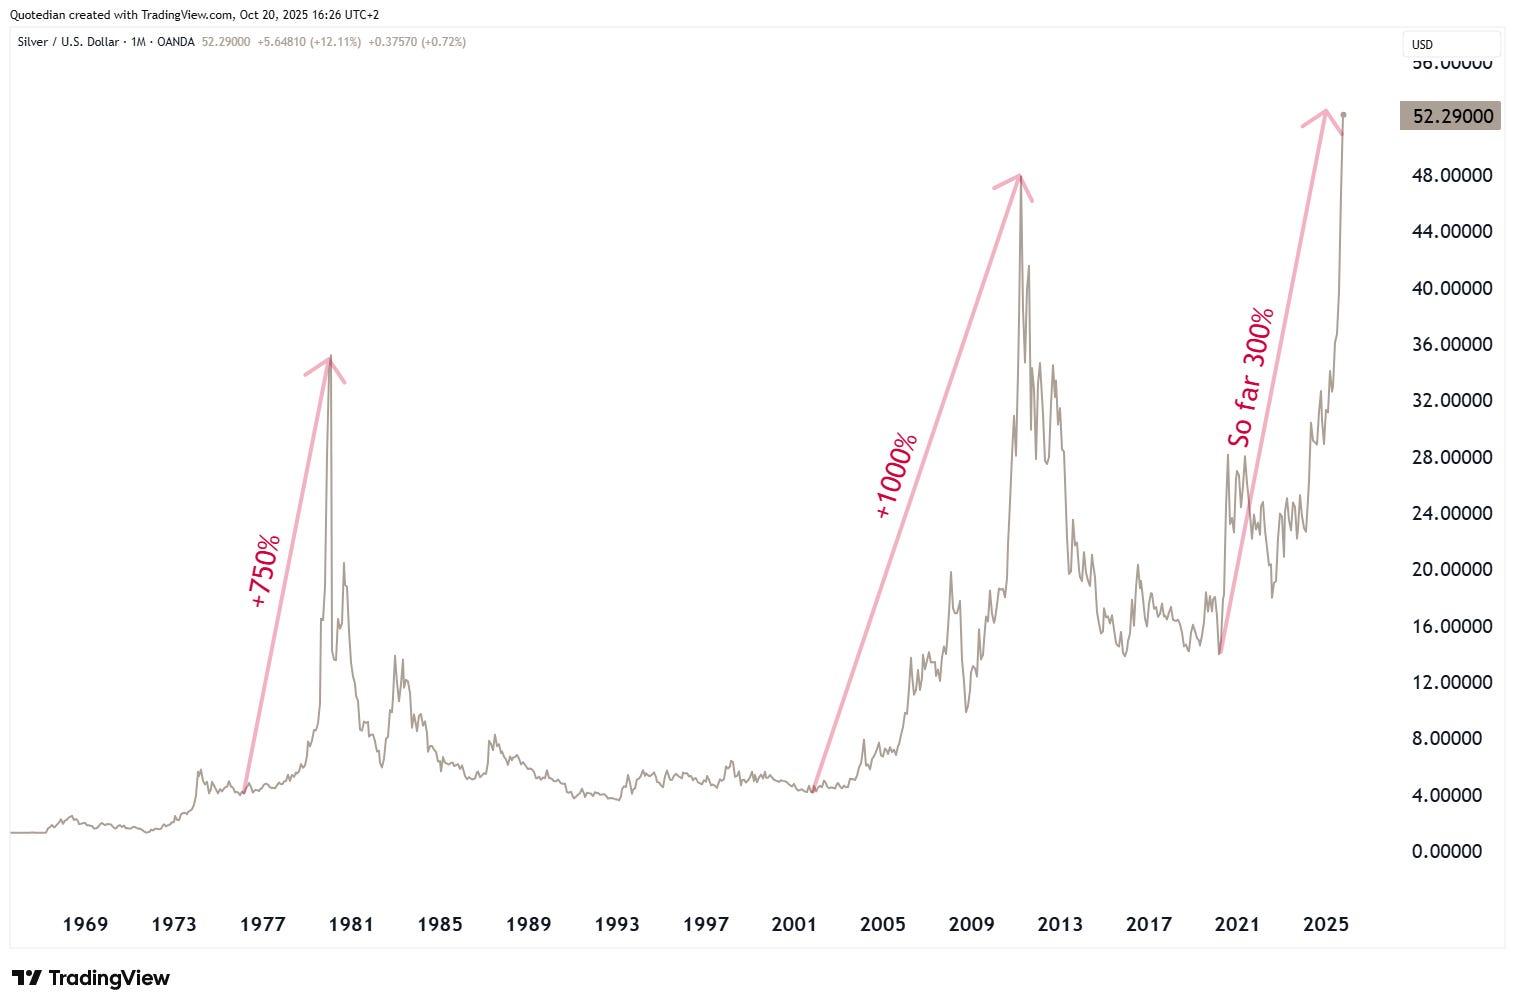
Silver is similarly hopelessly overbought as is Gold. However, Silver has this tendency of complete blow-off tops and if the past two (1980 and 2011) are any indication, this metal could still see some steeeeeeeep upside:
On a final note, and to come back full circle to raw rare earths, there’s actually an ETF, the VanEck Rare Earth and Strategic Metals ETF (REMX - grey line below), that covers where the puck is going now. However, we have an even better, and especially less volatile fund solution, which is the red line:
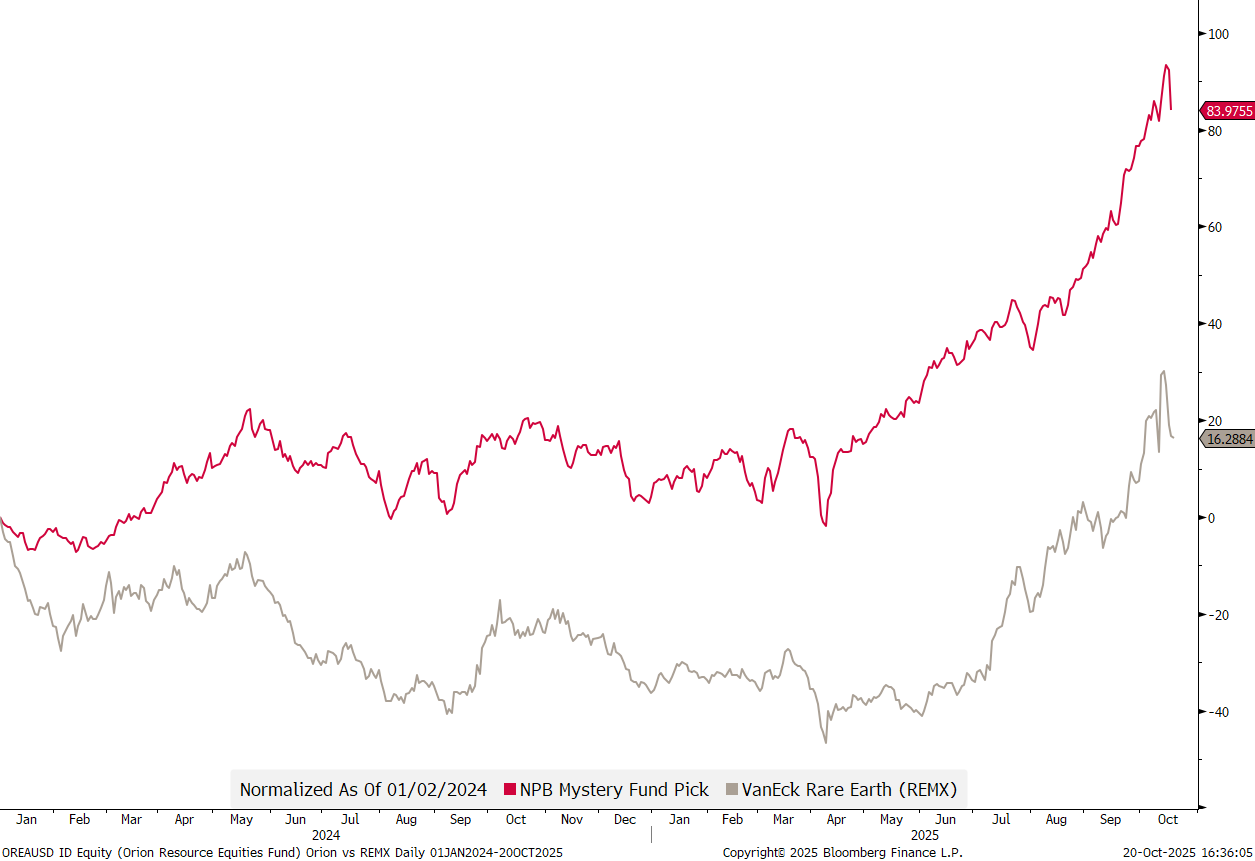
Become a client to find out which the NPB Mystery Fund pick is 😉.
Unfortunately I will have to cut short here - but worry not you shall. Sign up to the QuiCQ (click here) and follow me on LinkedIn (click here) for more exciting charts throughout the week.
Have a great week,
André

In reality, you need no other Disclaimer than the one above, but just in case:
Everything in this document is for educational purposes only (FEPO)
Nothing in this document should be considered investment advice
Investing real money can be costly; don’t do stupid shit
Leave politics at the door—markets don’t care.
Past performance is hopefully no indication of future performance
The views expressed in this document may differ from the views published by Neue Private Bank AG