


“Price is what you pay. Value is what you get.”
— Warren Buffett

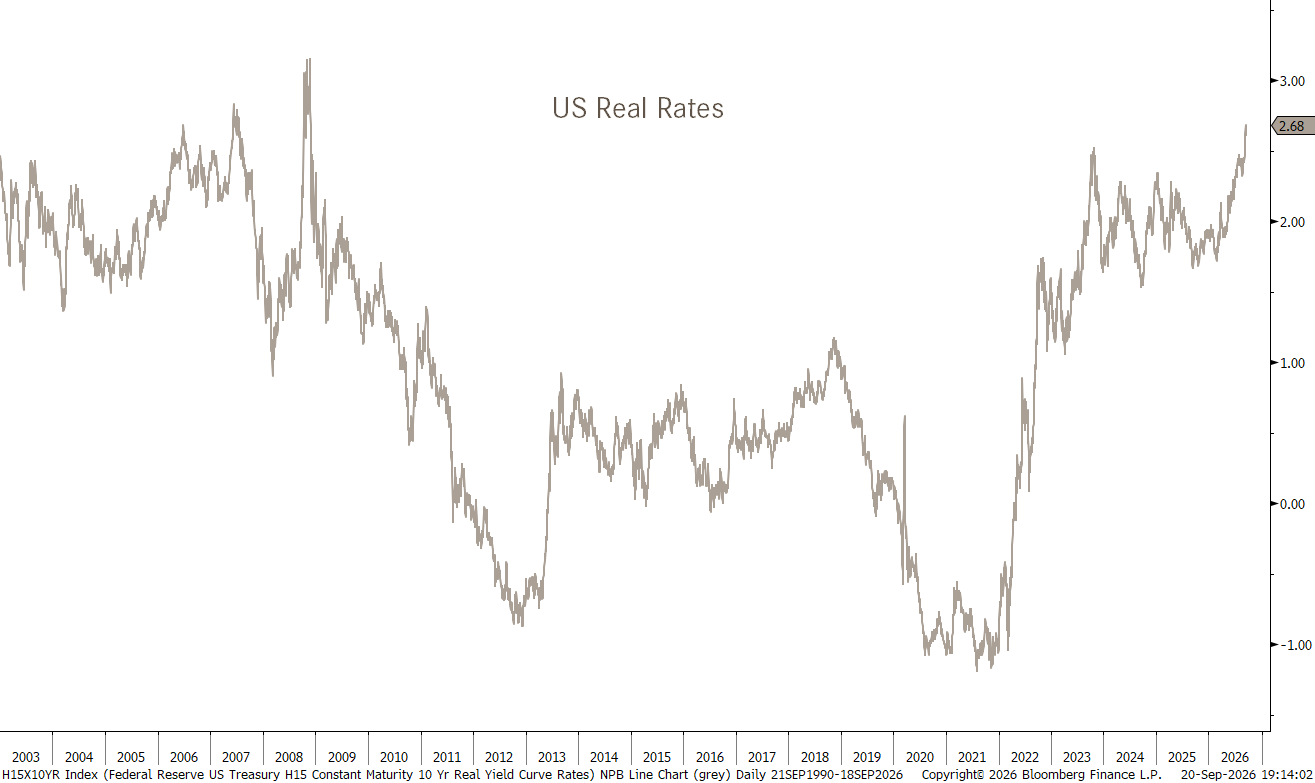
Real rates (nominal minus inflation) are at their highest since the GFC
TIPS offer an interesting “guaranteed” real return of 2.7% now
Equity charts start looking more compelling again and could be setting up for a rally to new cycle highs
The JPY rally may be in for an extended pause
Keep/increase your crypto exposure
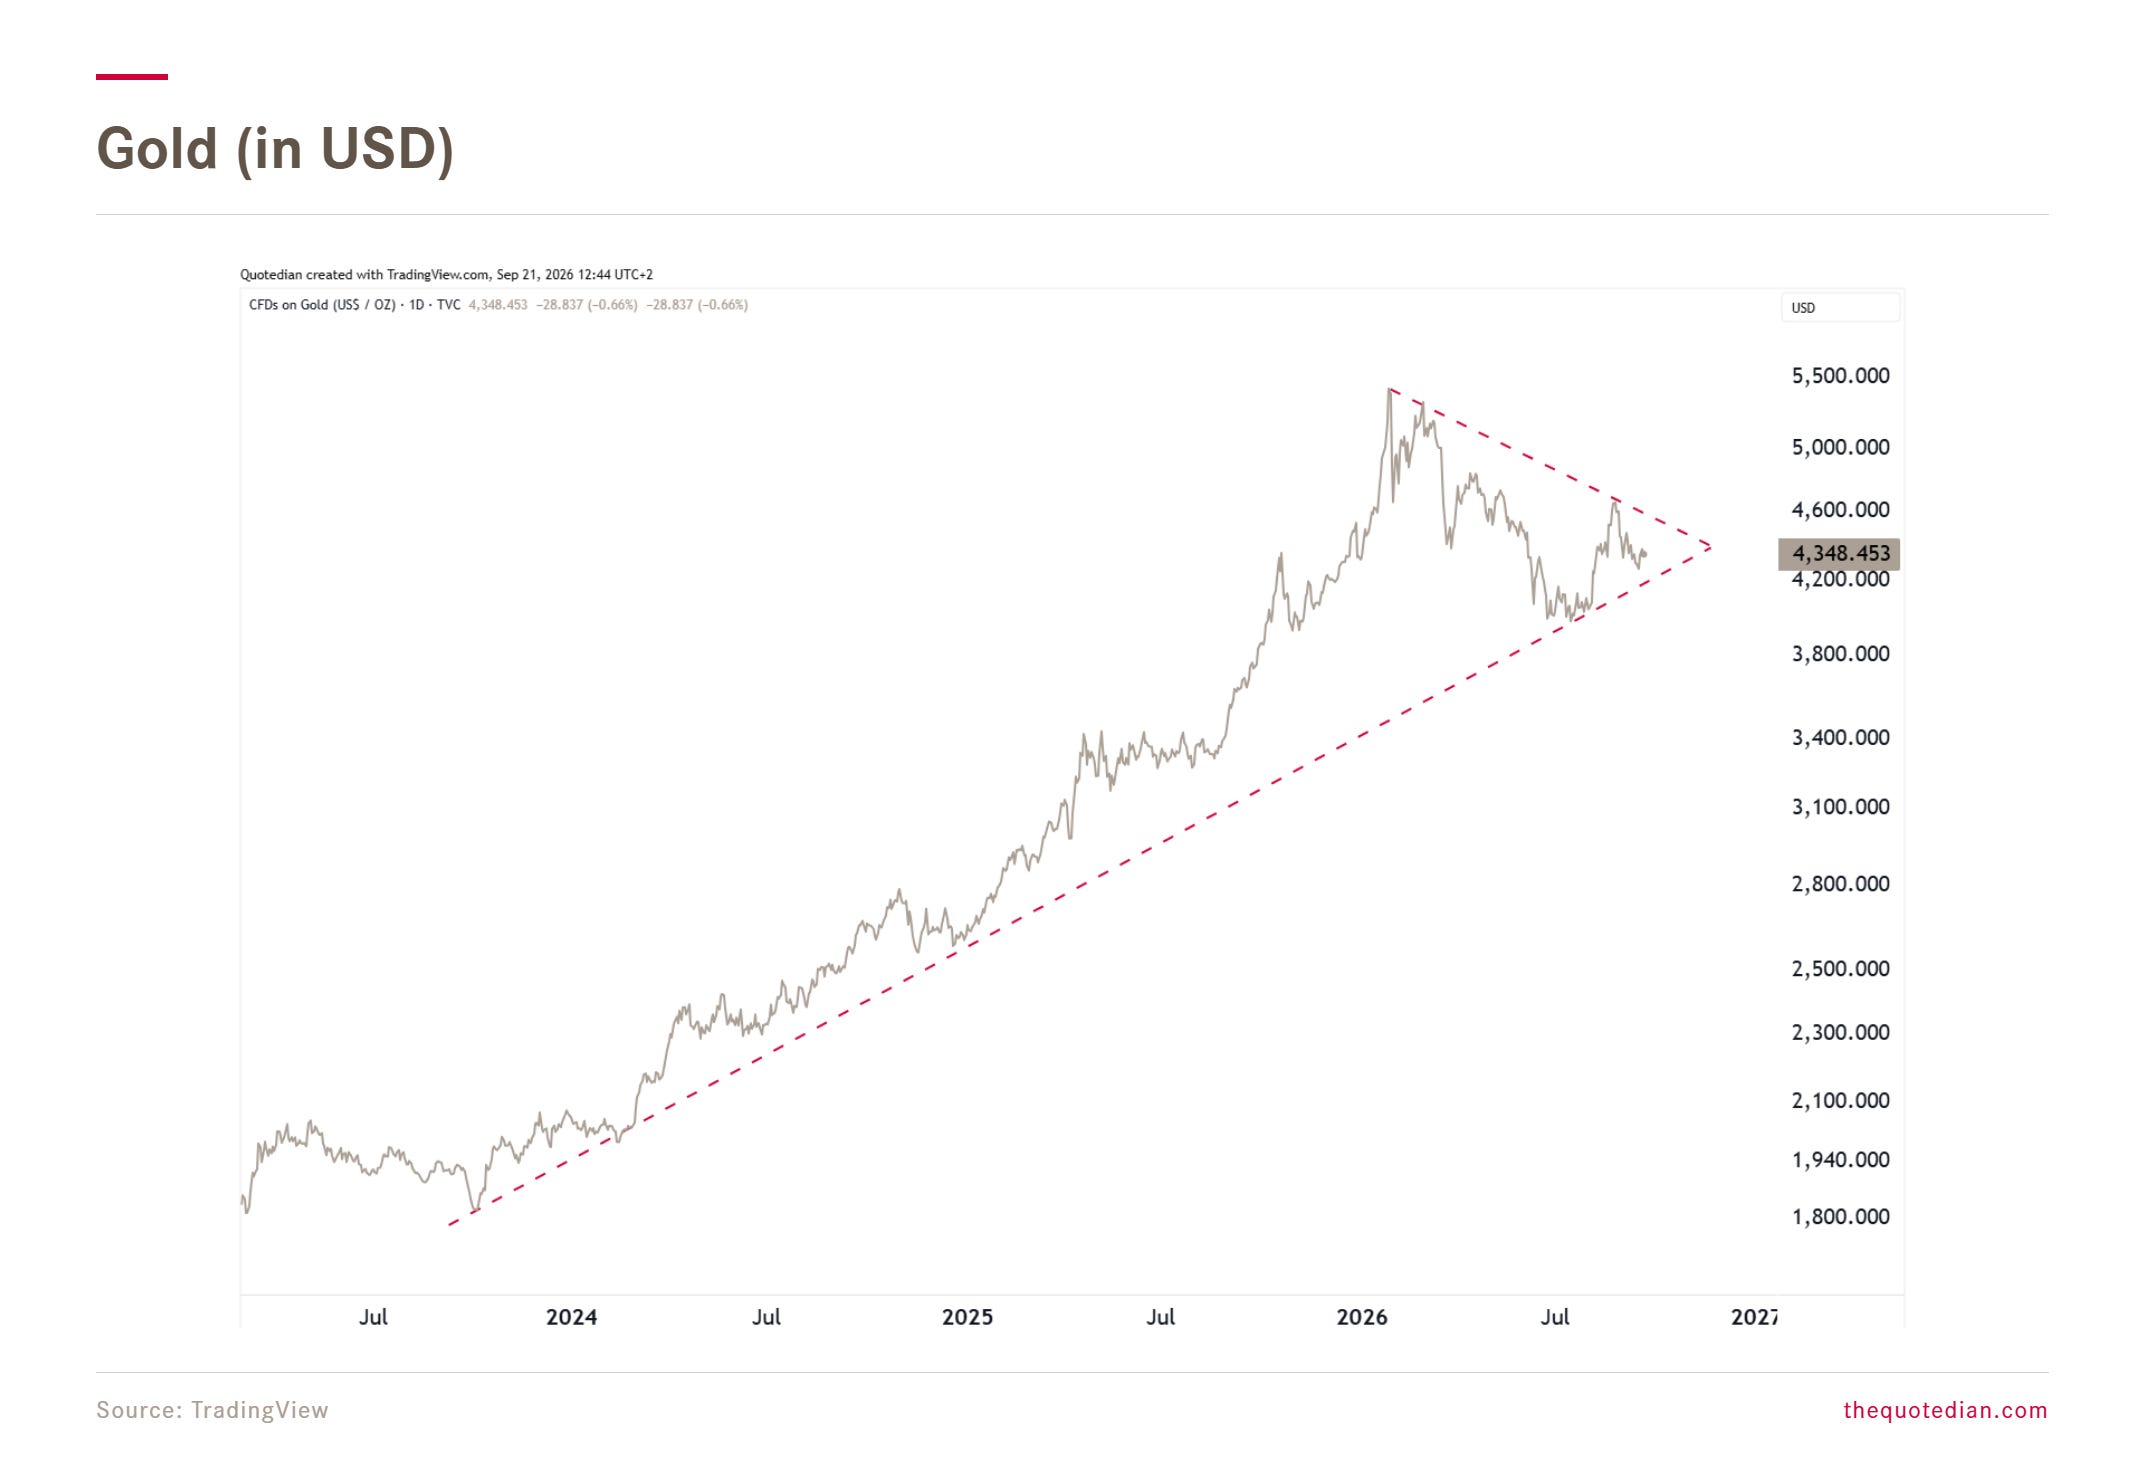
Something big may happen in Gold soon
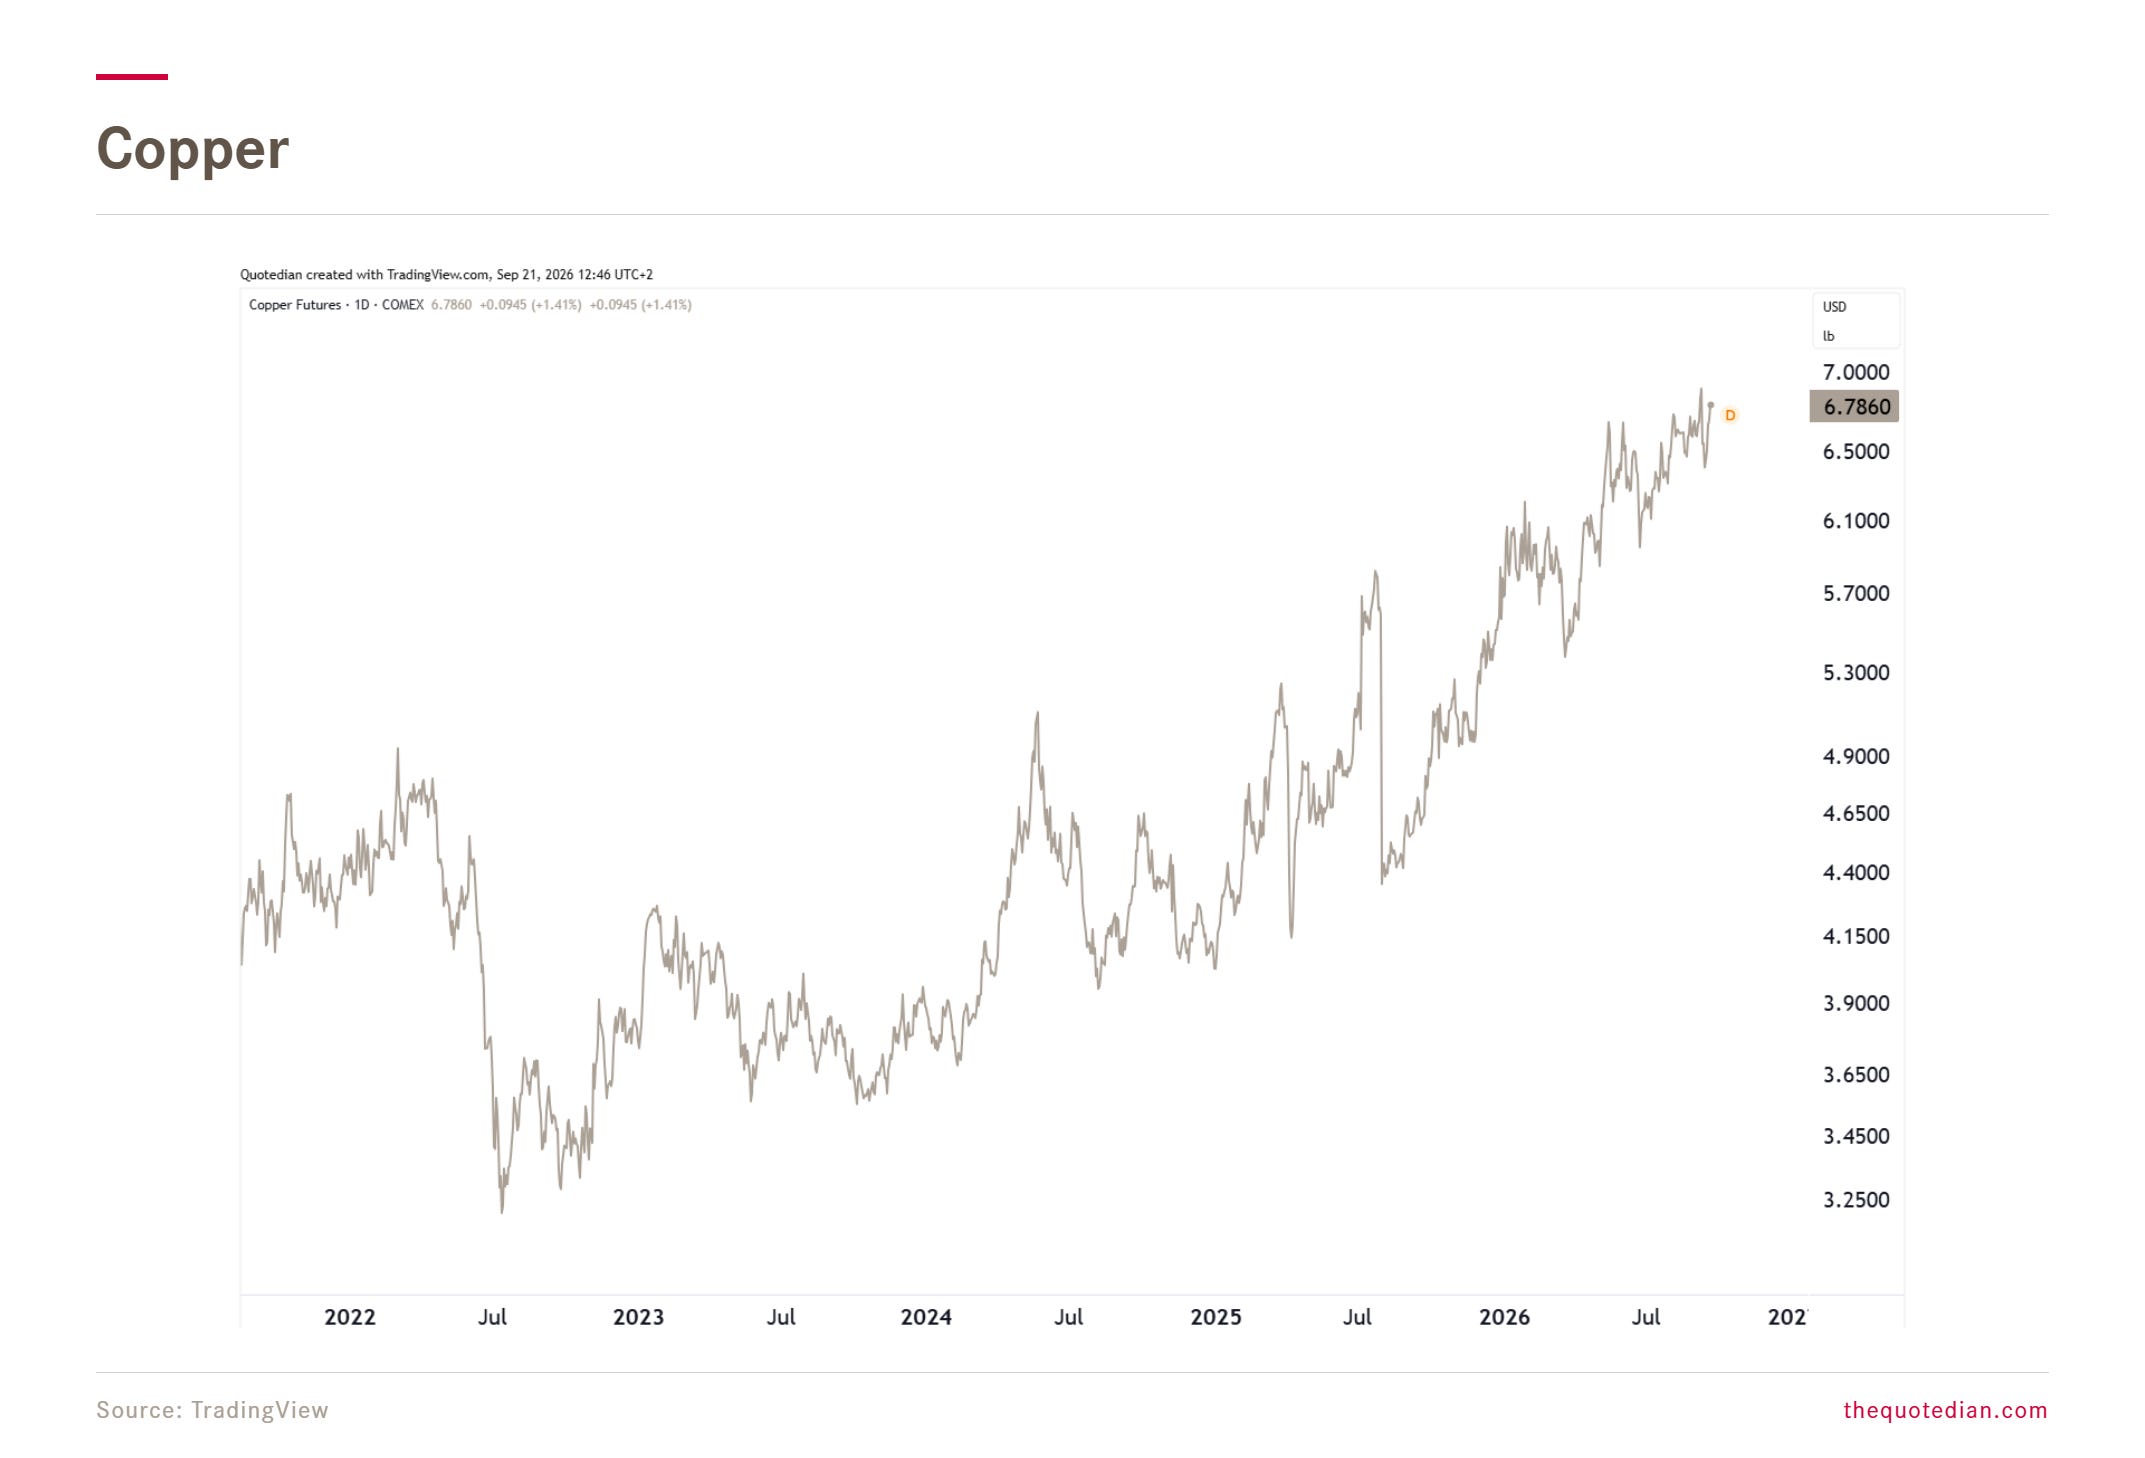
Stay long copper and copper miners

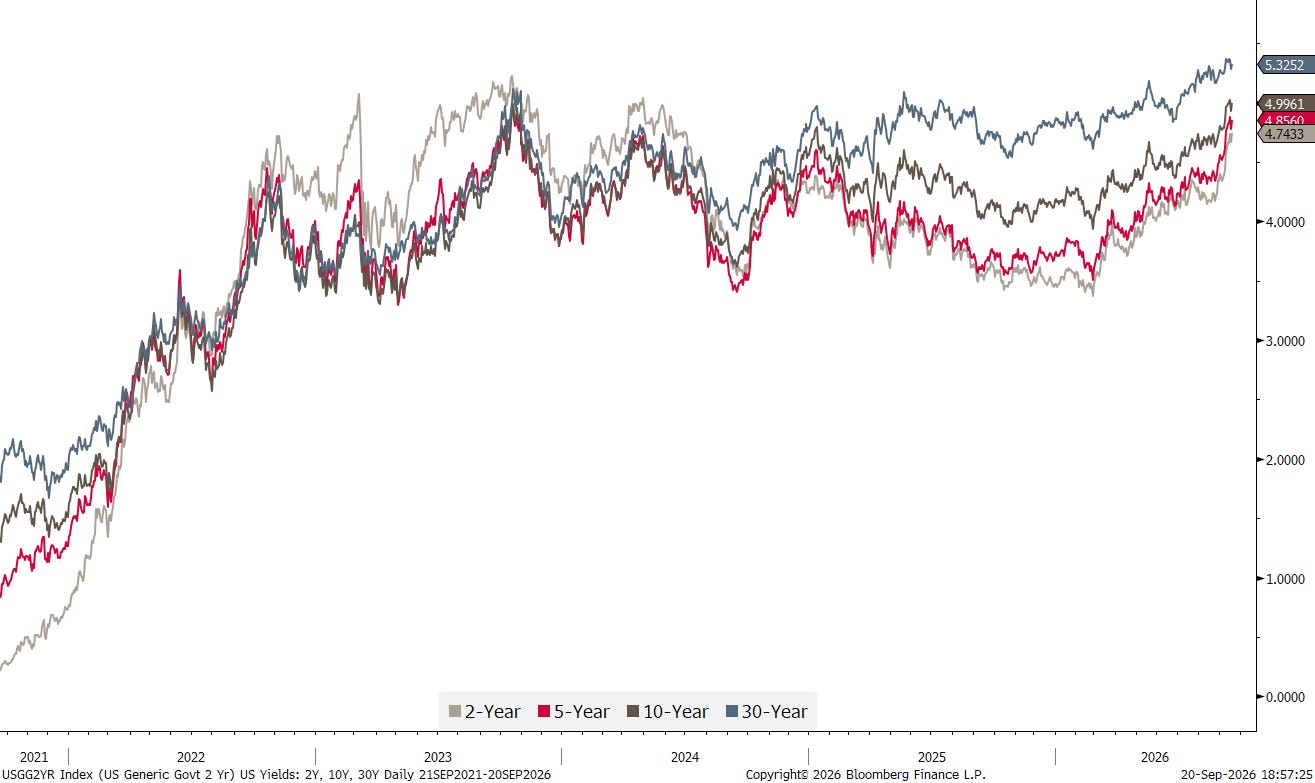
If you have been paying attention, you’ll know that I have been oracling* higher bond yields for months on end - and we are getting them!
*Oracling (v., neol.): from oracle, to prophesy. Distinct from forecasting in that a forecast is revised when wrong, whereas an oracle is merely reinterpreted. I reserve the right to the latter.
Not only in the US:
But also globally:
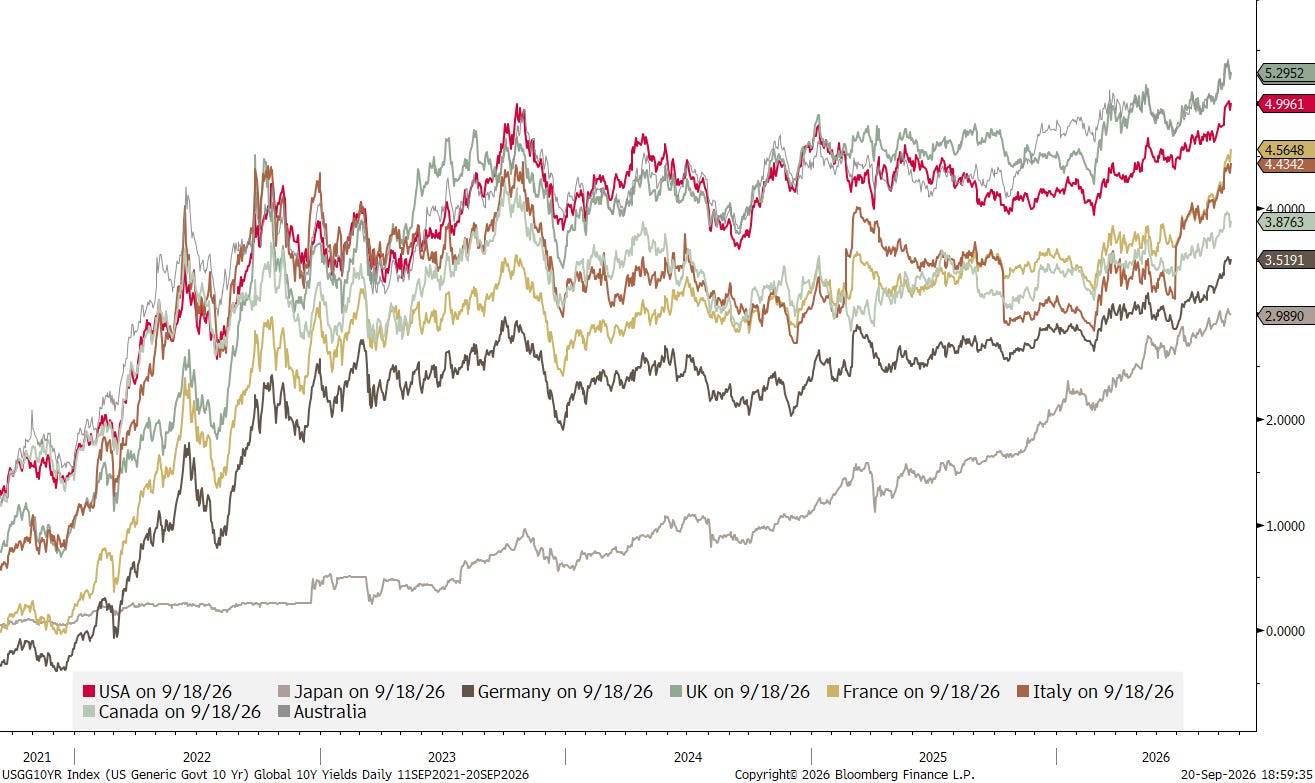
So, is 5% on US 10 Years then the magical number where equities bode and start selling off? Probably not.
BUT …
What is more important, is that Real Yields* are hitting multi-decade highs.
Real yield: the return on an investment after accounting for inflation — put simply, nominal yield minus inflation.
Not only in the US:
But also globally:
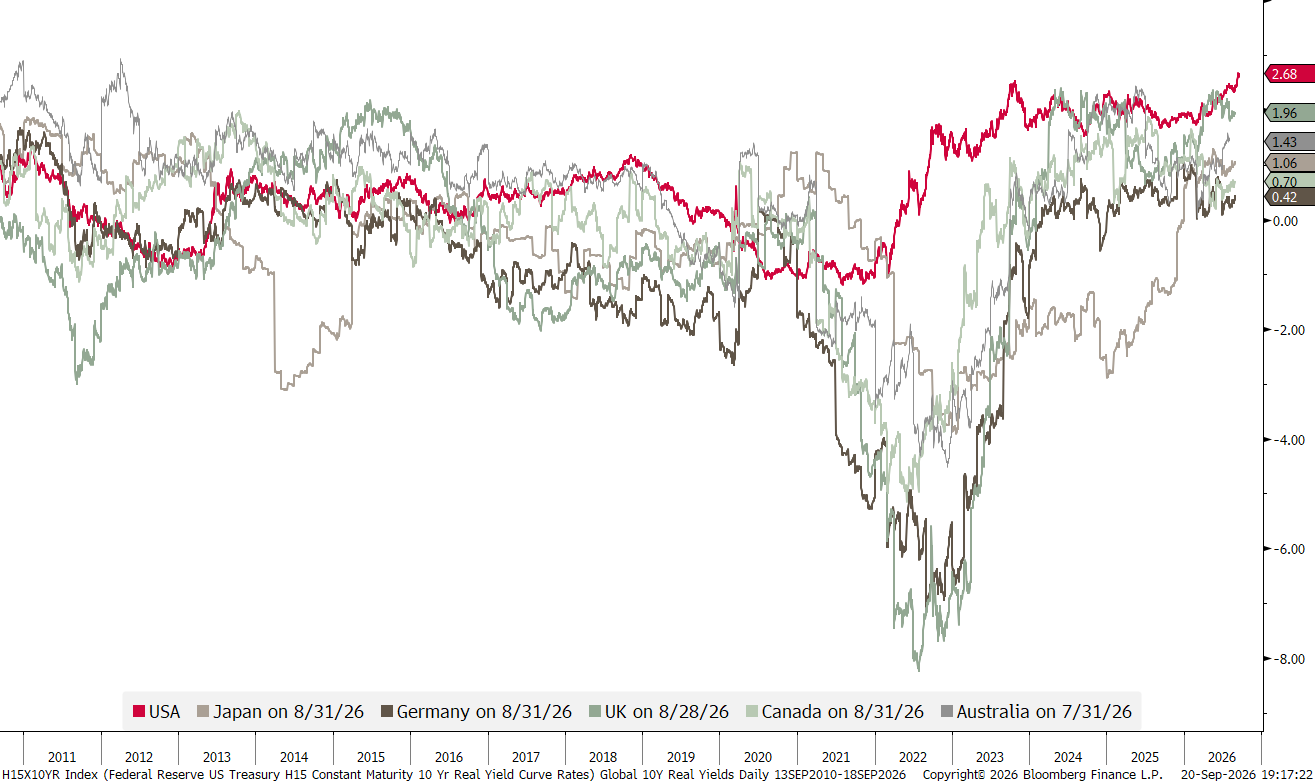
So what, you will ask.
Well, at a minimum, it means that long-term asset allocators, such as pension funds, endowment plans, family offices and similar, have the opportunity to ditch their old girlfriend TINA (There Is No Alternative) for the rejuvenated (Botox et al.) TIARA (There Is A Real Alternative).
I know, the younger investors amongst you (which is probably 97% of our readership) will say: “Hey, what do I care for a 2.68% real return, if the S&P 500 has given me 15%-plus since the GFC”.
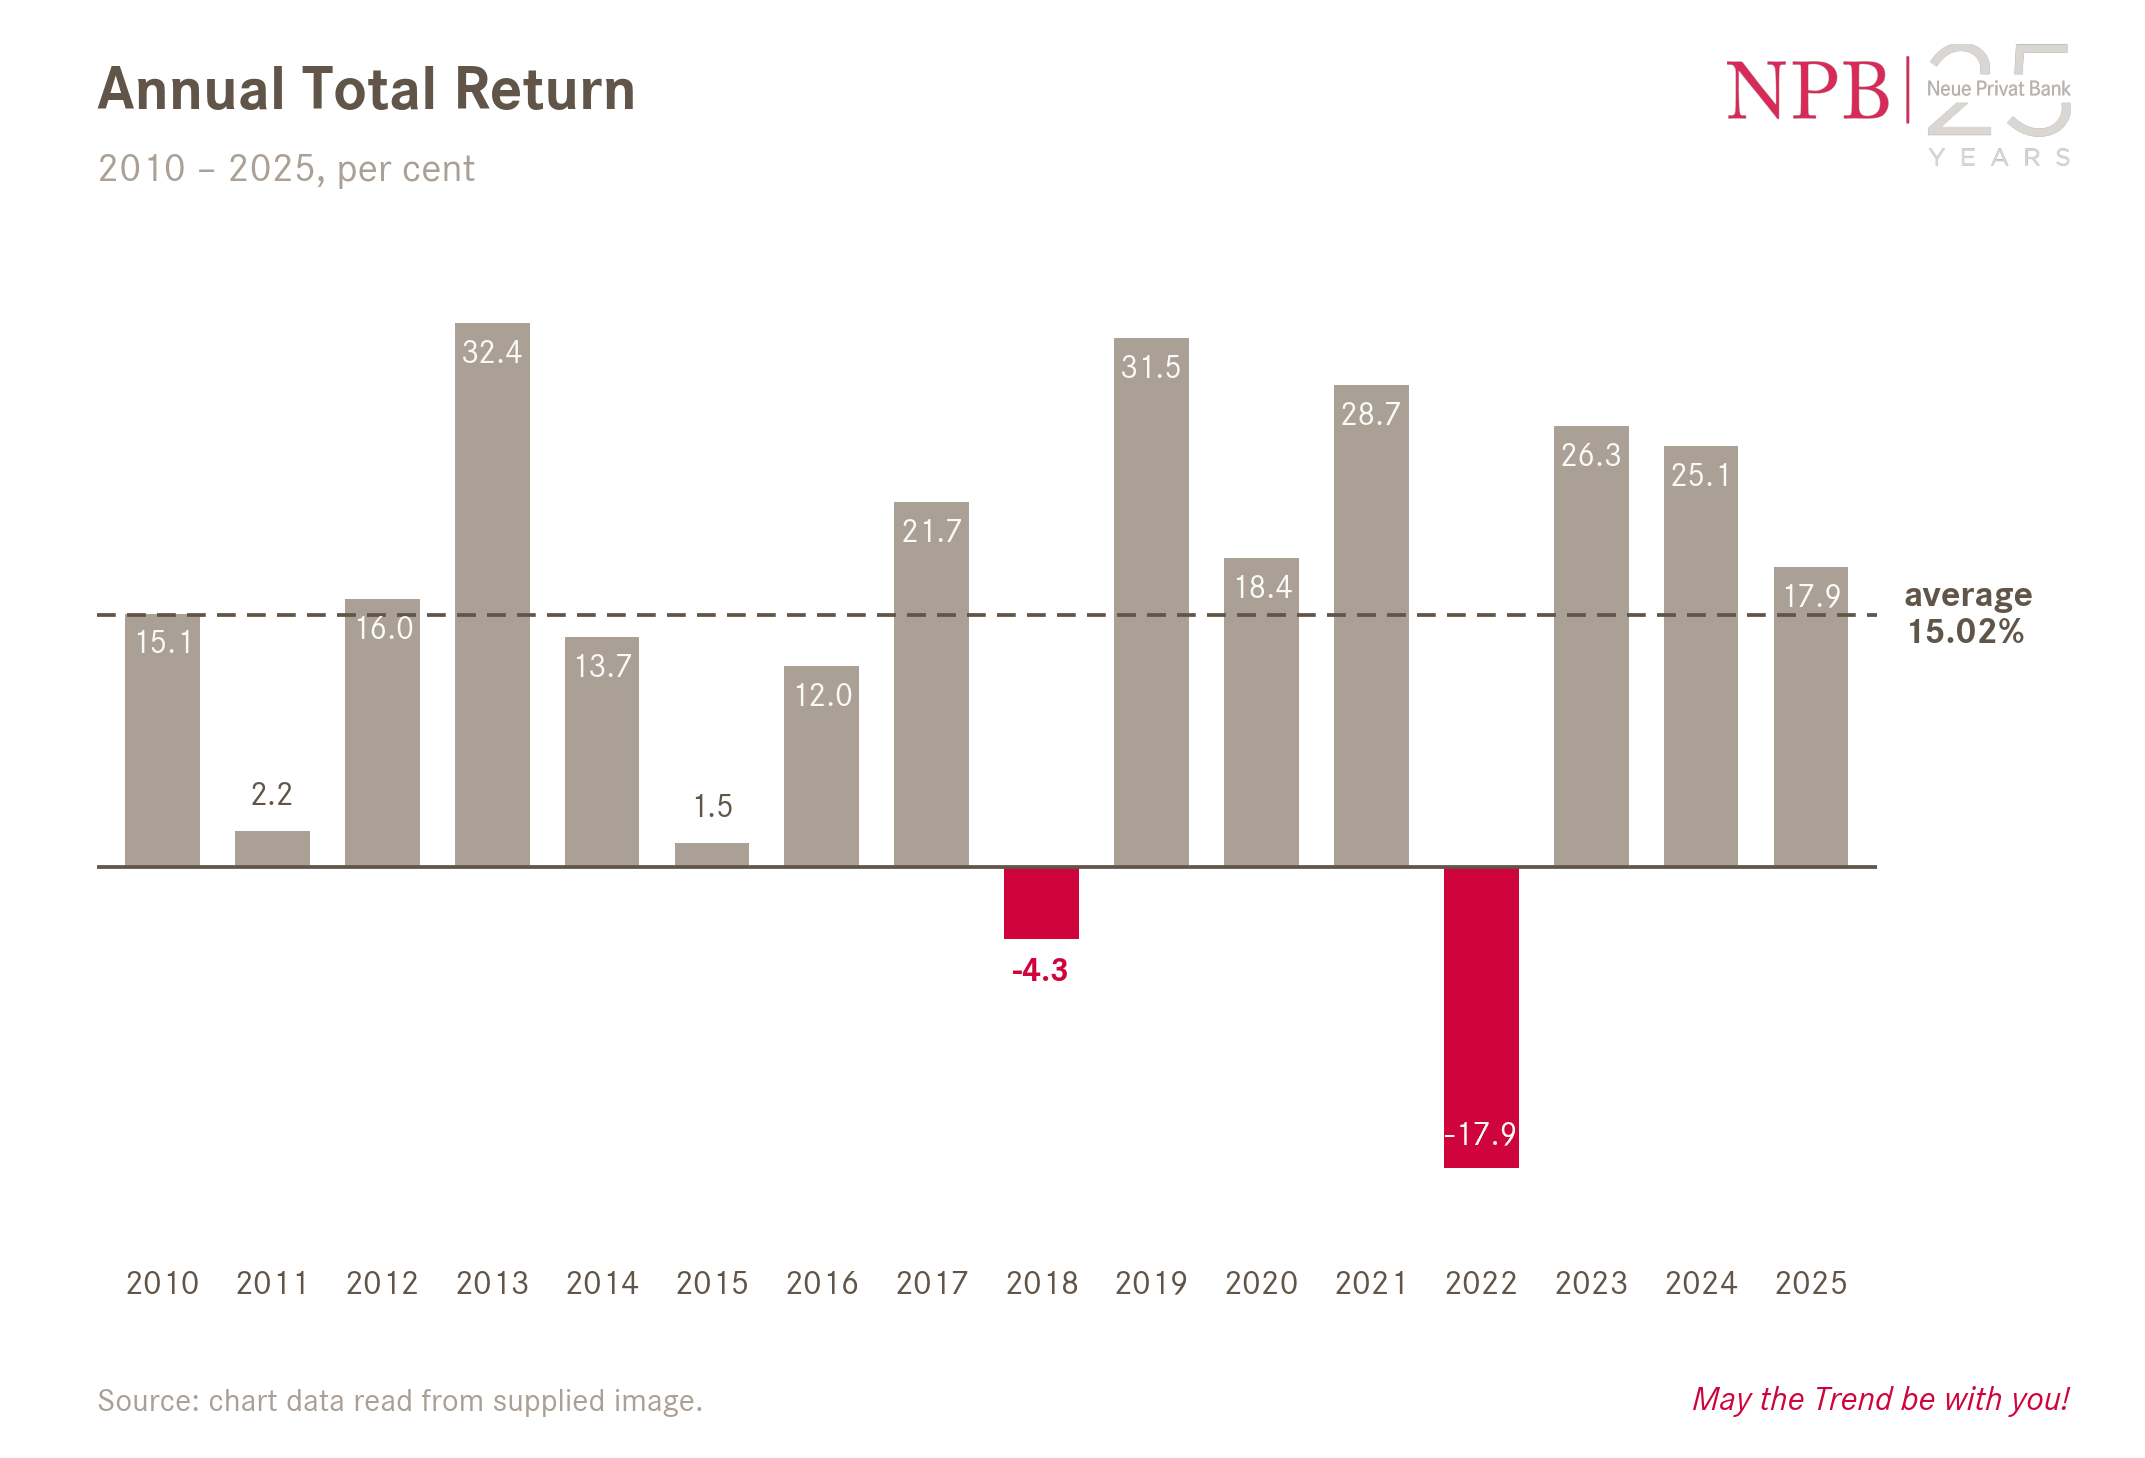
Well, good point, but do you think Mr. and Mrs. Smith, or Herr und Frau Schmid or even Watanabe-San would like to see this kind of draw-down in their pension plans?
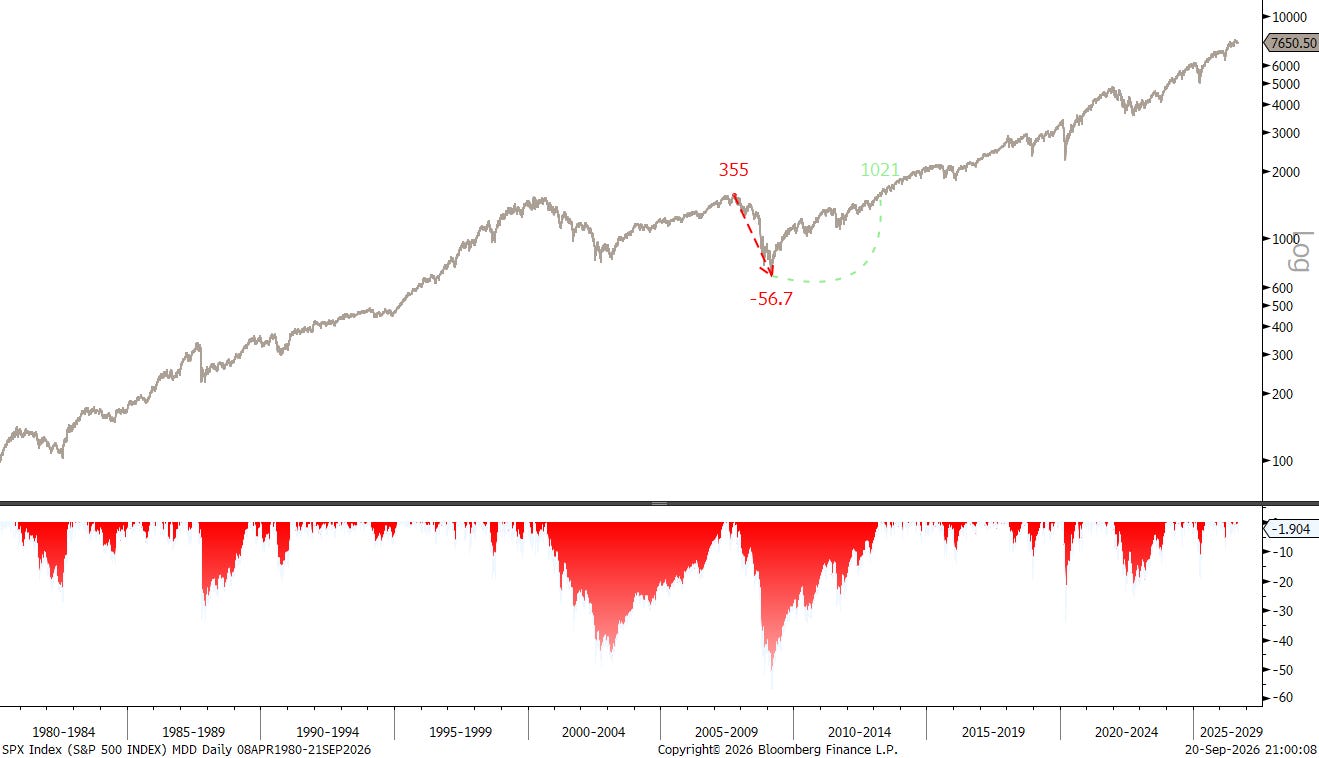
You may say: “Hey, over the long run, that went really well”. To which I would answer twofold. First, the classic “over the long run, we are all dead”.
Second, and much more serious, but super-difficult to quantify: “When looking into the abyss of a 40% loss or more (say your fortune was one million, now 600k), it is very difficult to not lose your cool and sell to save what is left.”
Trust me, no pensioner will want to see that on this statement.
Hence, when you get paid close to 3% above inflation, that’s not bad at all, dude.
Therefore, without becoming outright bond bulls at these levels, though a snap-back rally also seems attractive here, buying some TIPS* (Treasury Inflation-Protected Securities) could make a lot of sense here.
*TIPS - A US government bond that rises with inflation. Prices go up 3%, your bond value goes up 3%, and your interest is paid on the larger amount — so inflation can’t erode what you get back.
You pay for that with a lower starting interest rate than a normal bond.
For an absolute return focused investor (and many others), this makes a whole lot of sense.
US TIPS are plentiful and liquid:
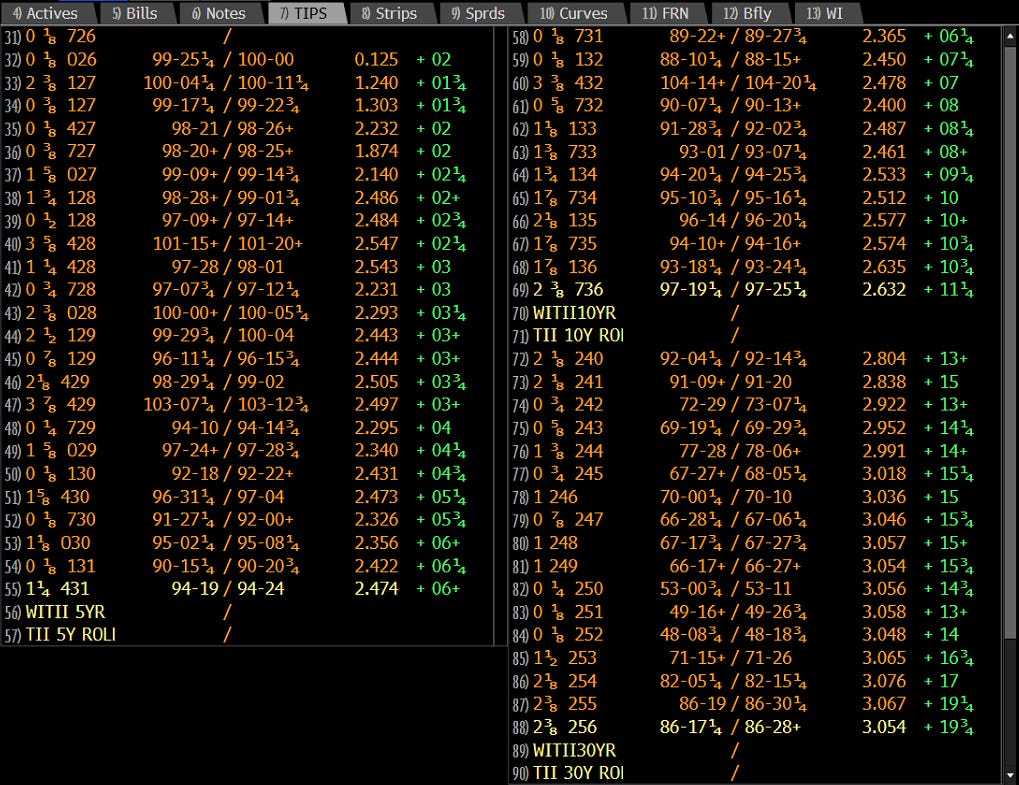
If you do not have a Bloomberg terminal, you can easily find a lot of resources online, one of them being here.
Or, to keep it nice and easy, you can buy a TIPS focused ETF, such as the London-listed State Street SPDR Bloomberg US TIPS UCITS ETF (TIPS LN), or the US-based Schwab U.S. TIPS ETF (SCHP US) and the iShares TIPS ETF (TIP US). The latter is the largest in terms of AuMs, but also the most expensive. SCHP and TIPS have a TER of 0.03% and 0.04% respectively.
Also, TIPS aren't uniquely American. Across the Atlantic, France's OAT€i, Italy's BTP€i, Germany's remaining Bund/€i and Britain's index-linked gilts offer variations on the same proposition: lend money to a government at a known real yield and let inflation determine the nominal return.
But that’s enough on inflation-linked bonds for today. Let’s see BRIEFLY if we find some more hints & TIPS across other asset classes.
Starting with equities, investors have been very respectful on the S&P 500' of the key 7,600 pivot zone and the 50-day moving average:
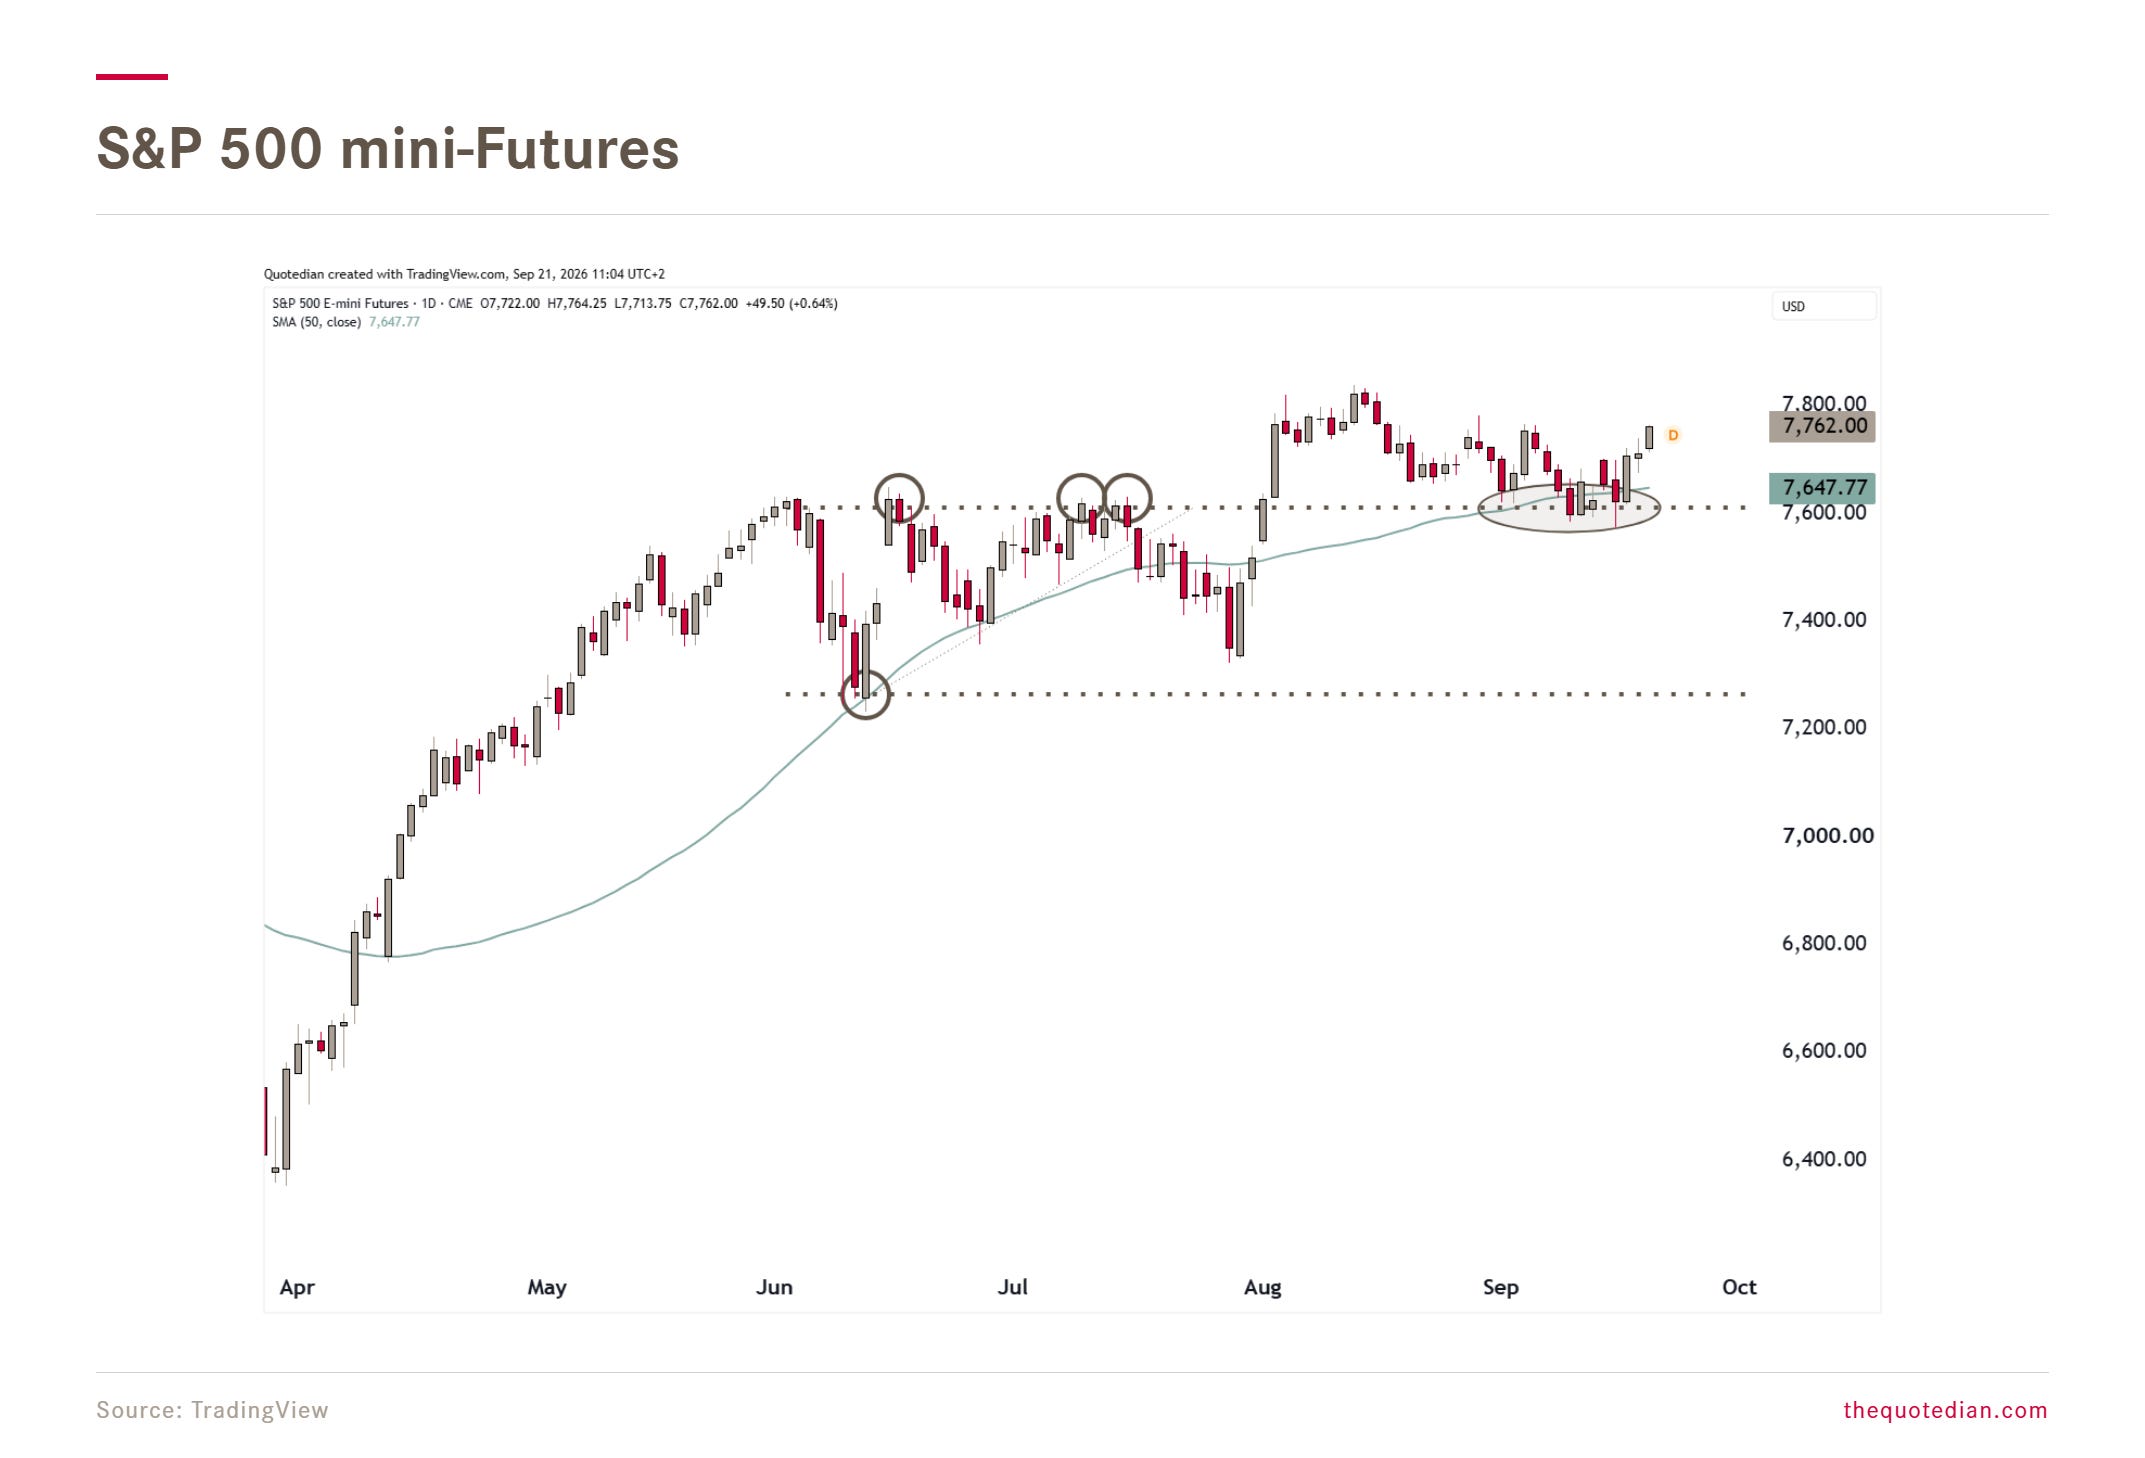
If today can indeed eke out a gain, as futures prices currently indicate, then that chart looks suddenly much more constructive again.
And maybe even more interesting, the tech-heavy Nasdaq seems to have found new tailwind:
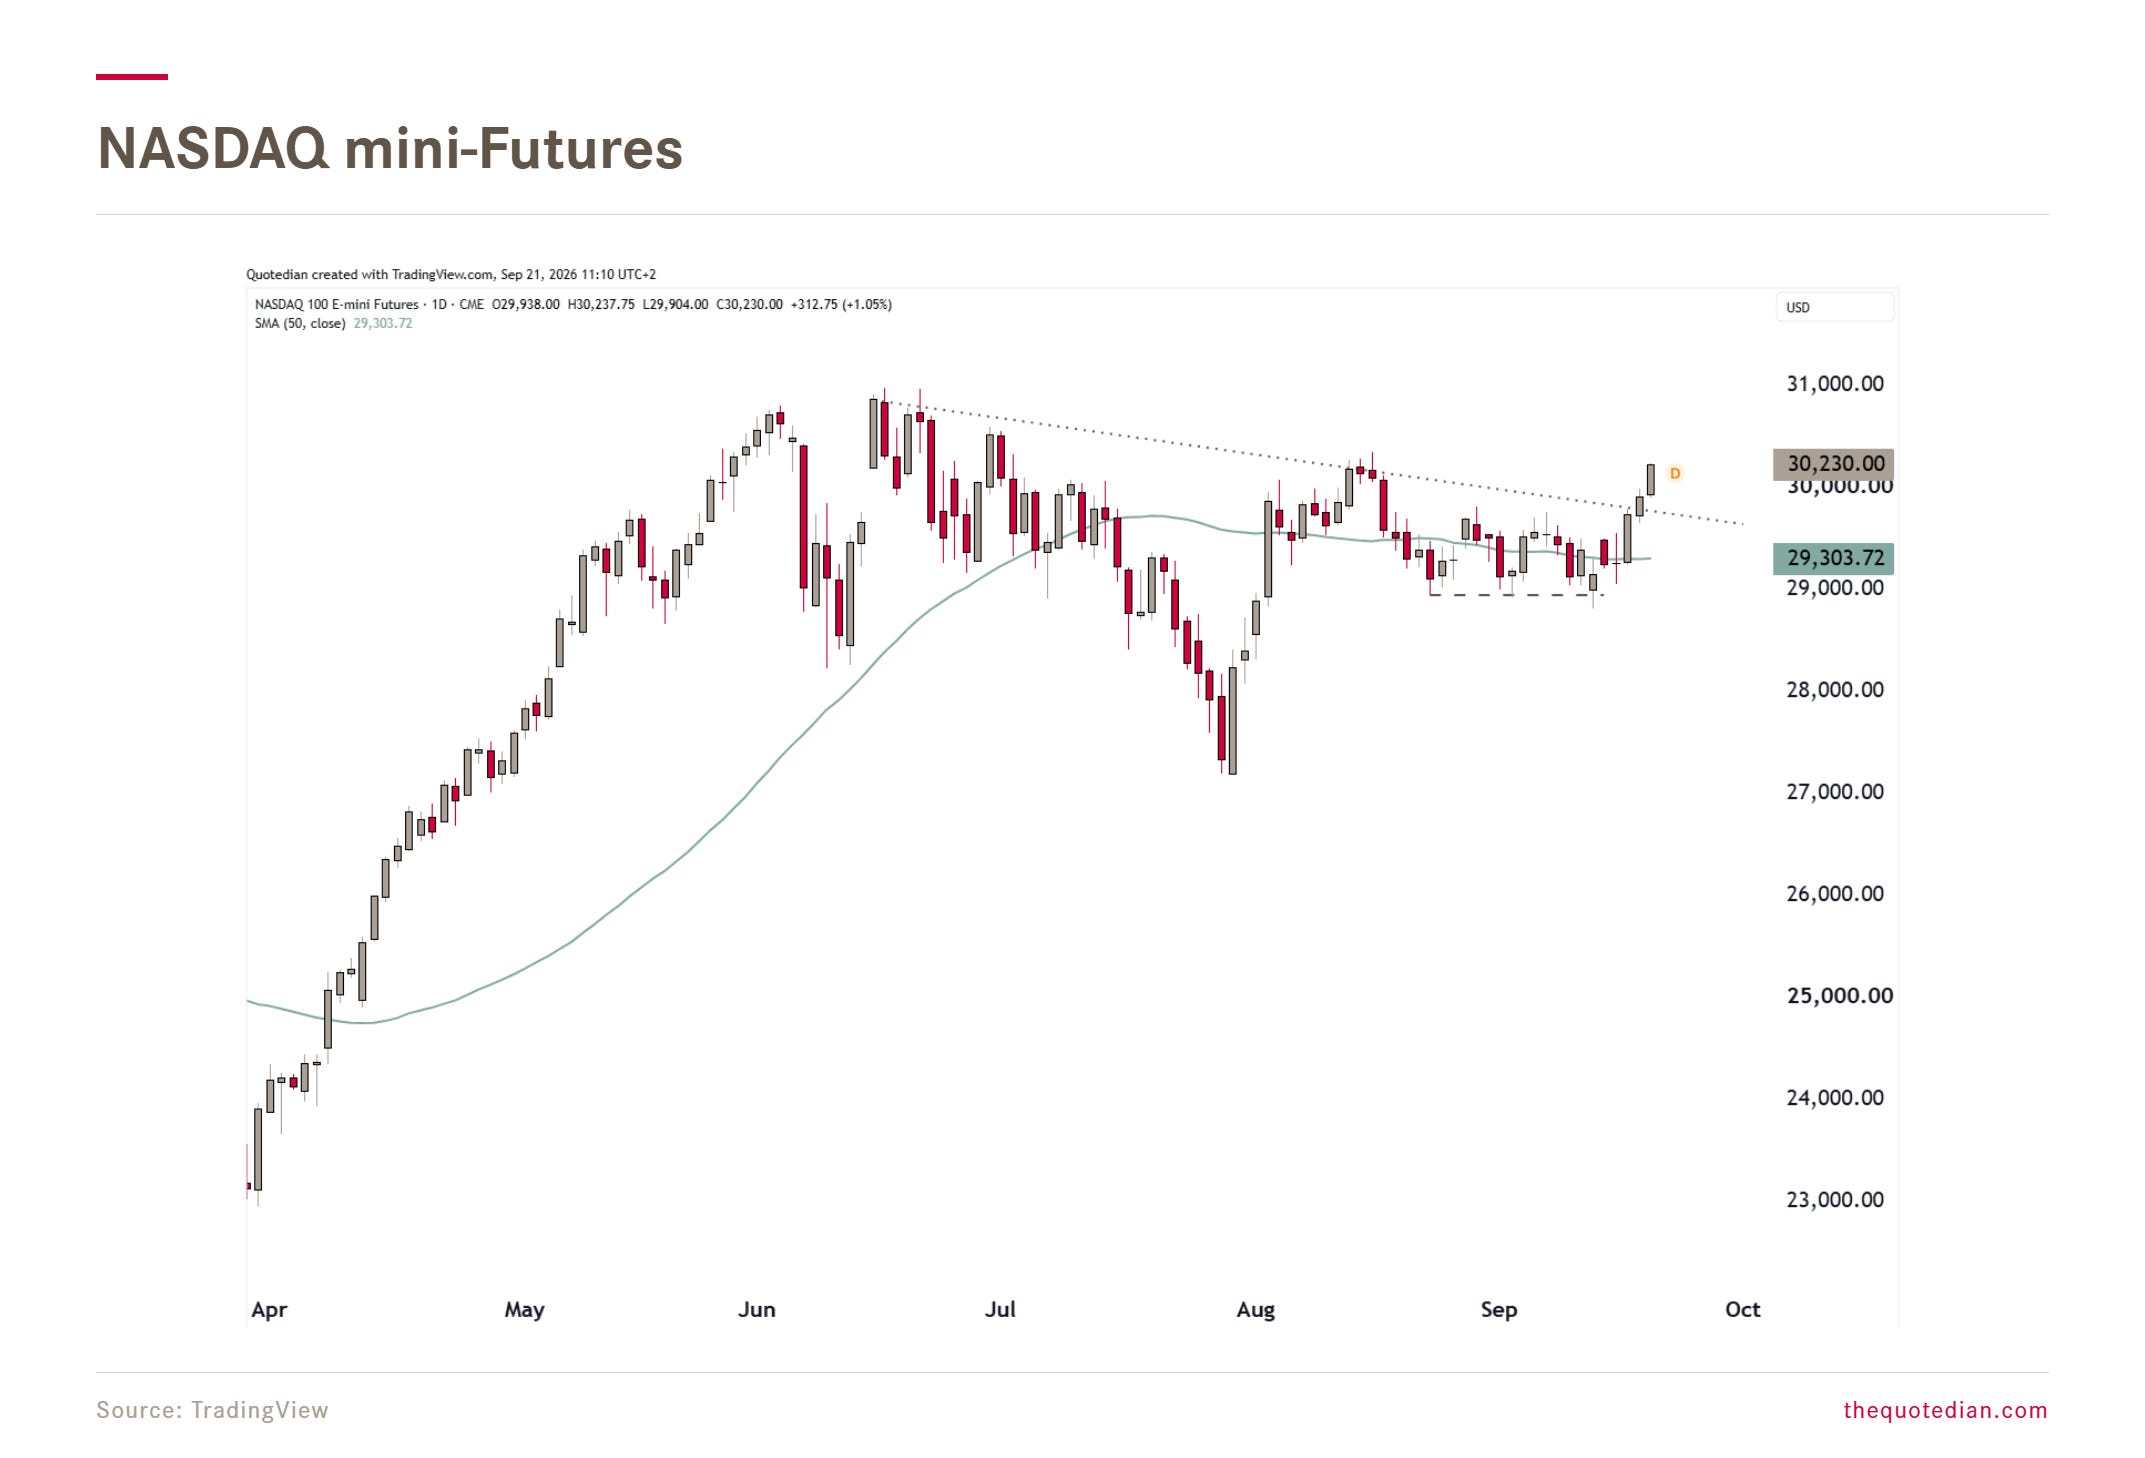
As a matter of fact, we could argue that the Nasdaq is about to abandon its pattern of lower lows and lower highs (something futures prices have already done this morning) and that we may be breaking out of a huge consolidation flag:
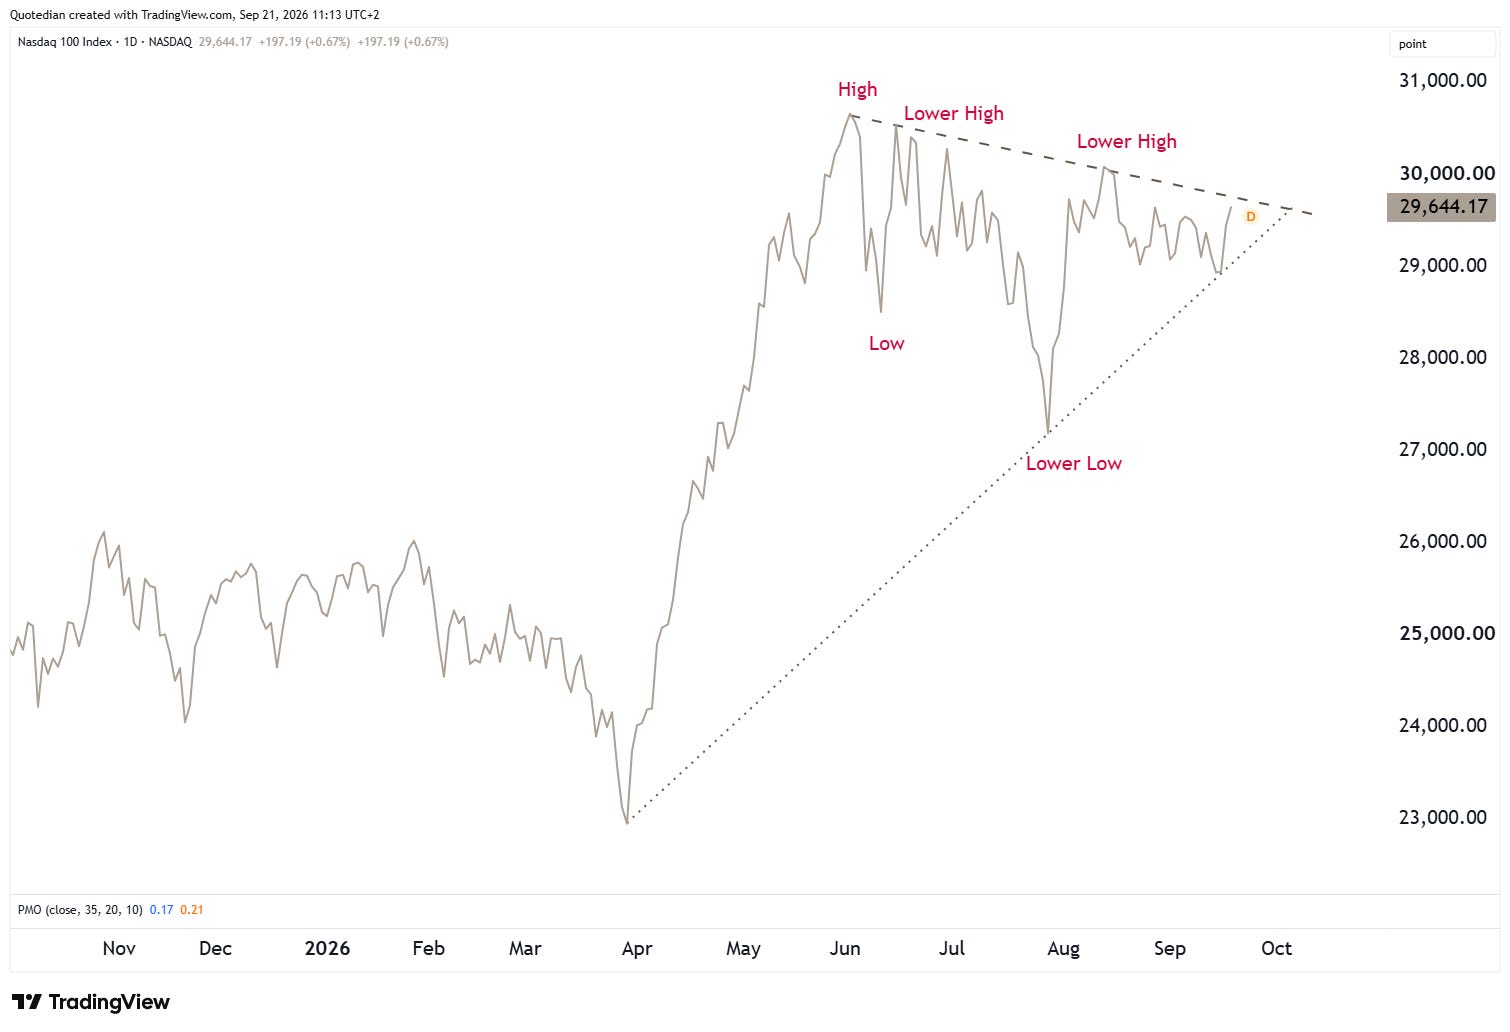
Such a breakout could lead to substantial more upside, just at a time when retail investors (AAII) have expressed their most bearishness in over 18-months:
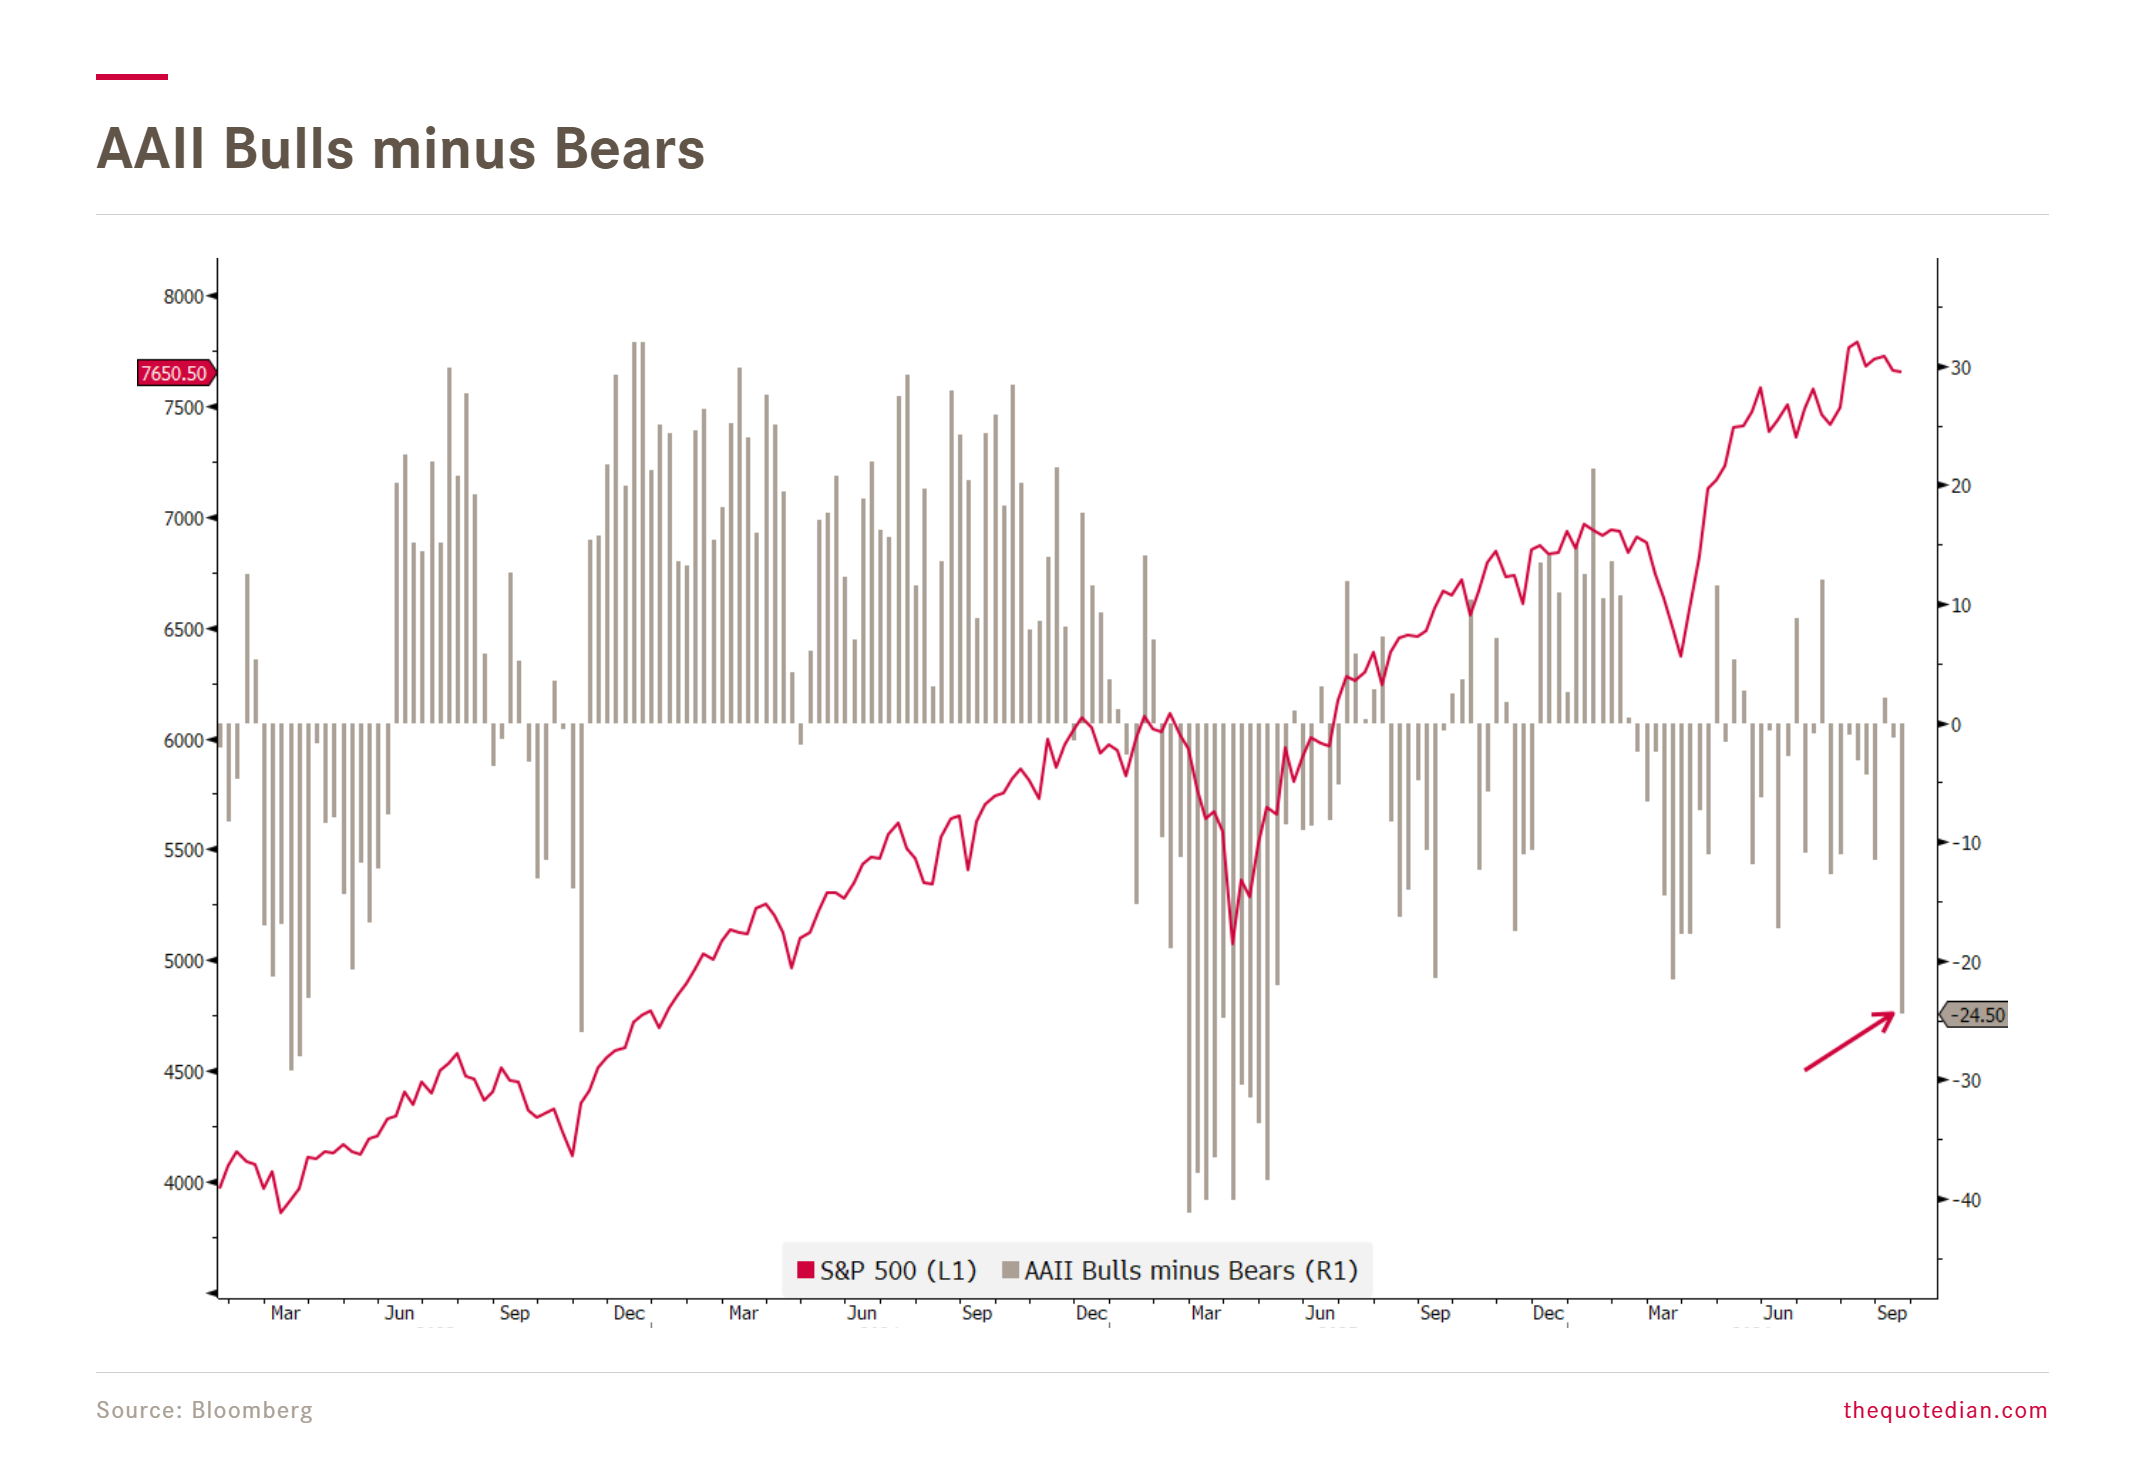
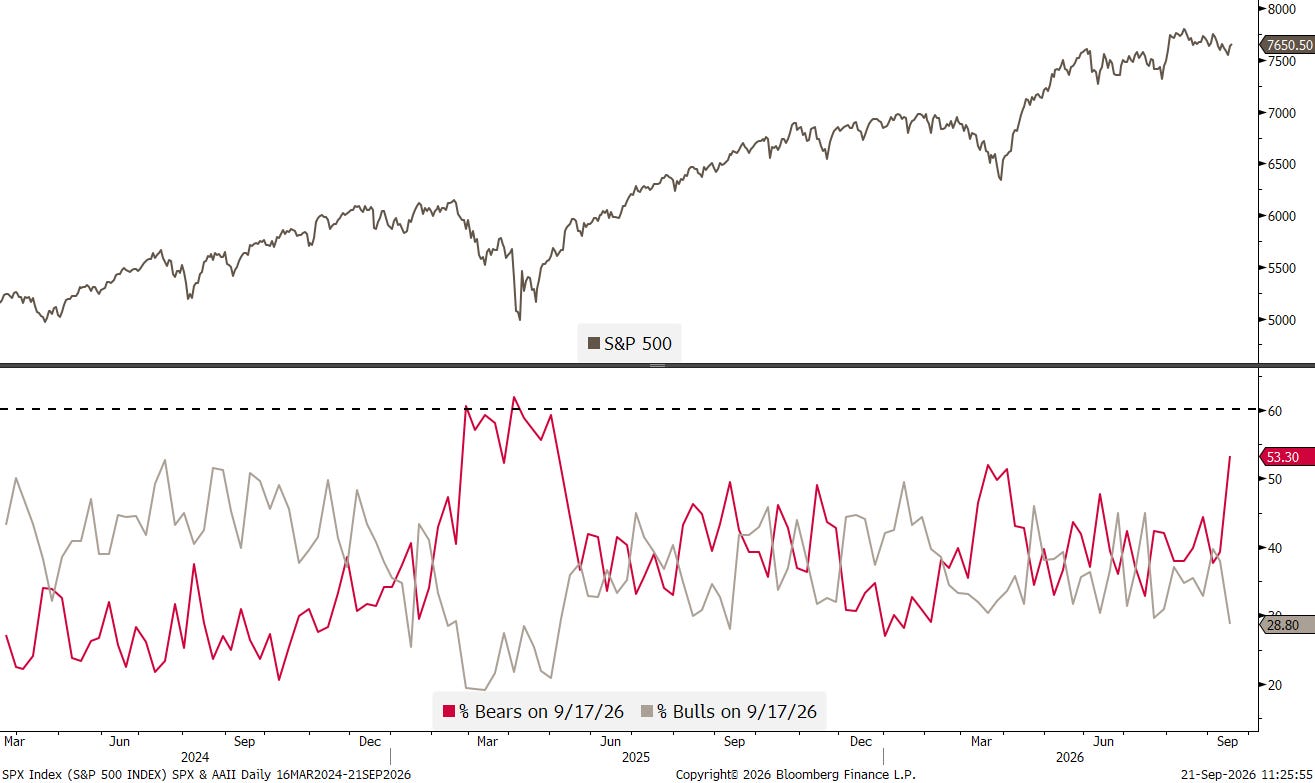
This is mainly due to the bears having increased meaningfully, to their highest since the breakout of the Iran conflict:
Maybe this bearishness came after the warnings from these three blokes a week ago:

But, remember, when the USSR agreed to slow the arms race in 1987, it was not because it suddenly cared about safety. It was because it was running out of money and would soon collapse.
Just saying…
Keeping it very short this week, we already hope over to interest rates (again, I know), via the following cross-asset chart, which also bodes a positive message for equities:
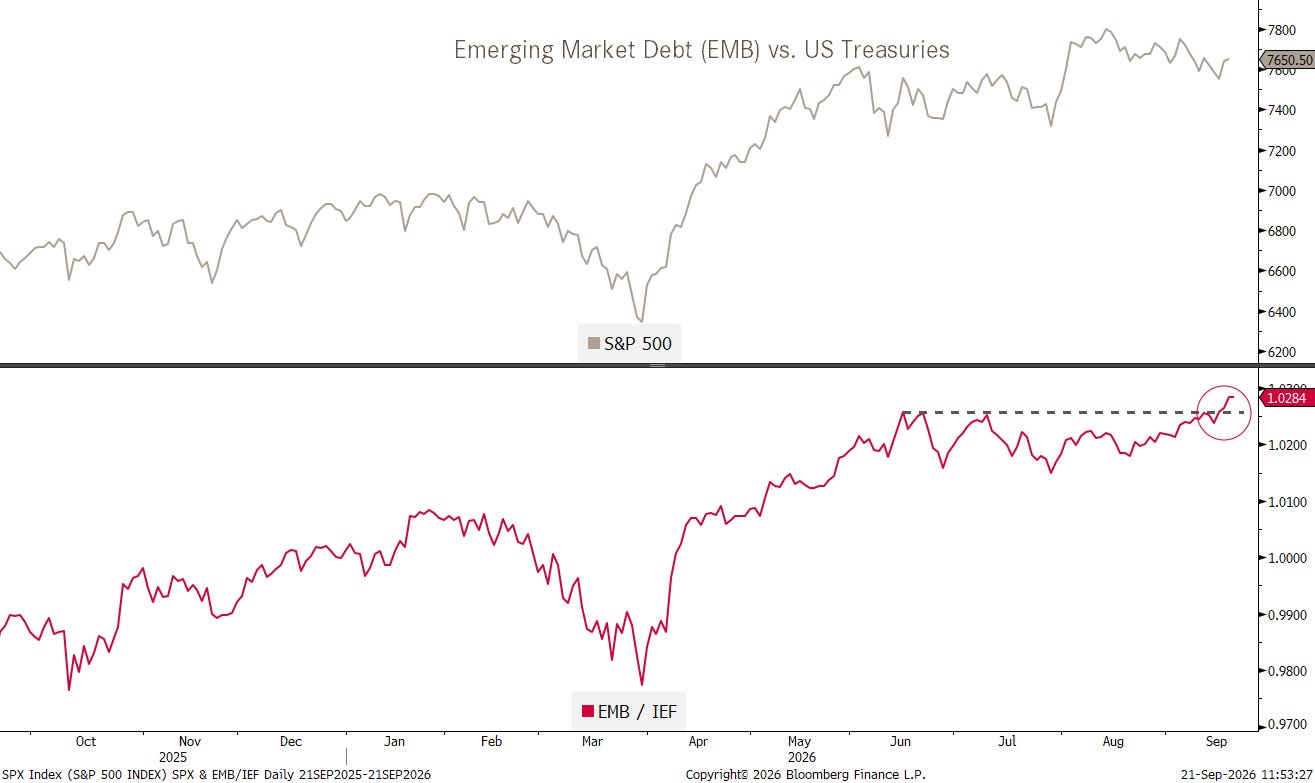
Emerging market bonds, as measured via the iShares J.P. Morgan USD Emerging Markets Bond ETF (EMB) are breaking out relatively to US Treasury bonds, here proxied with the iShares 7-10 Year Treasury Bond ETF. As both have a very comparable duration (6.5-7), this is not about interest rate risk, but about increasing risk appetite from bond investors, which could be an early sign for increasing risk appetite on the behalf of equity investors too.
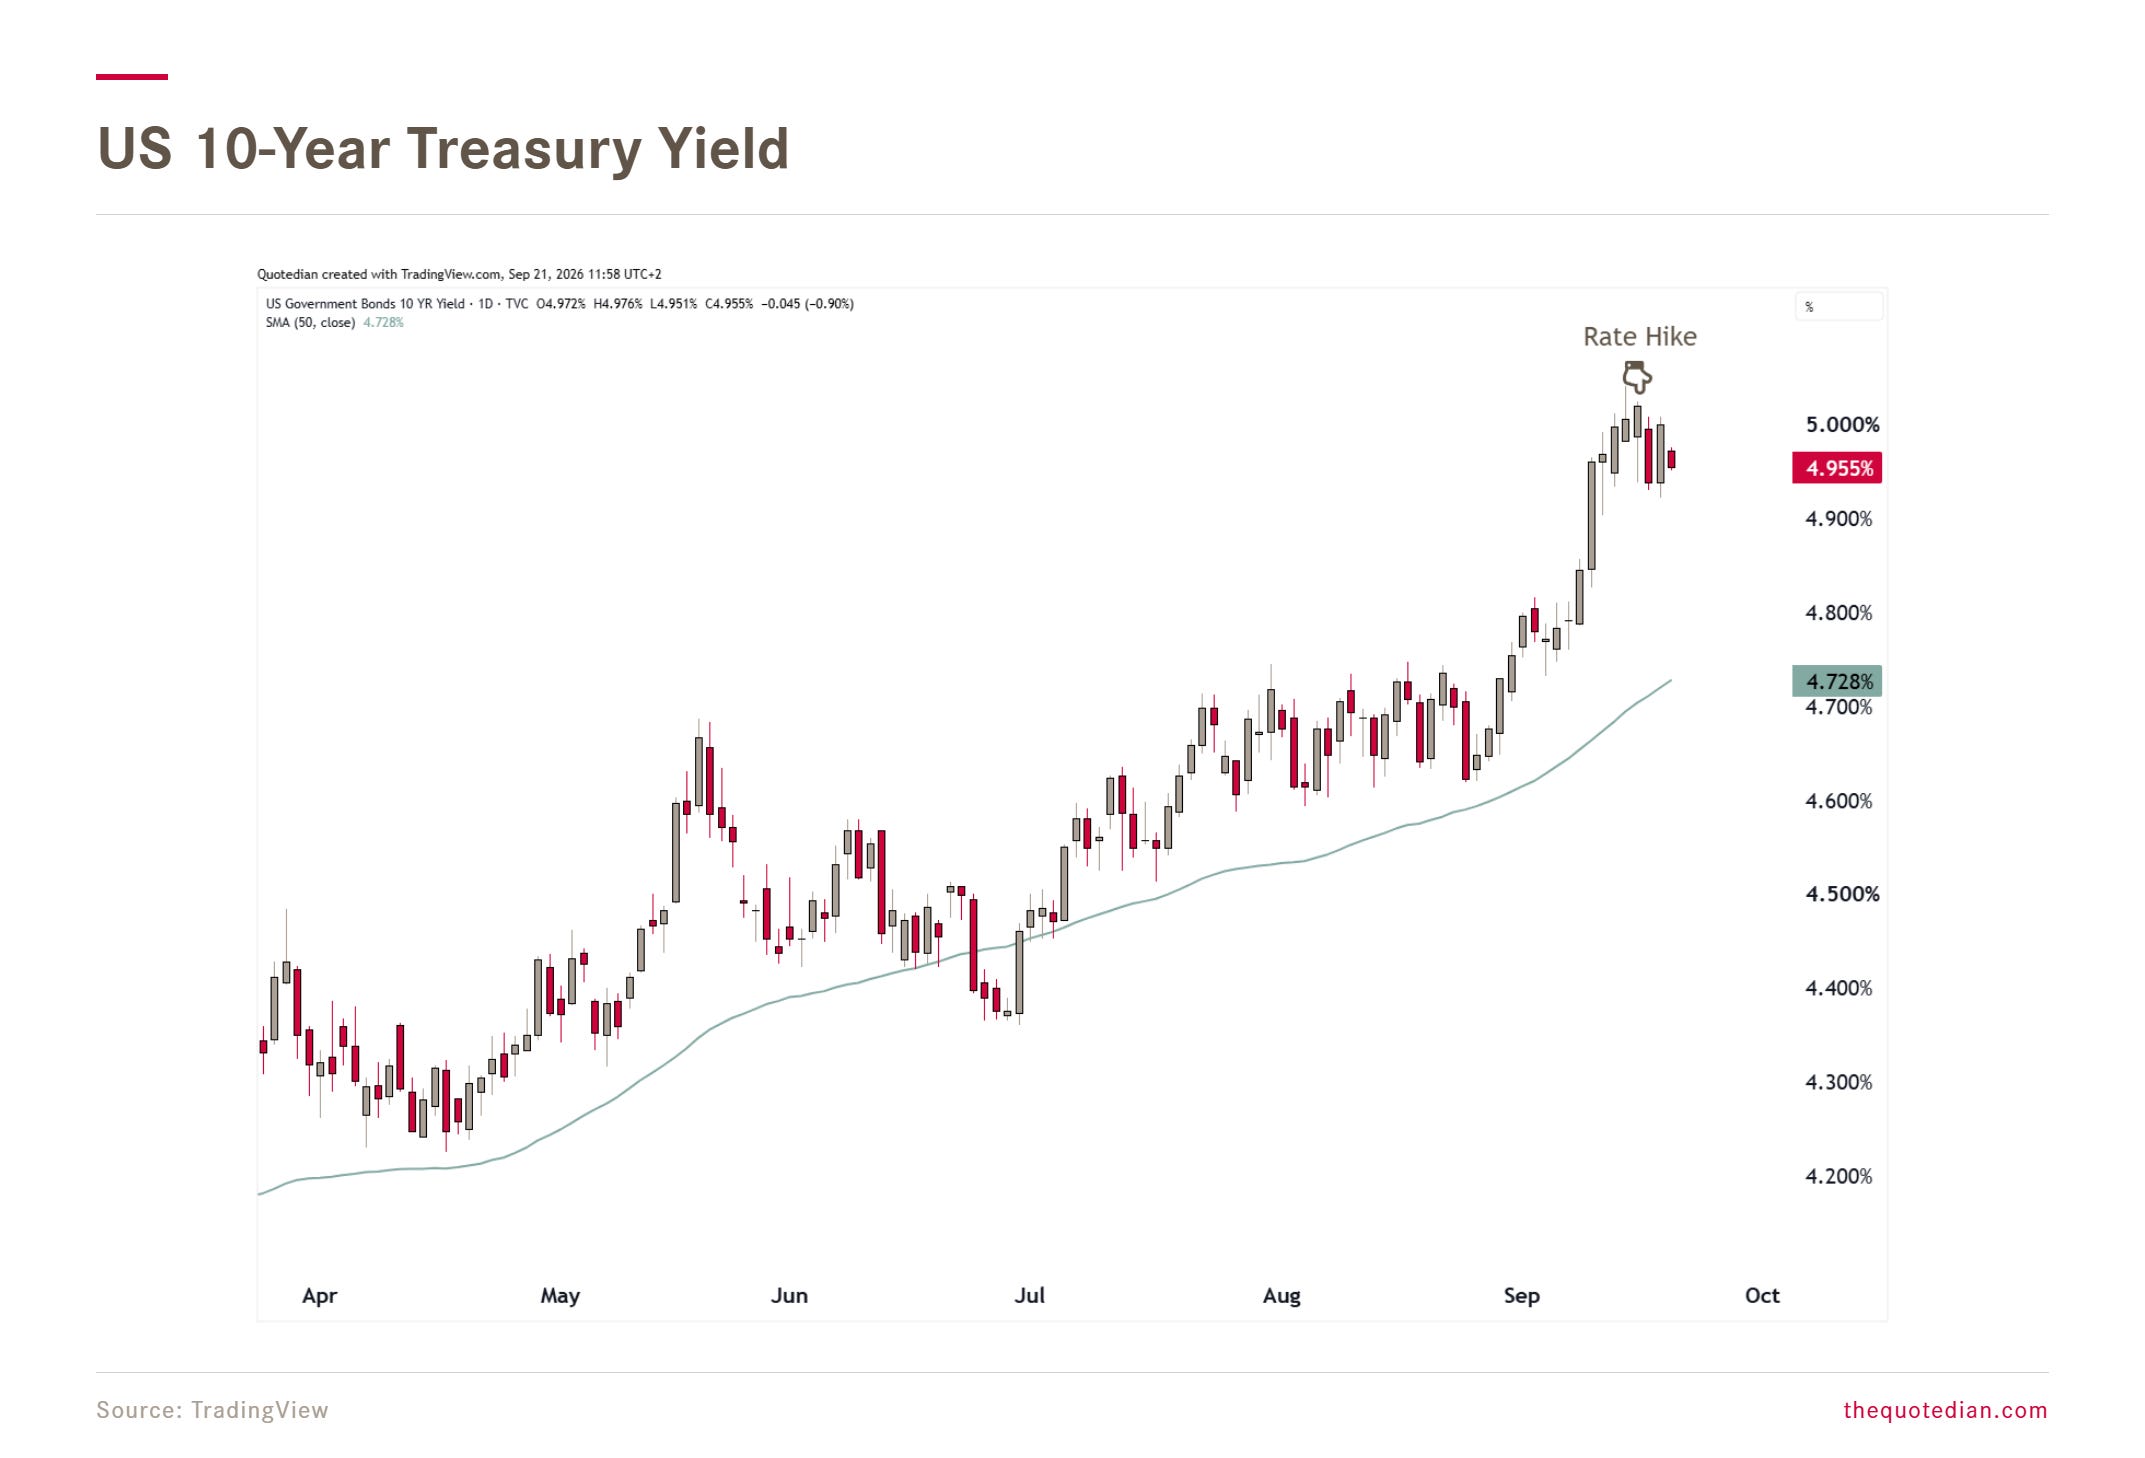
Of course, we had the hawkish hike from the FOMC last week, which seems to have a put, at least for now, a stop to the raise in the yields at the long-end of the curve:
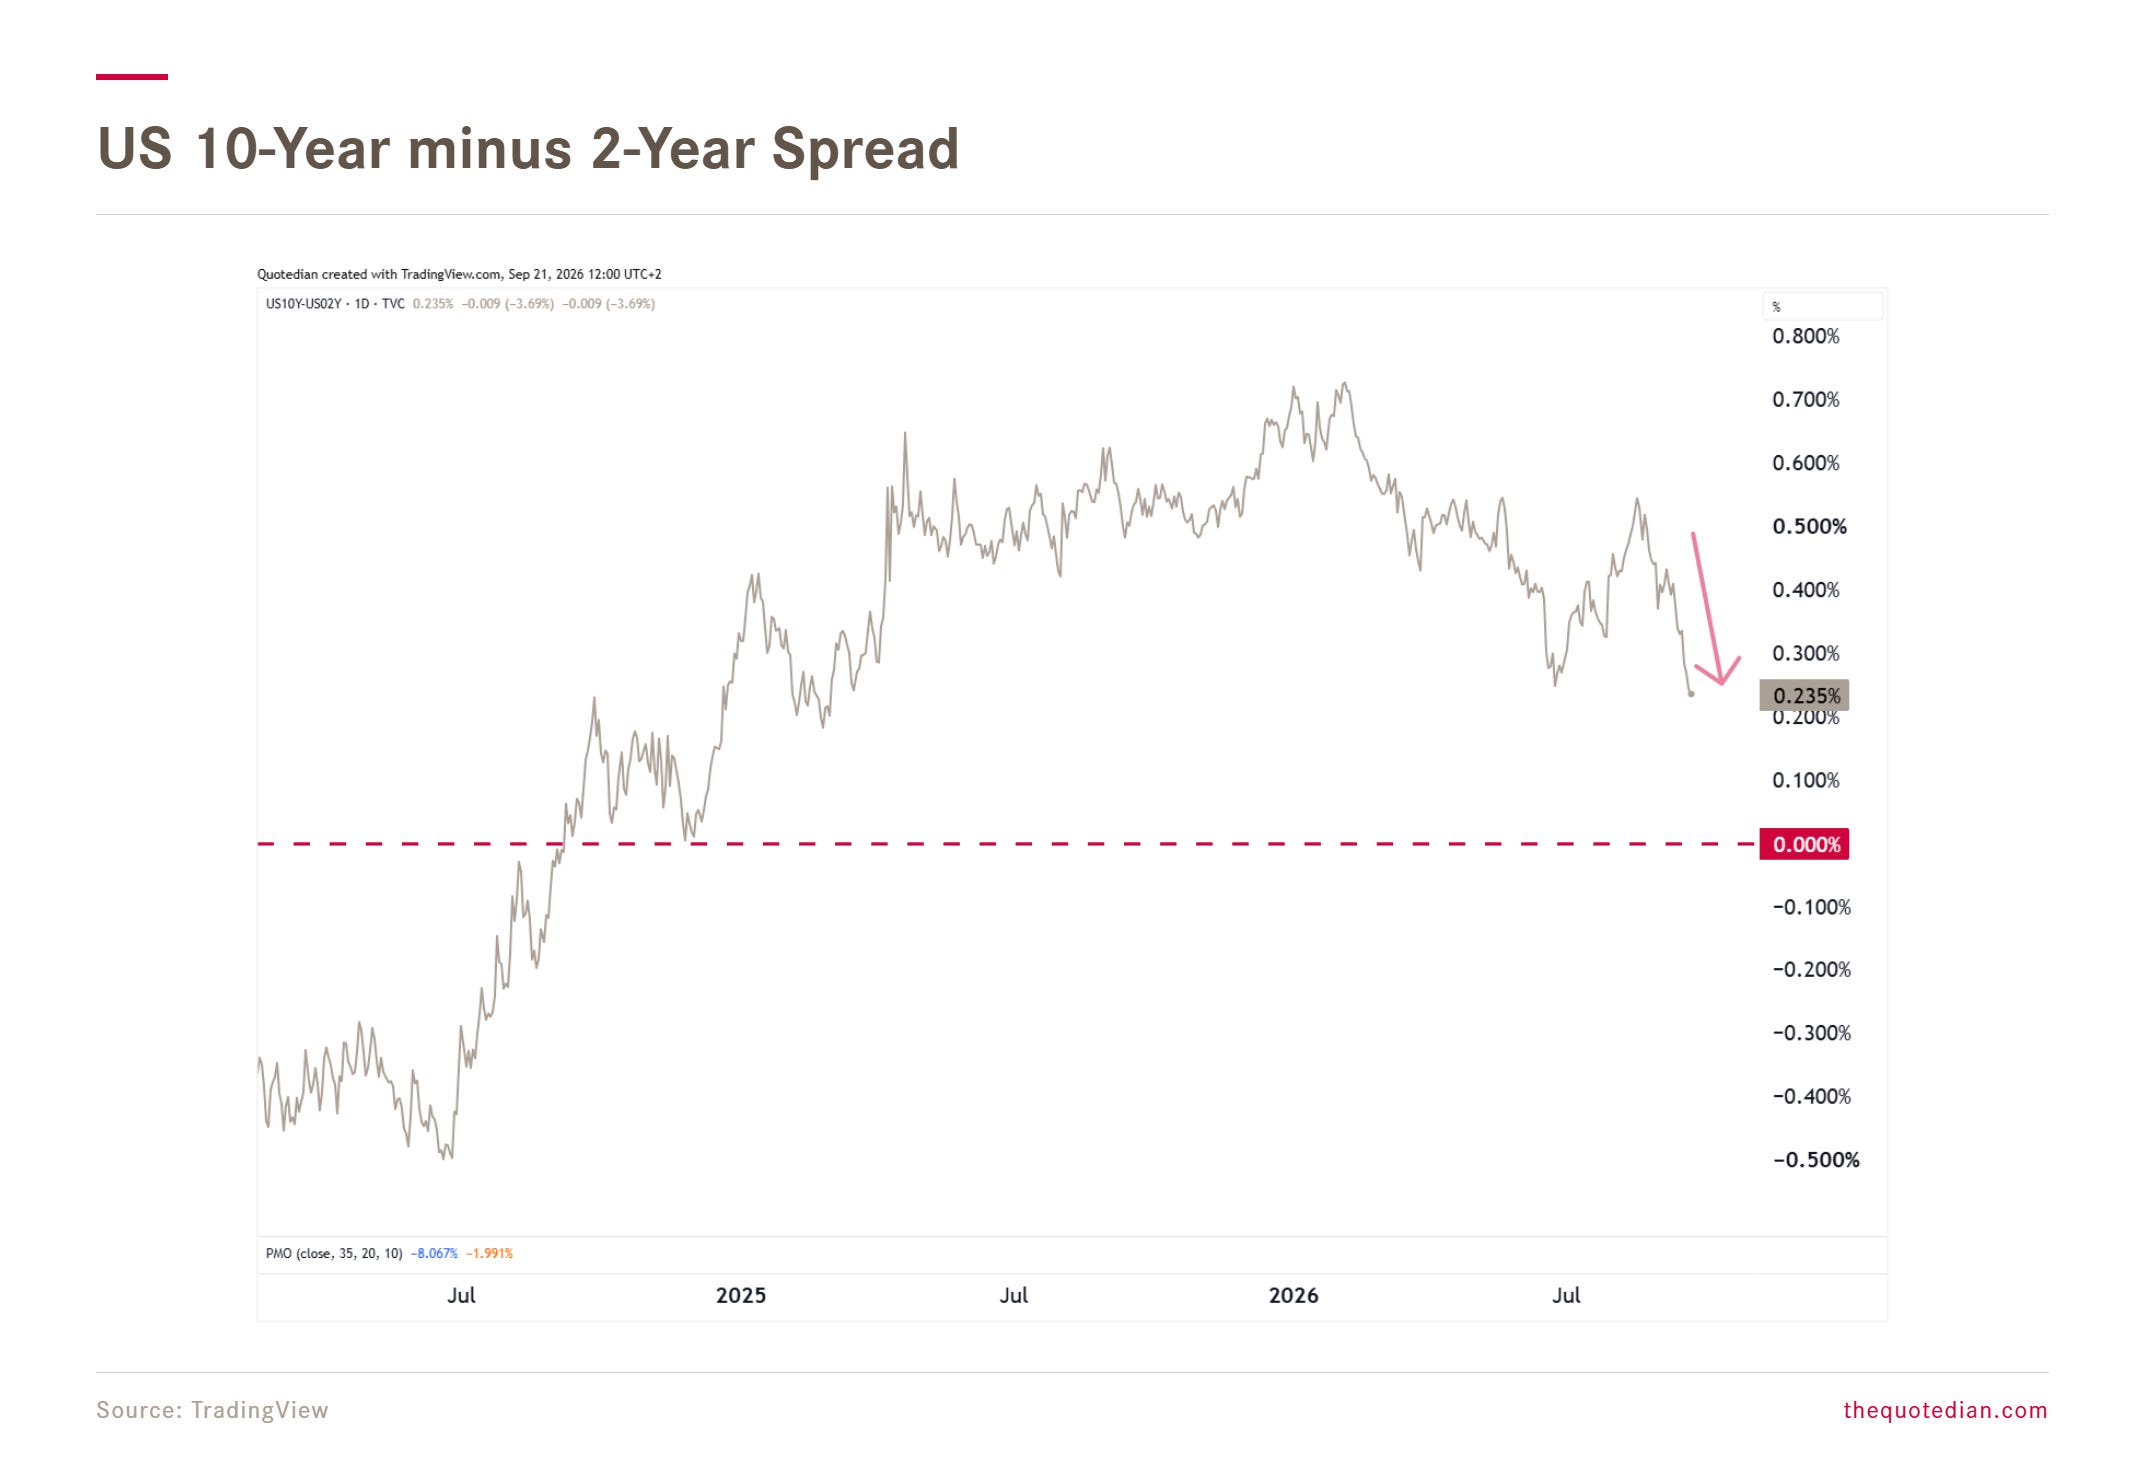
As could be expected, the yield curve flattened further:
The trouble is, if 2-year yields are right, and the Fed will hike another 75 basis points, the yield curve on the previous chart will likely invert, which in turn means an increased possibility for a recession:
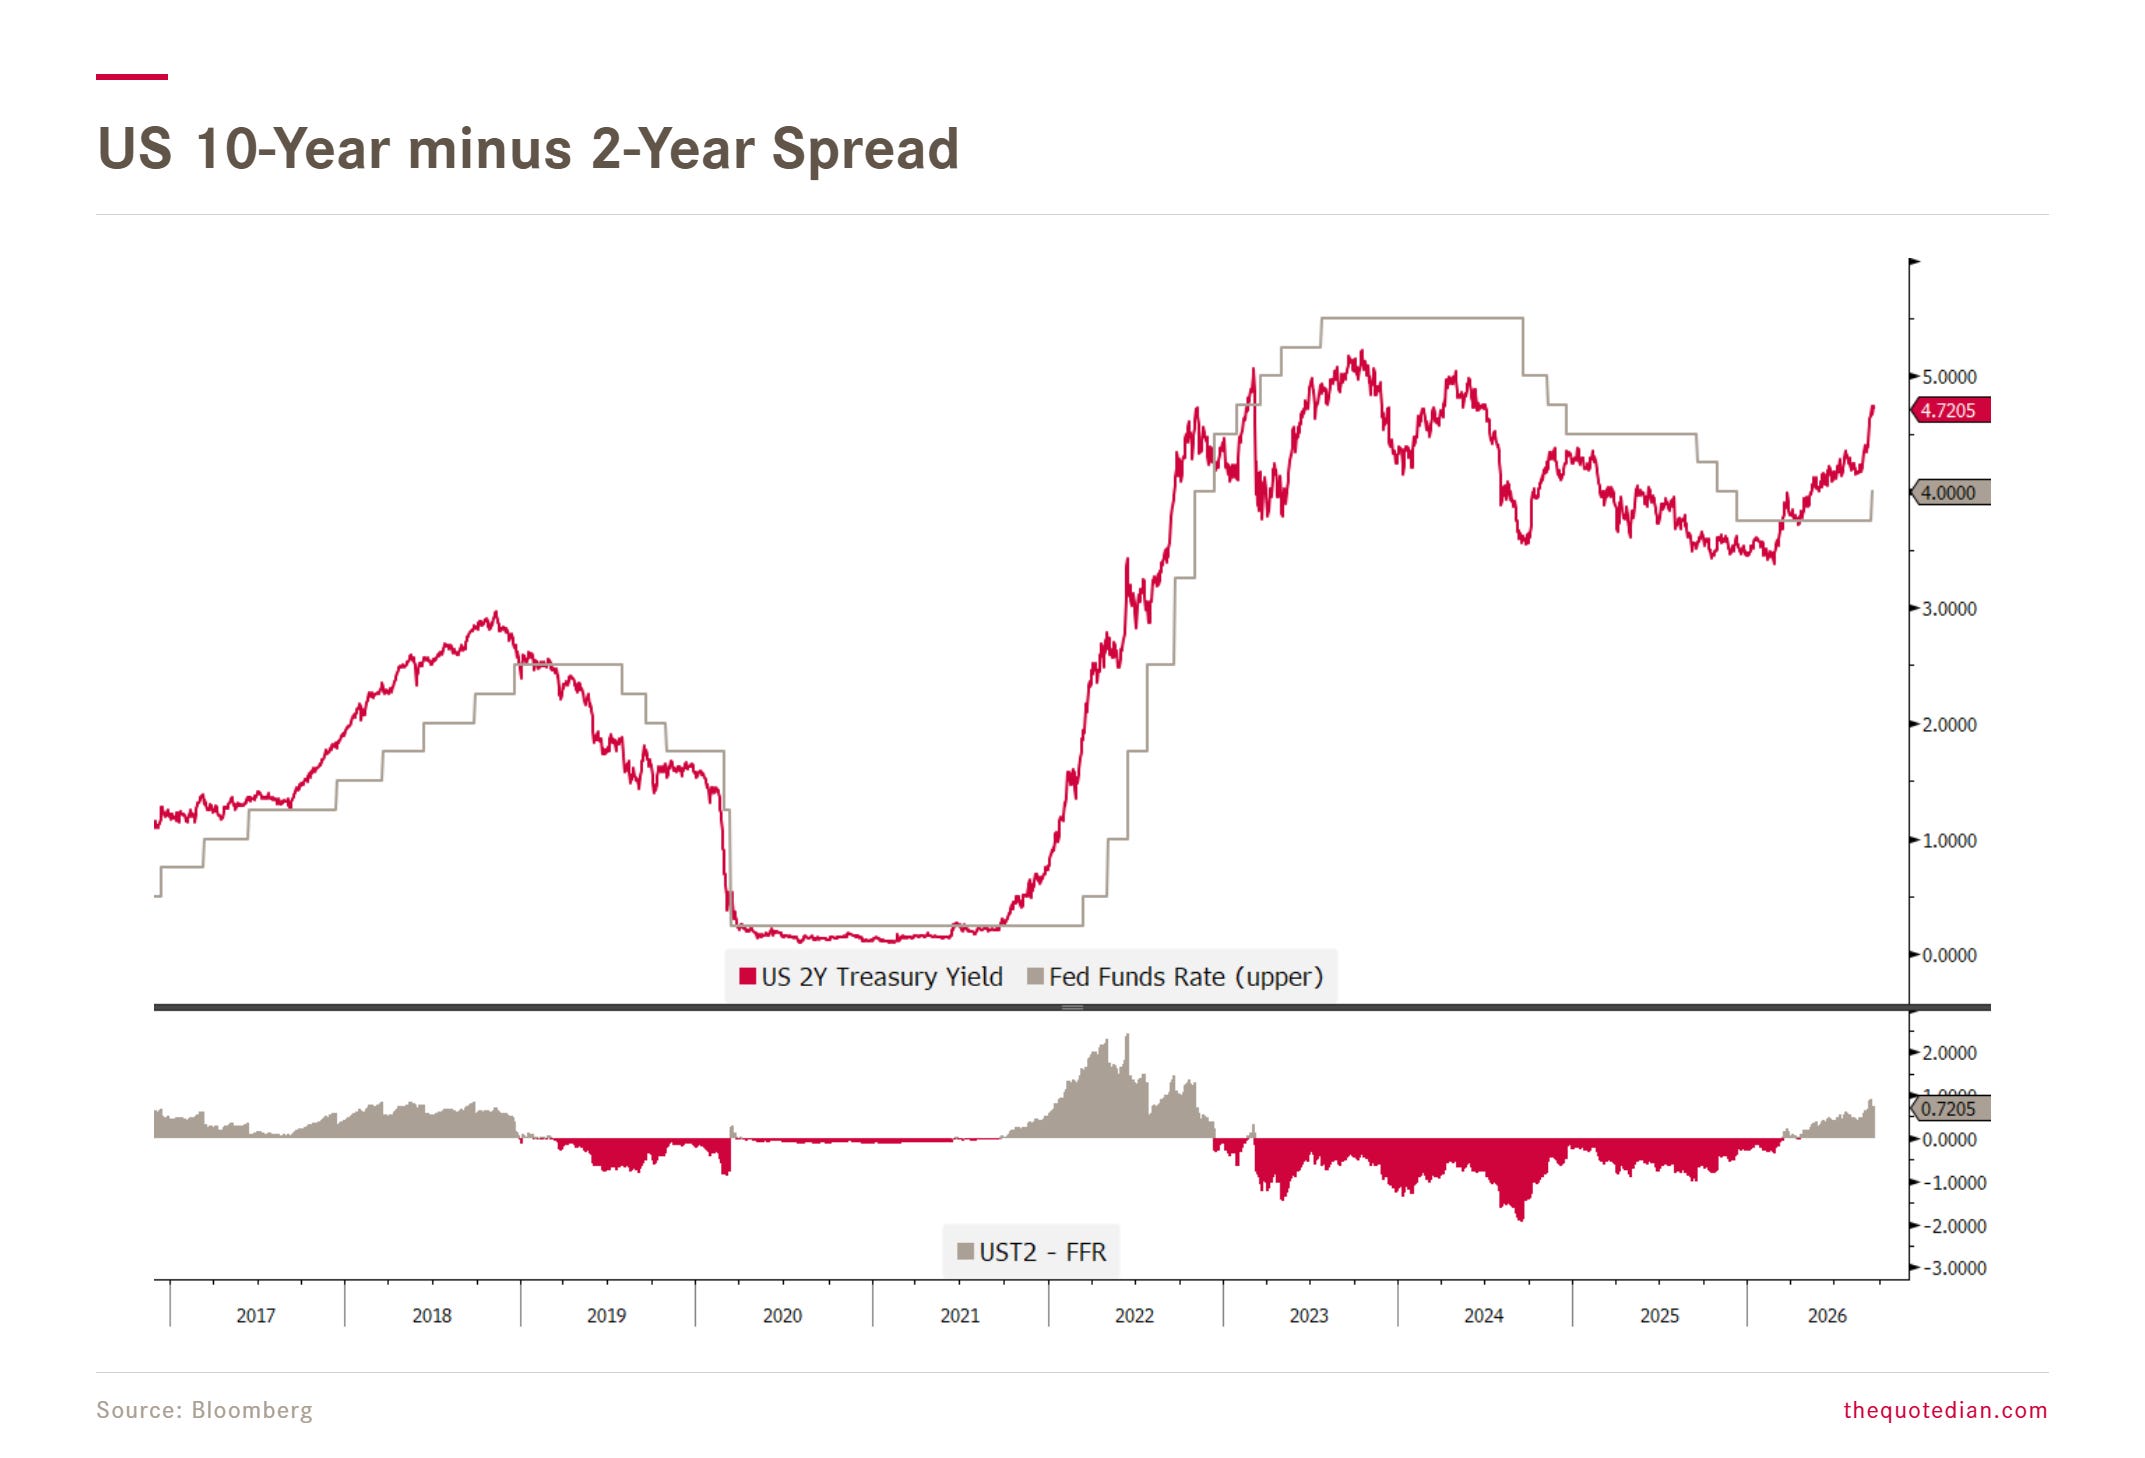
As discussed above, for now, equities are ignoring this … stay tuned however…
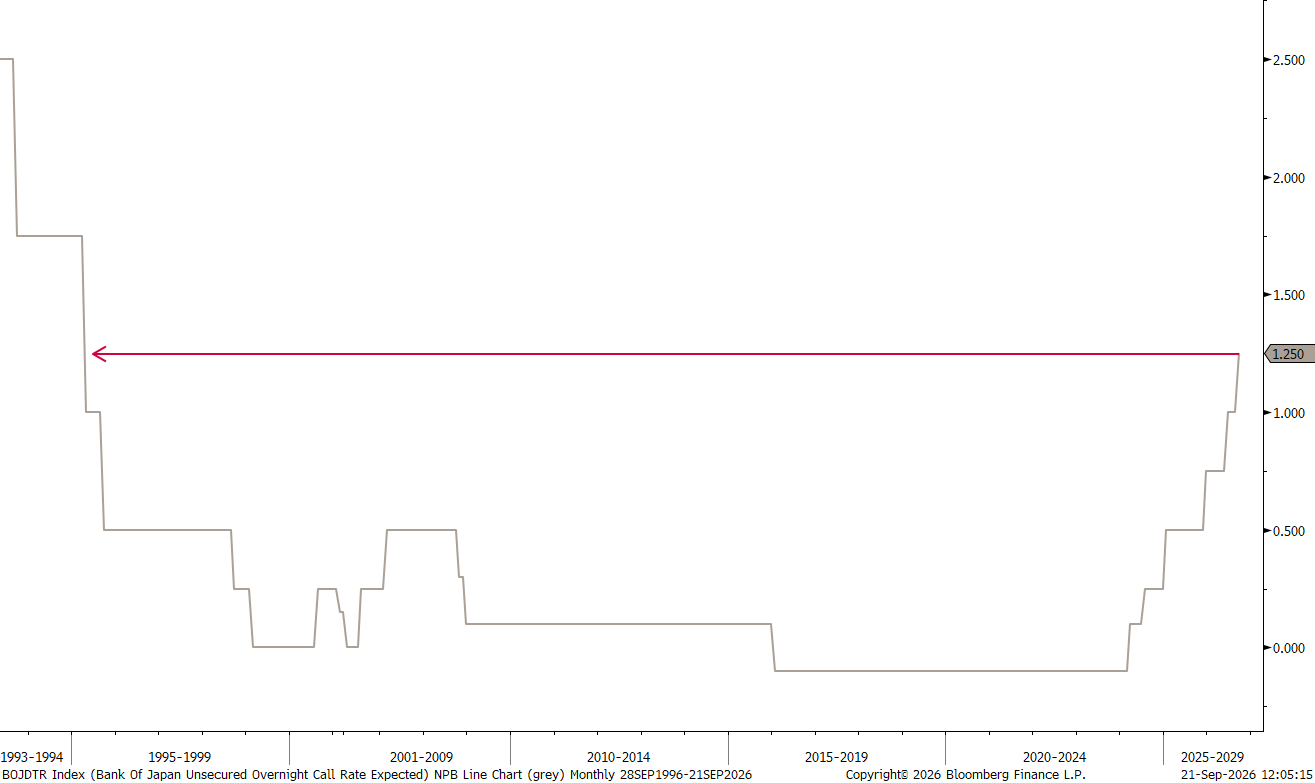
The Bank of Japan was the other major central bank hiking last week (with the ECB having moved the preceding week). The policy rate is as high as it not has been in over 30-years:
However, contrary to the FOMC statement two days before, the BoJ hit a more cautious, nearly dovish rhetoric.
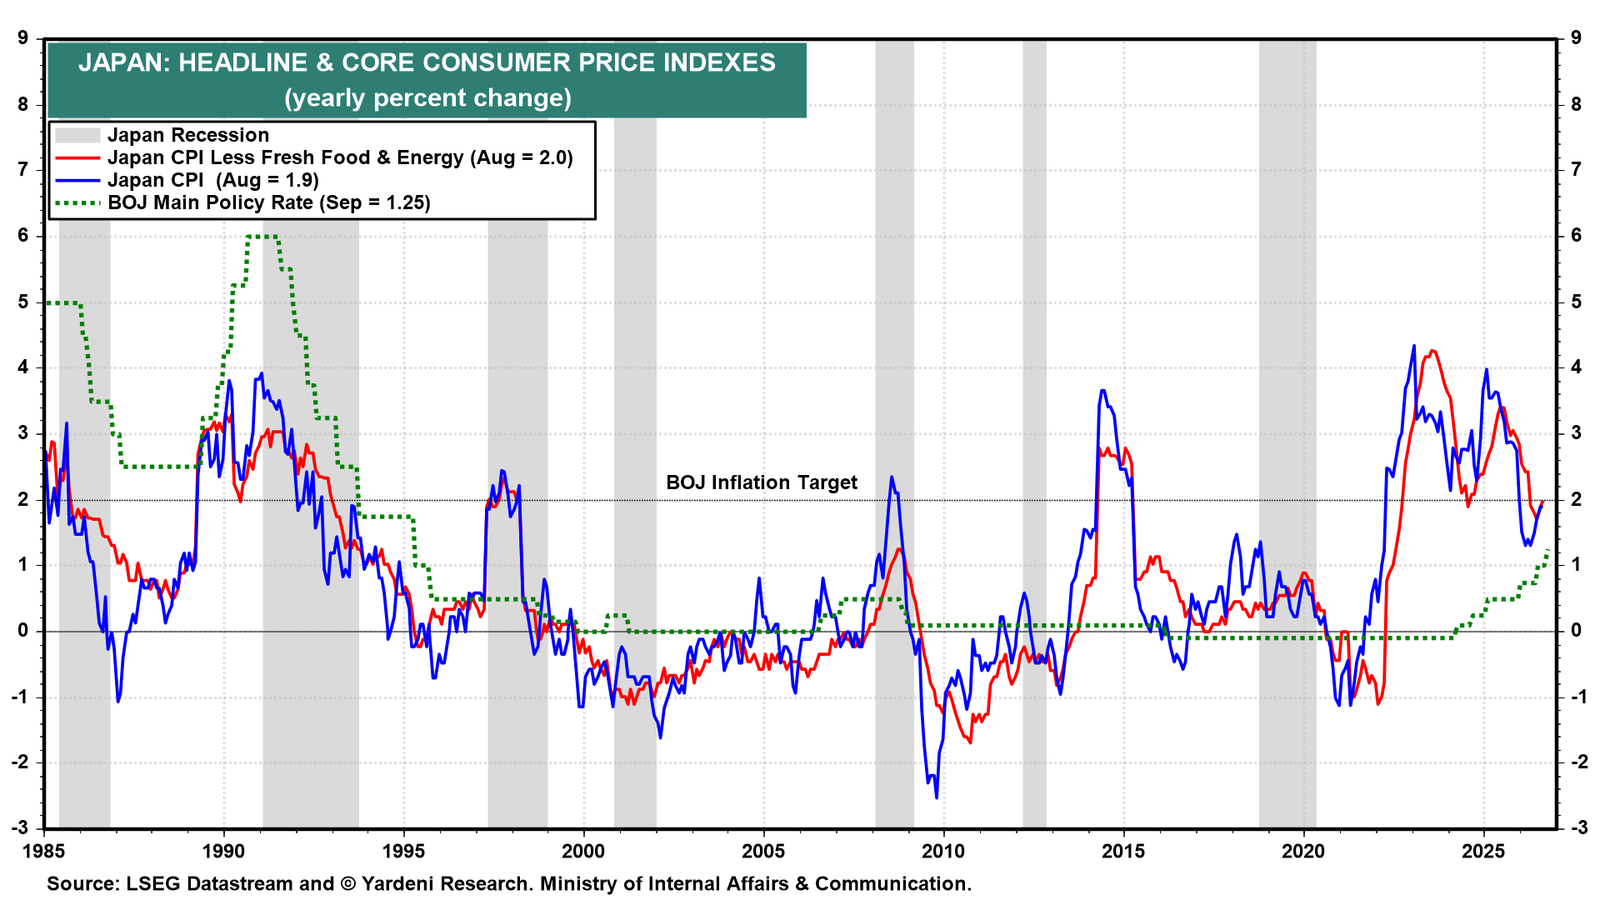
The inflation data explain the caution. Headline CPI was 1.9% y/y in August, with the core rate at 2.0%, while the PPI was 7.6% (chart). The BOJ is tightening in response to a cost shock, not a demand boom:
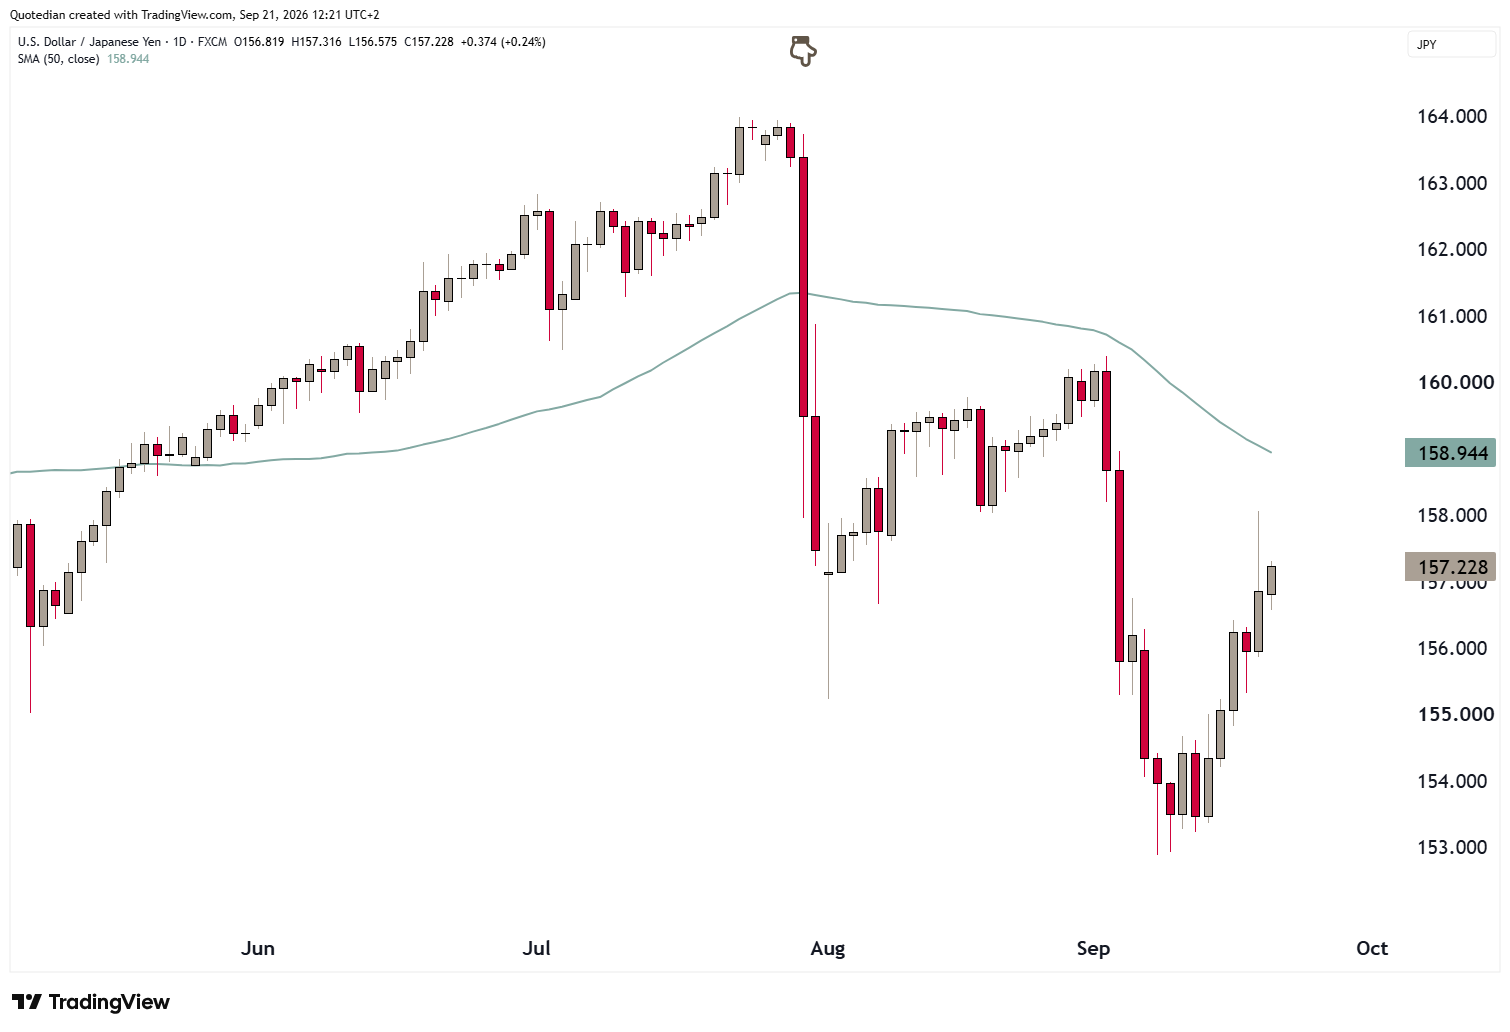
Amid the hawkish Fed and the more dovish BoJ, the JPY has stopped rising (falling USD/JPY) versus the Greenback:
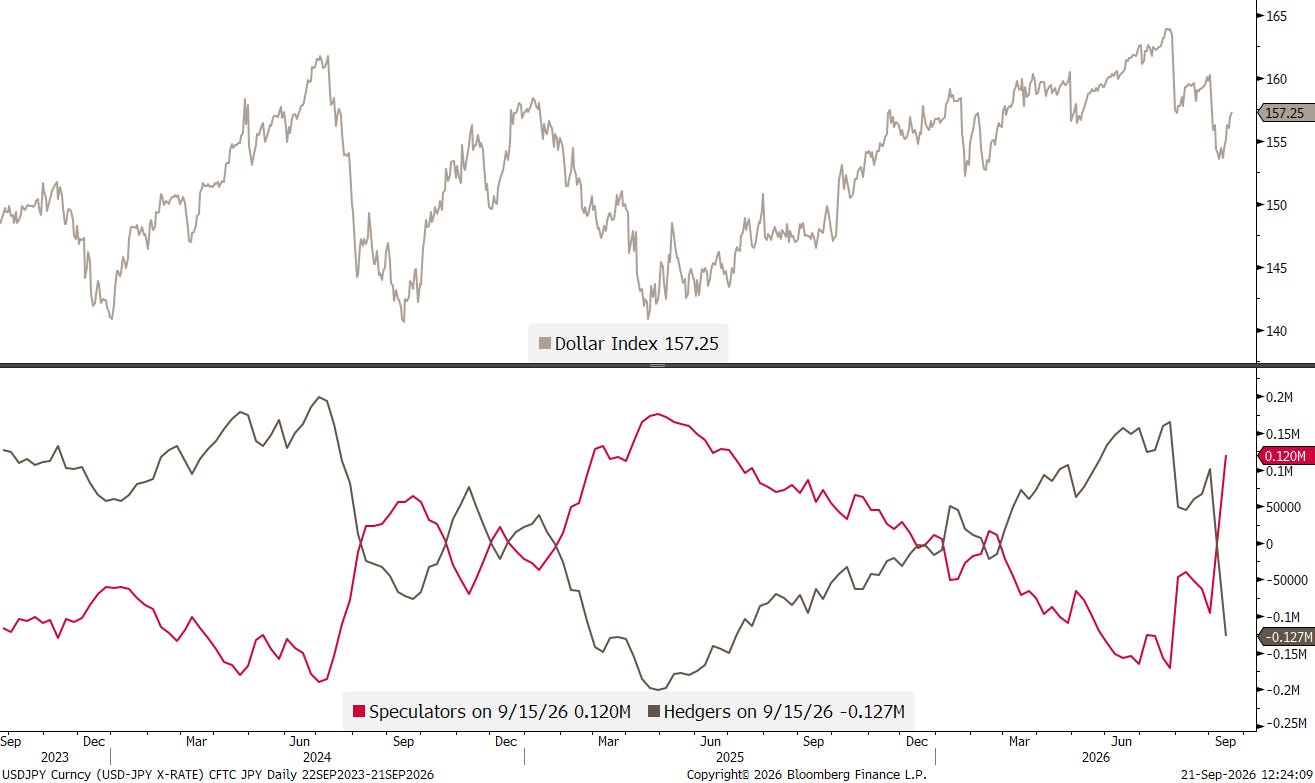
Also not helping the JPY, is that speculators (bottom clip, red line) are suddenly very long the currency of the land of the rising sun, which should be interpreted as a contrarian negative sign:
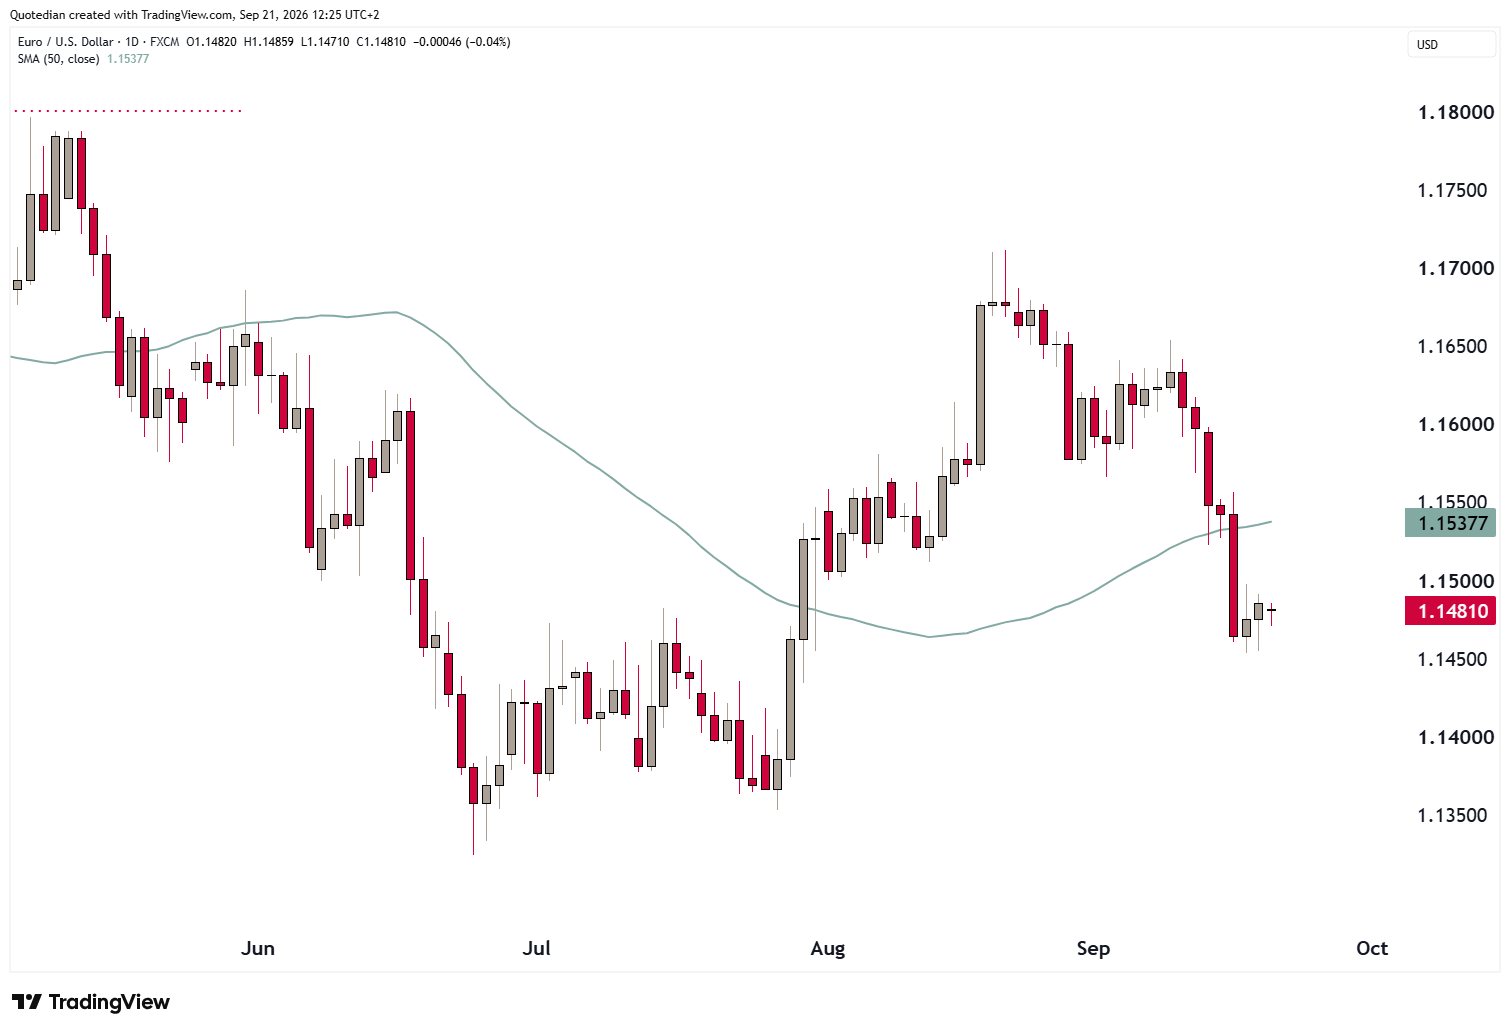
The EUR/USD is recovering from a steep sell-off over the past two weeks:
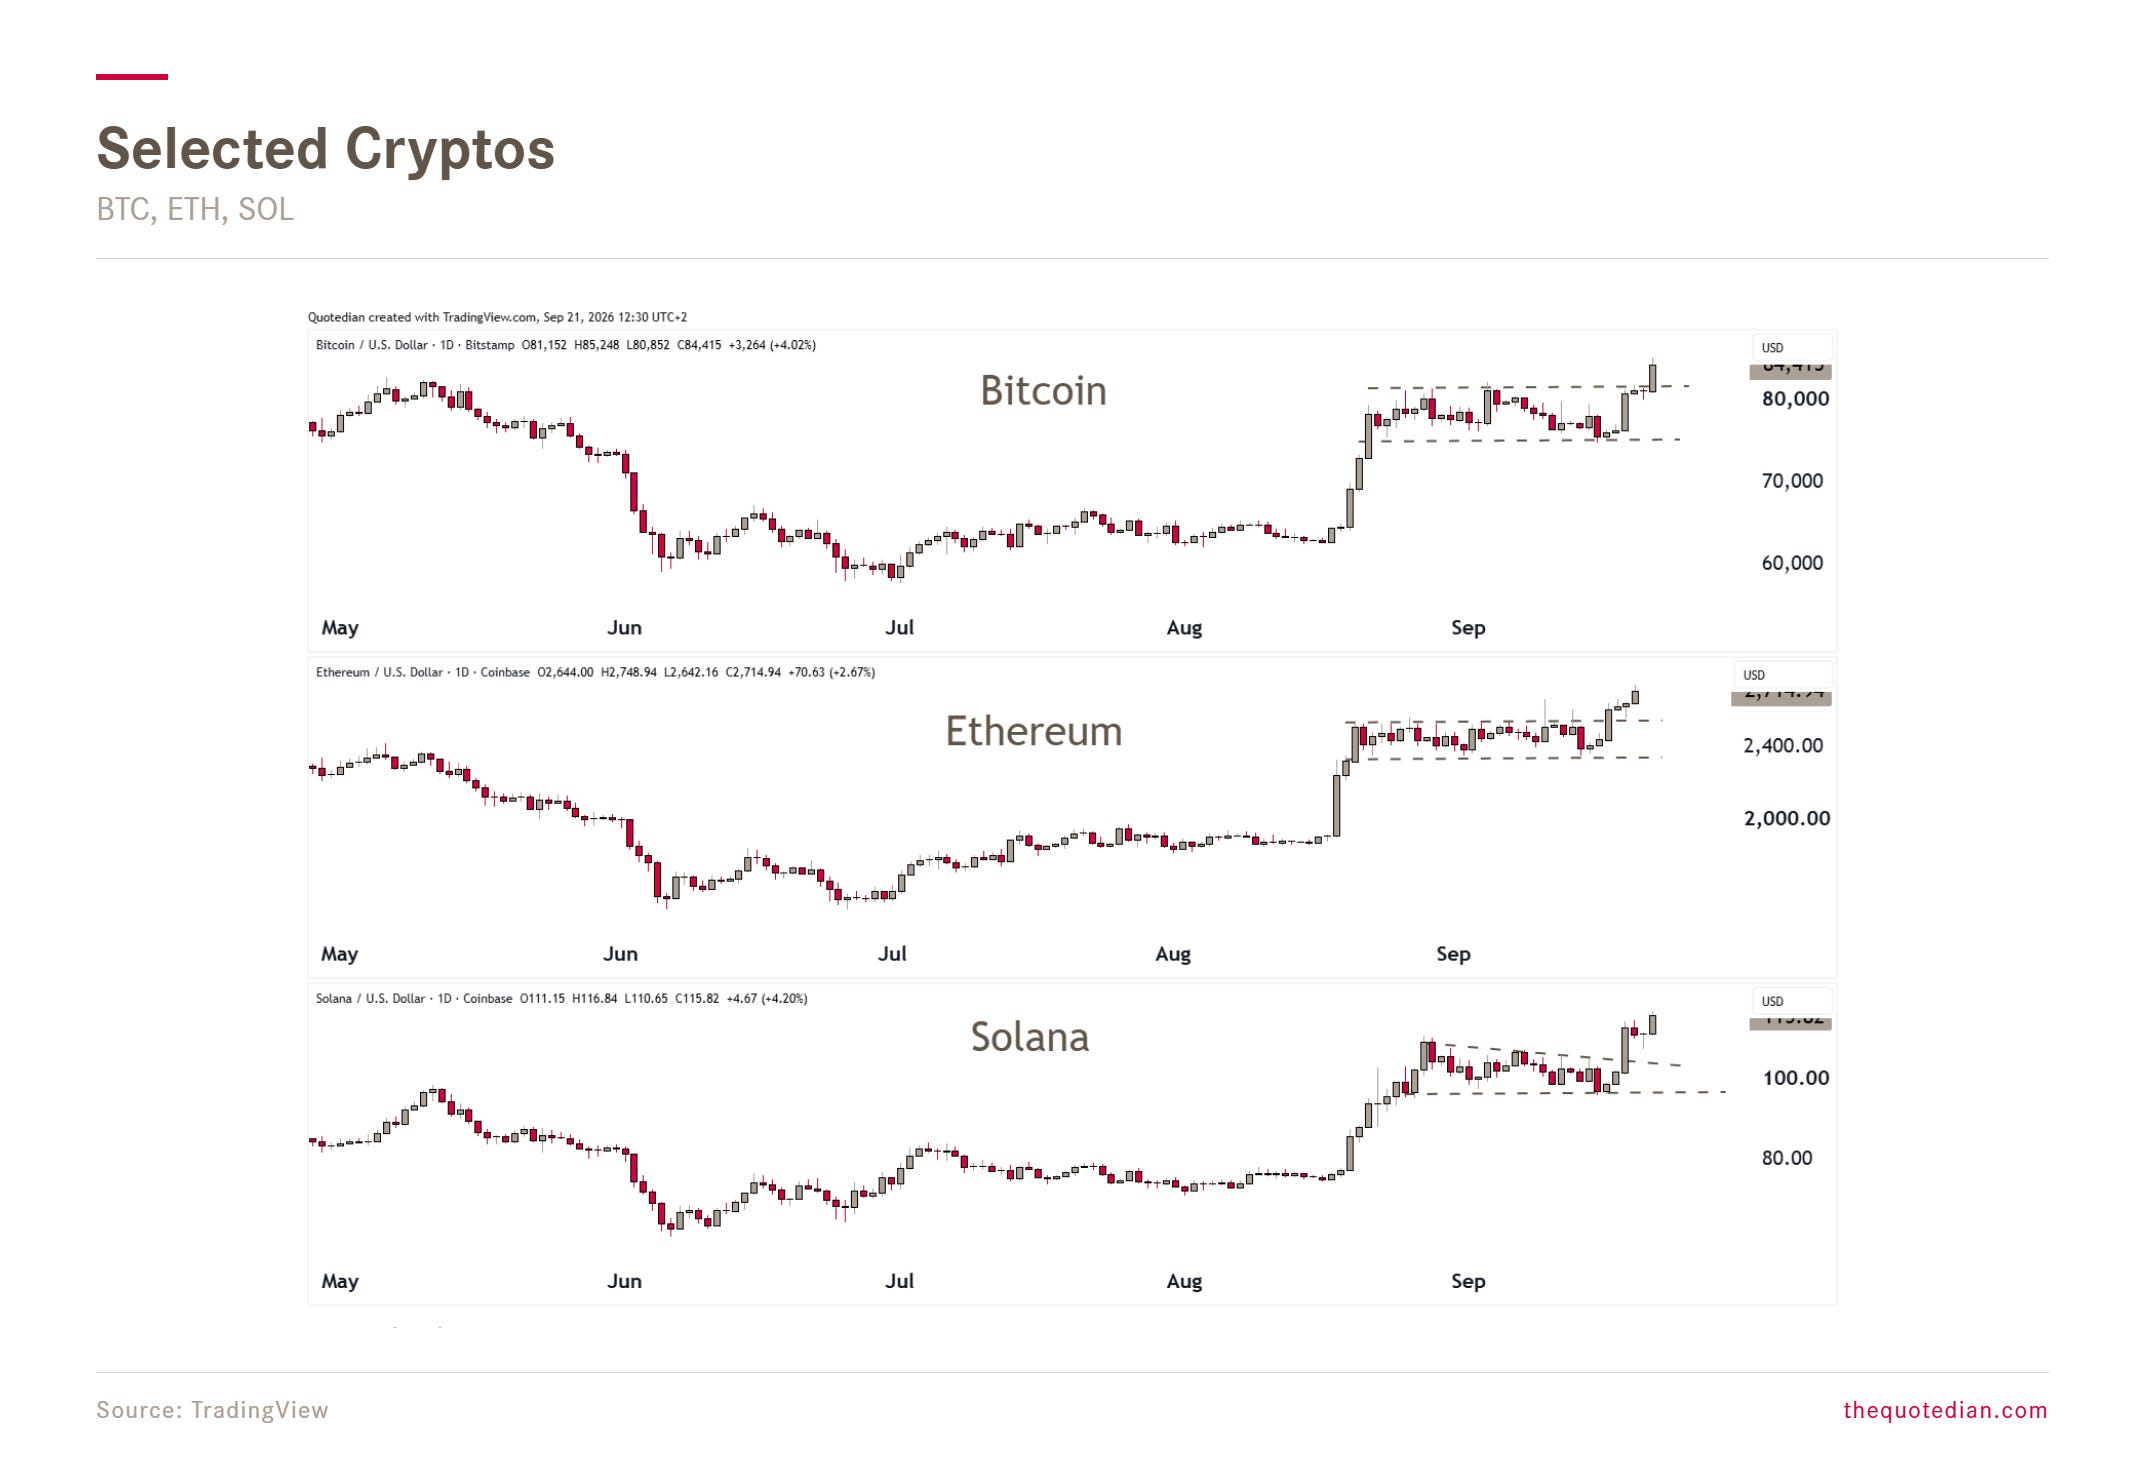
In cryptocurrency wonderland, the breakout after a consolidation period is happening:
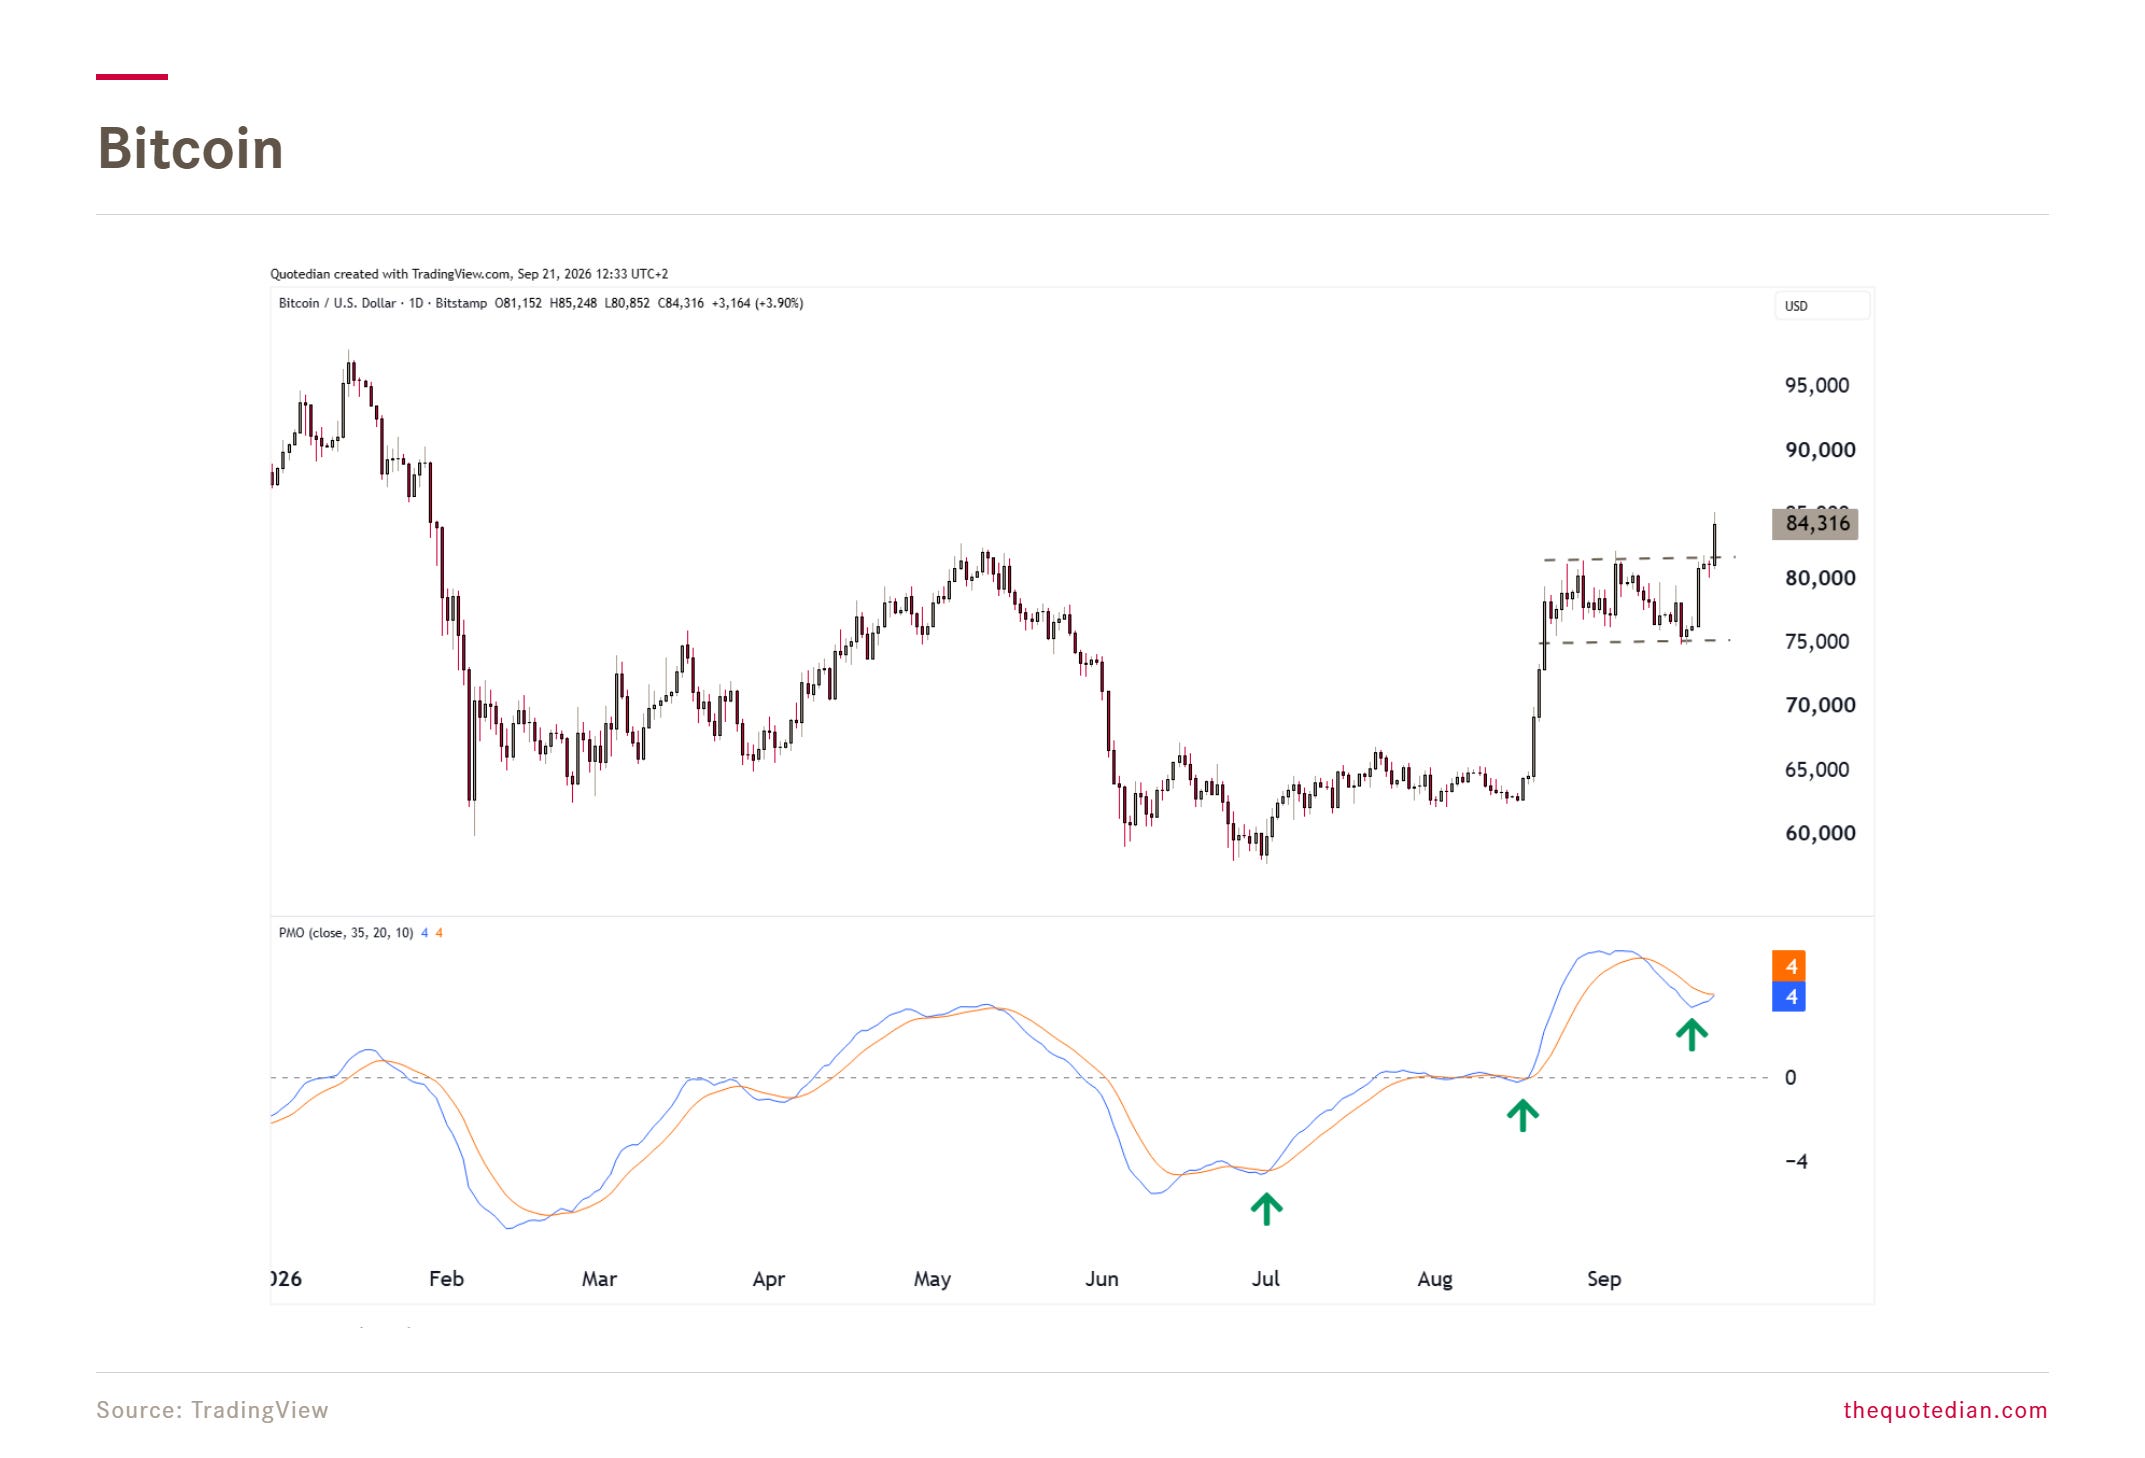
I would stay long here:
A quick revisit of our “highest real rates in decades”-theme from further up. Gold, which has no cash flow (coupon, dividend, etc) attached to it has for obvious reasons suffered under higher real rates (inverted below):
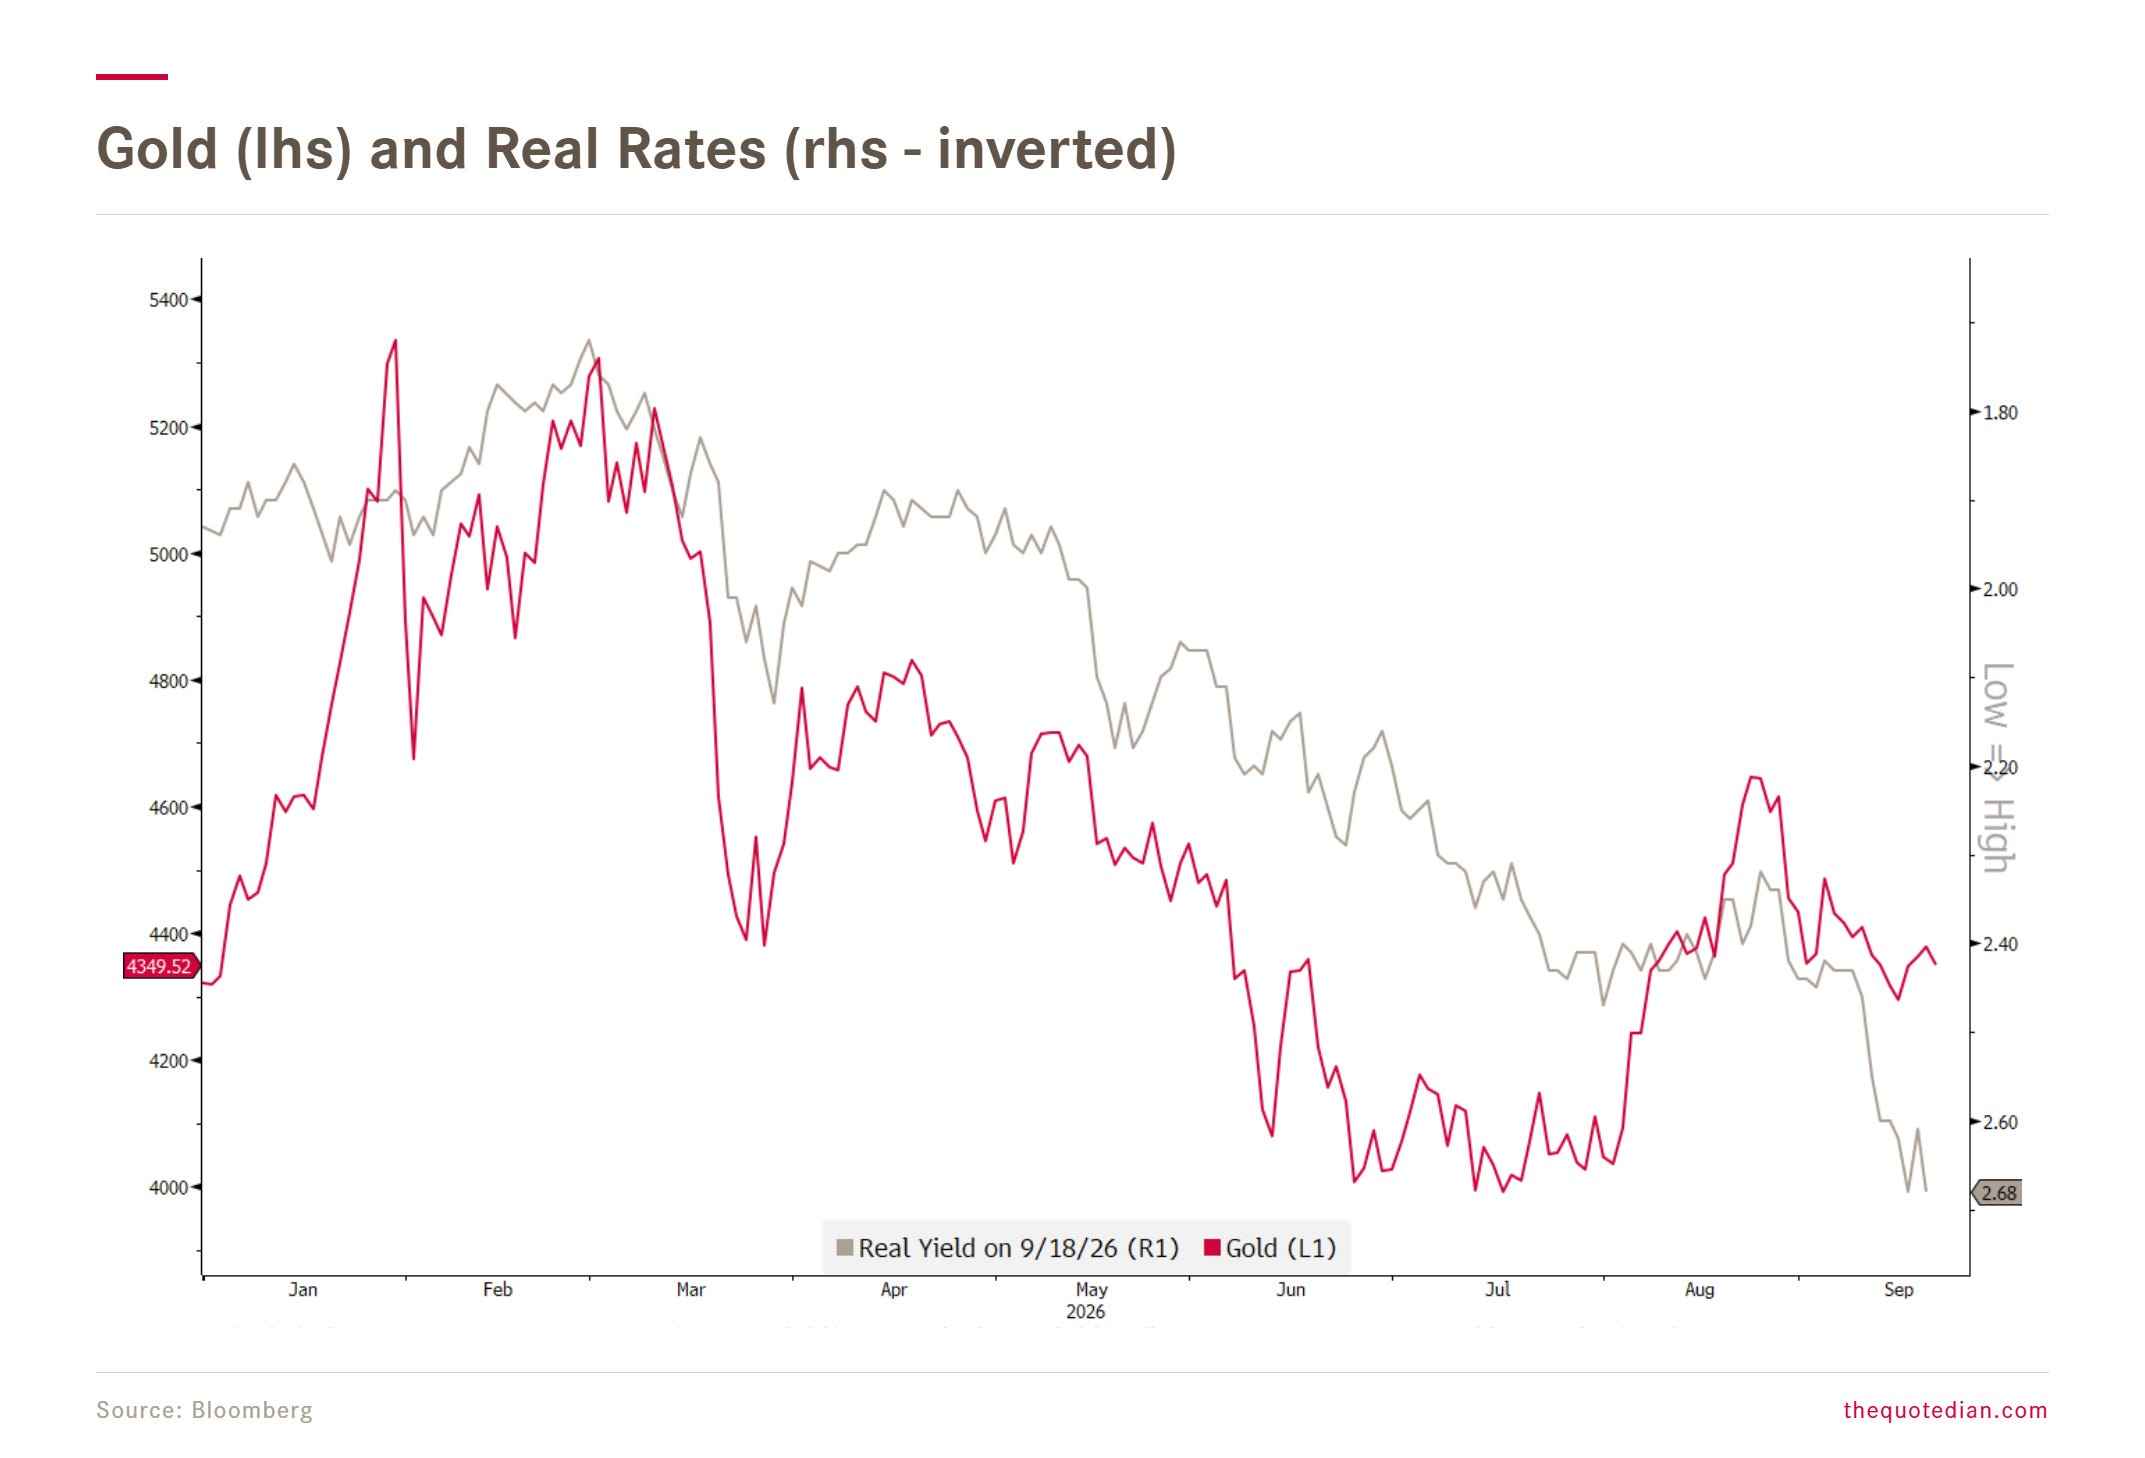
However, given that real rates are as high as they are, gold has fought a further price decline bravely, and may be setting up for a break higher as the former are likely to plateau out and eventually reverse lower:
I continue to be very bullish on Copper, where the long-term chart suggests more upside:
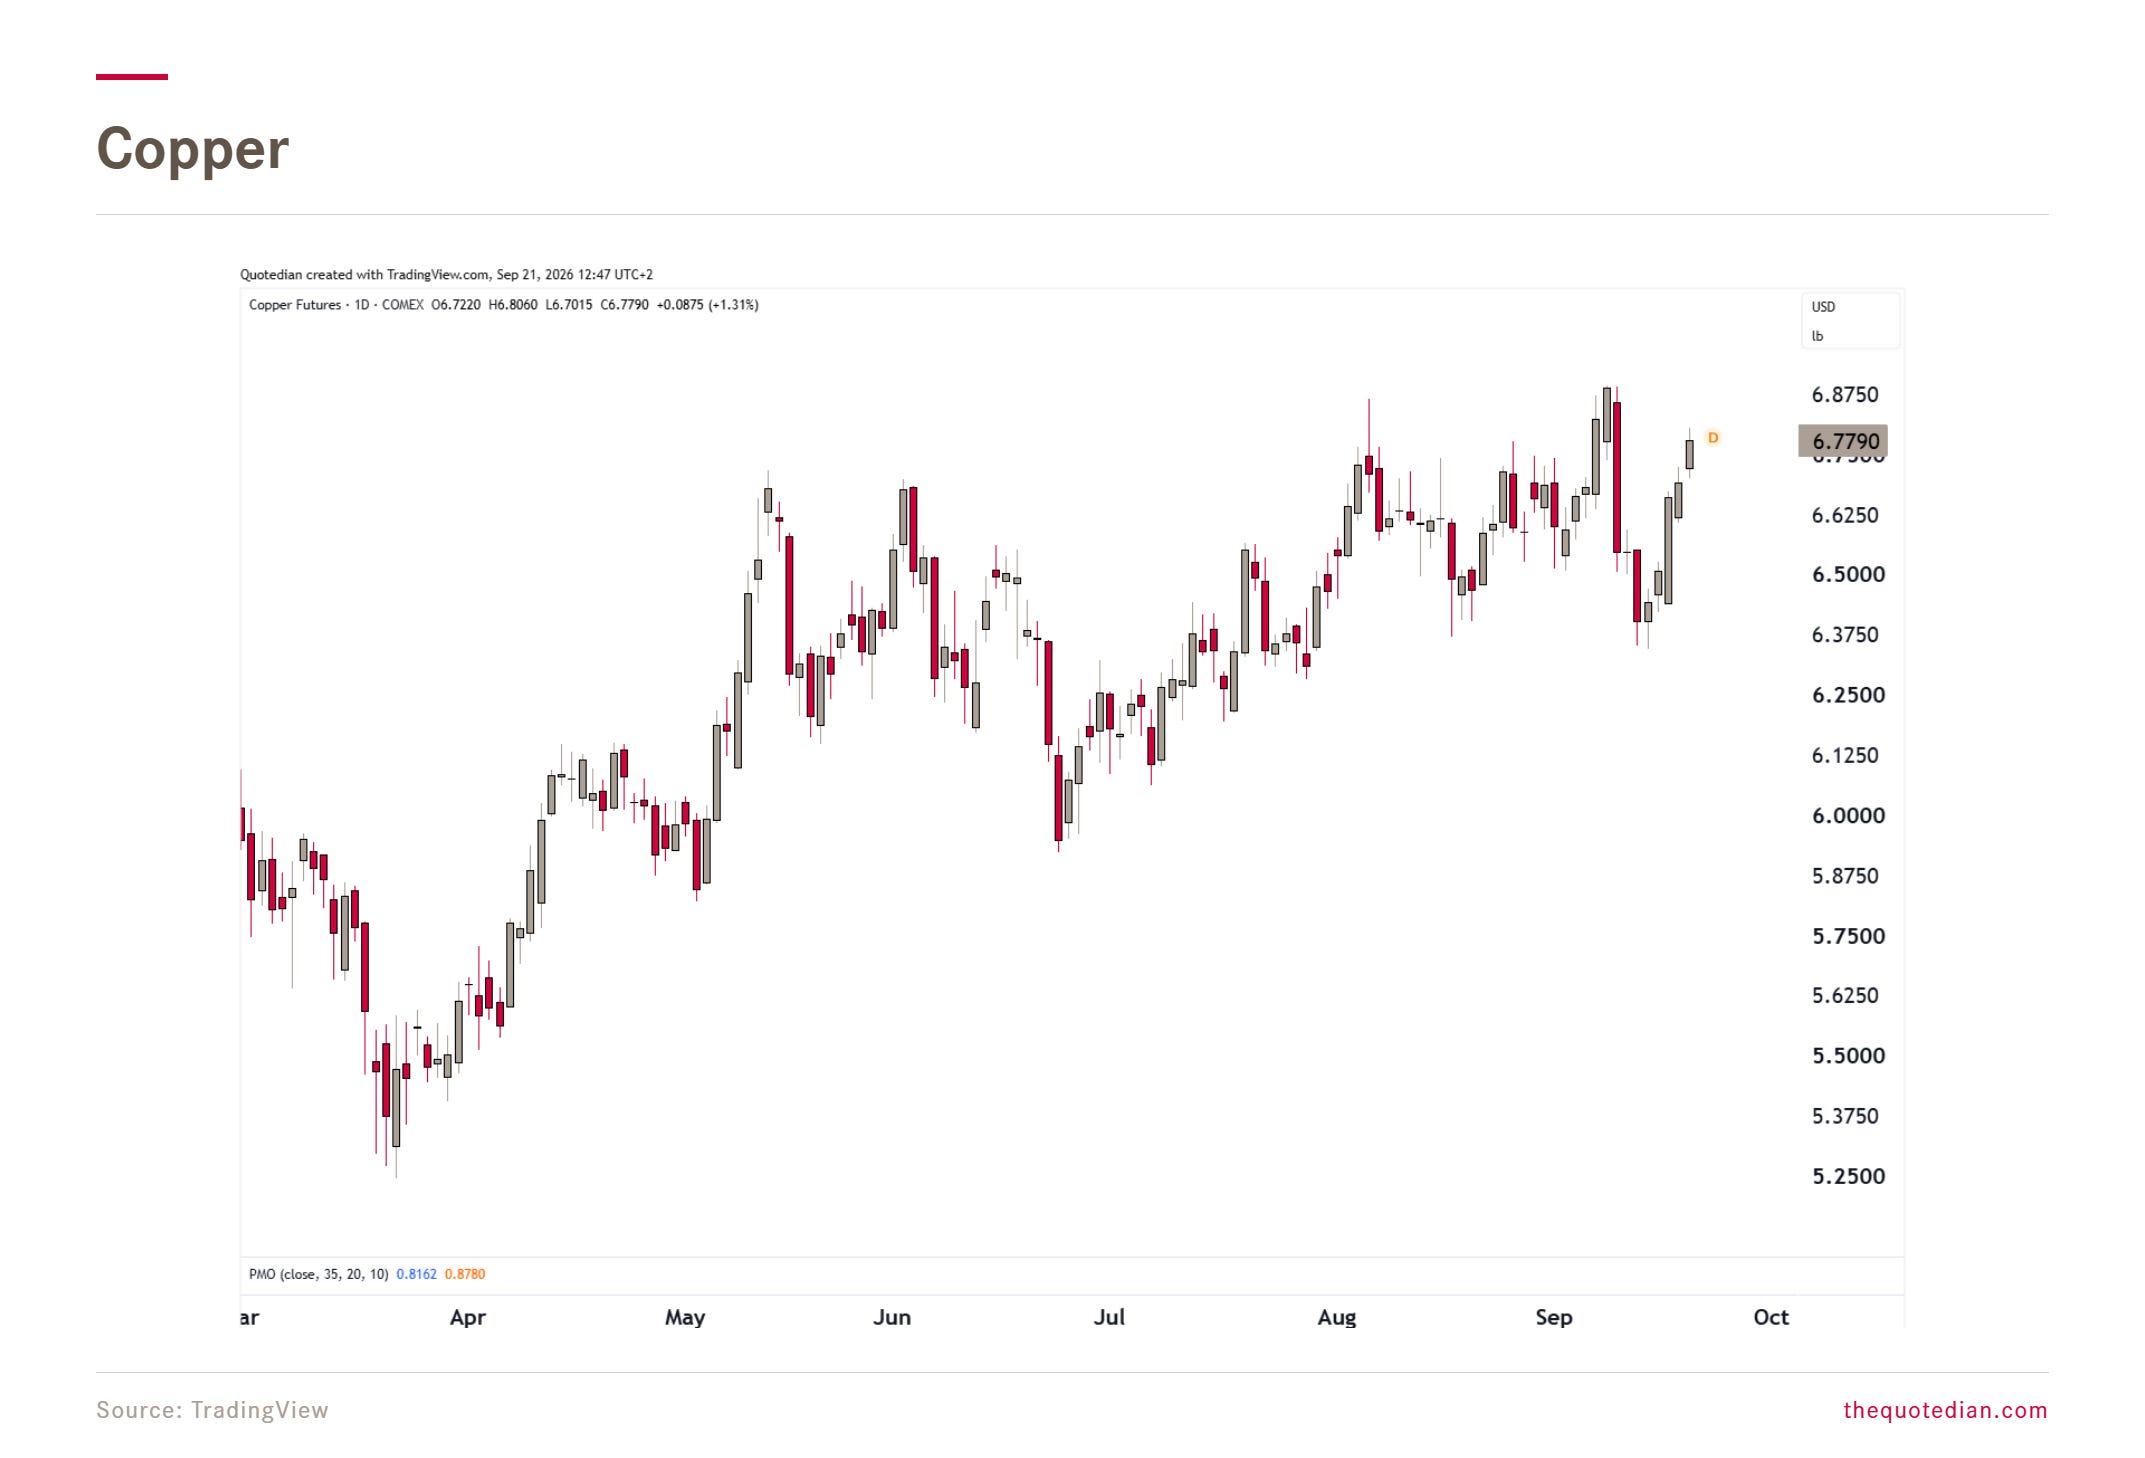
A bullish constellation that is also confirmed when zooming in on the daily chart:
To me, there’s a clear supply shock in copper, if inventories (lower clip) at the LME are a proxy for global ‘reserves’:
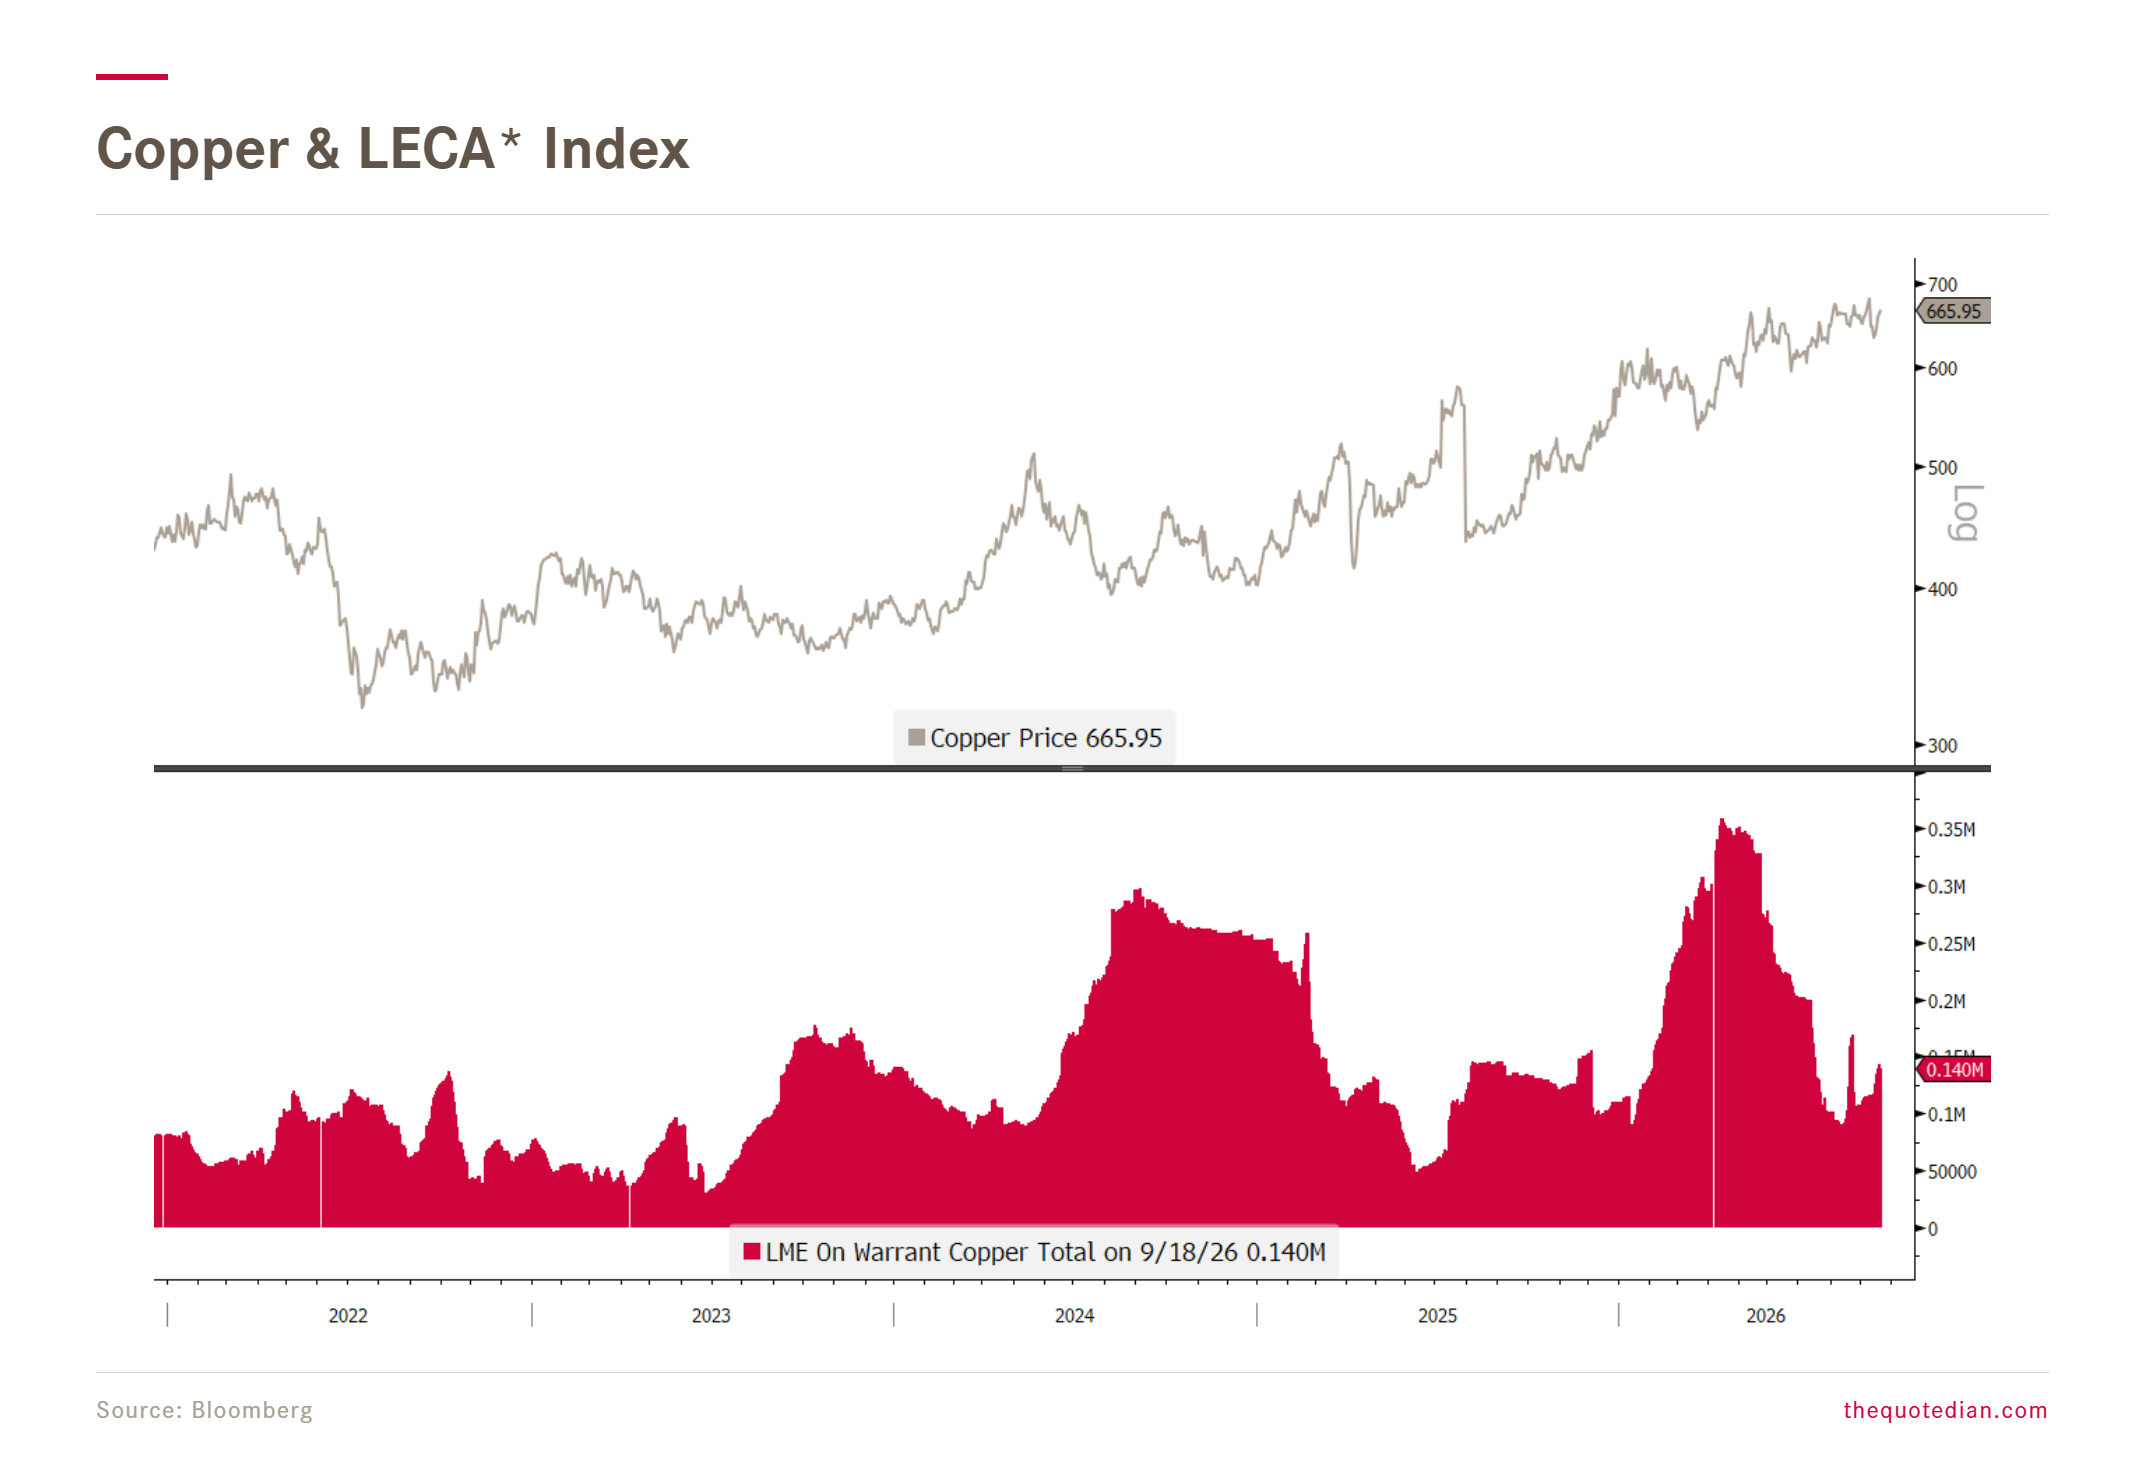
* The LECA index tracks the total amount of copper held in LME-registered warehouses that is available for delivery — i.e., copper that is "on warrant" (not already earmarked for cancellation or physical delivery). It serves as a key indicator of LME copper inventory levels and is widely watched by commodity traders and analysts as a gauge of physical copper supply and demand dynamics.
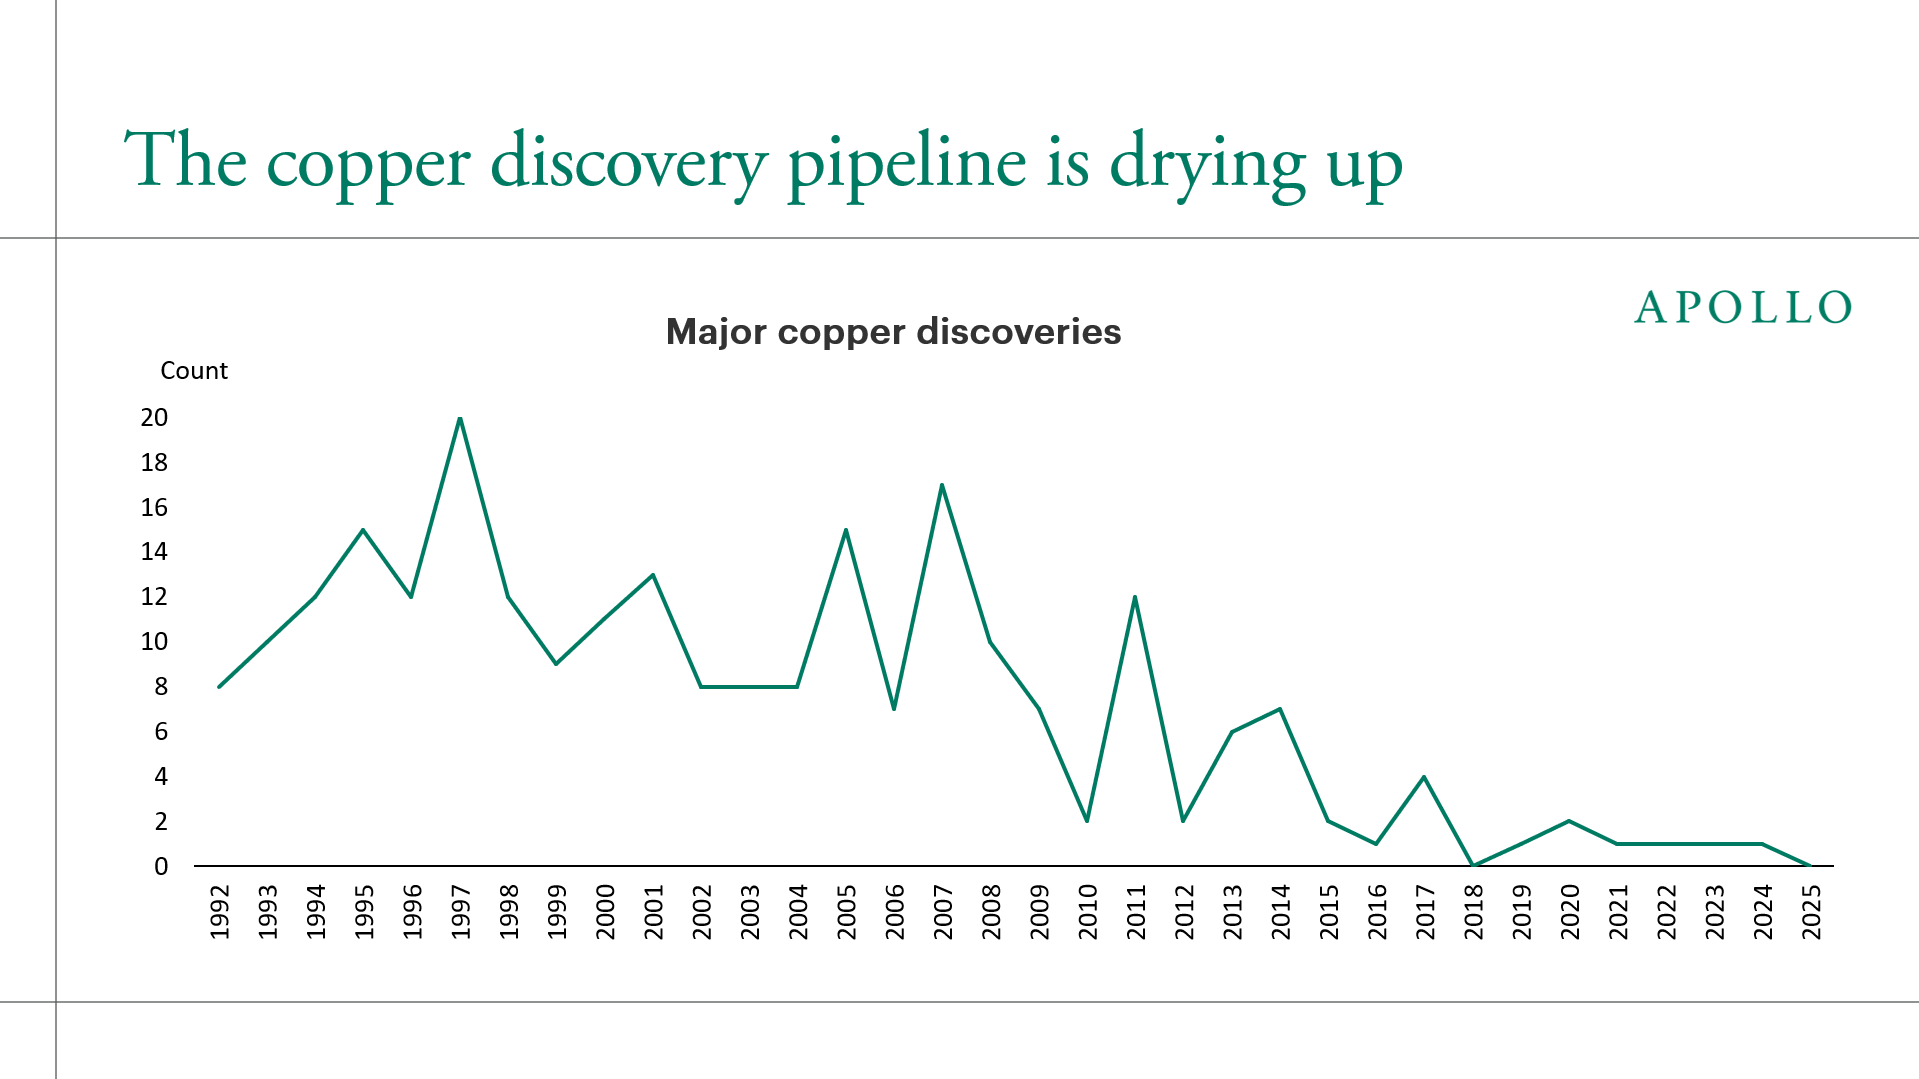
Also, there is a massive mismatch between the needs for copper by AI now and the roll-out of new copper mines not happening for years.

Let’s get one thing out of the way: 5% on a Treasury does not make equities uninvestable. And no, bonds haven’t turned risk-free either. Anyone who held duration over the past few years still has the bruises to prove it.
What has changed is the hurdle rate. For the first time in a long while, you can lock in a proper return after inflation without praying for higher multiples or another rescue from the central bank. TINA, meet the competition.
That shifts the allocation maths. Equities can keep climbing, and so far they seem strangely relaxed about higher real yields. But from here on they have to earn their seat at the table. So does everything else. By the textbook, gold should be struggling with real yields this high. It isn’t. Copper doesn’t care about the textbook at all, because its problem is that the world wants the metal faster than anyone can dig it out. Both have a case. The difference is that every case now gets measured against roughly 3% real, paid to you for taking very little risk.
Which makes the dull corner of the portfolio rather less dull.
TIARA (There Is A Real Alternative) has entered the building.
May the Trend be with You!
André

Everything in this document is for educational purposes only (FEPO)
Nothing in this document should be considered investment advice
Investing real money can be costly; don’t do stupid shit
Leave politics at the door—markets don’t care.
Past performance is hopefully no indication of future performance
The views expressed in this document may differ from the views published by NPB Neue Privat Bank AG