Risk-Off!
The Quotedian - Vol V, Issue 111
“It’s déjà vu all over again.”
— Yogi Berra
DASHBOARD
AGENDA
CROSS-ASSET DELIBERATIONS
Today’s title of The Quotedian does vary by one symbol only to yesterday, but that is enough to confirm today, what yesterday was still a question. In all fairness to ourselves, we already stipulated last Wednesday in the piece, “When you can, not when you have to”, that it may be a got time to buy protections and/or reduce risk. I encourage you to re-read the piece by clicking on this link, but here’s the gist anyway:
In this very conflicting picture, the investment advice is very clear:
Buy protection when you can, not when you have to
Ok, not everyone can buy protection, so let’s be a bit more specific:
If you are a trader, be tactical and large in cash
If you are benchmarked, be neutral
If you are an absolute return investor, overweight cash/short-dated bonds
If you can hedge, hedge (partially)
If you can hold options, seek upside exposure via such optionality
For example, equity volatility, as measured by the CBOE S&P 500 Volatility index, or simply VIX, was still to be had below 20 last week, now 20% higher at close to 24:
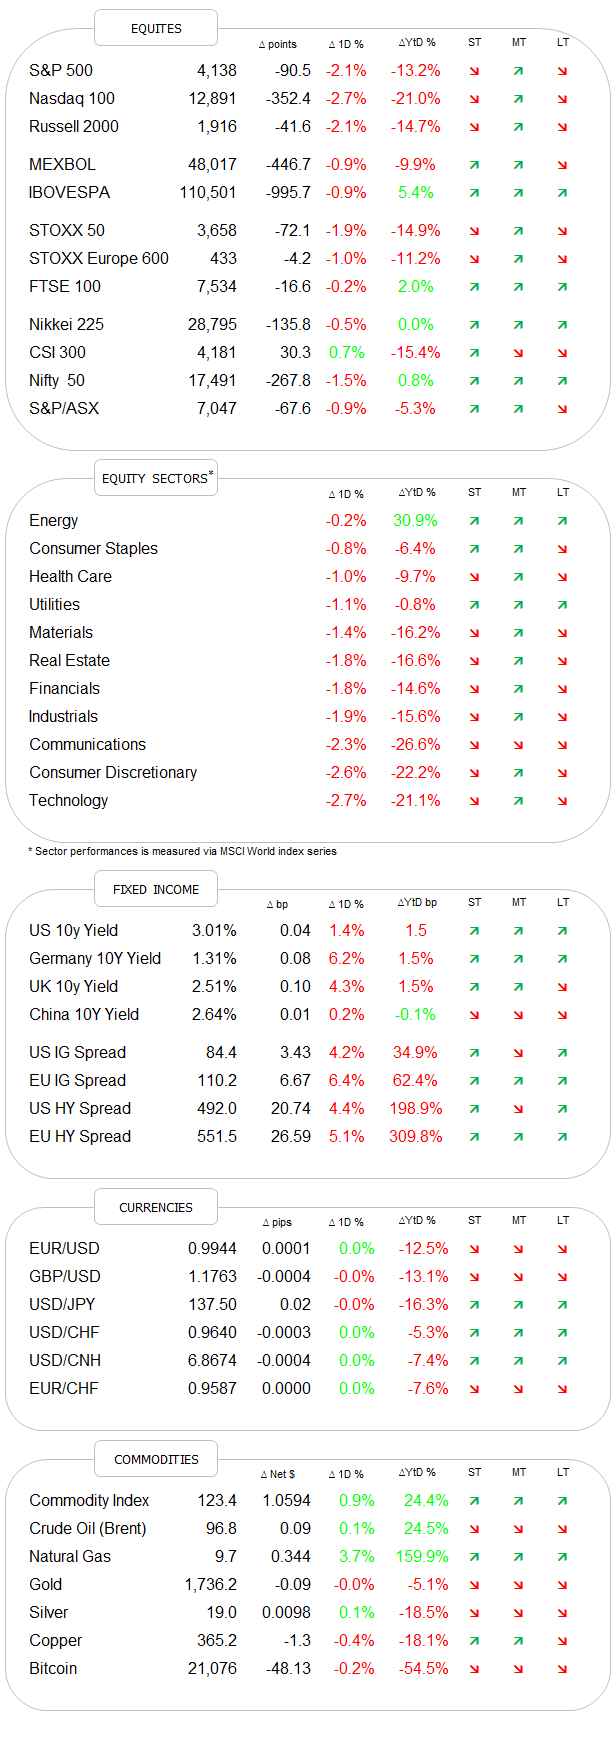
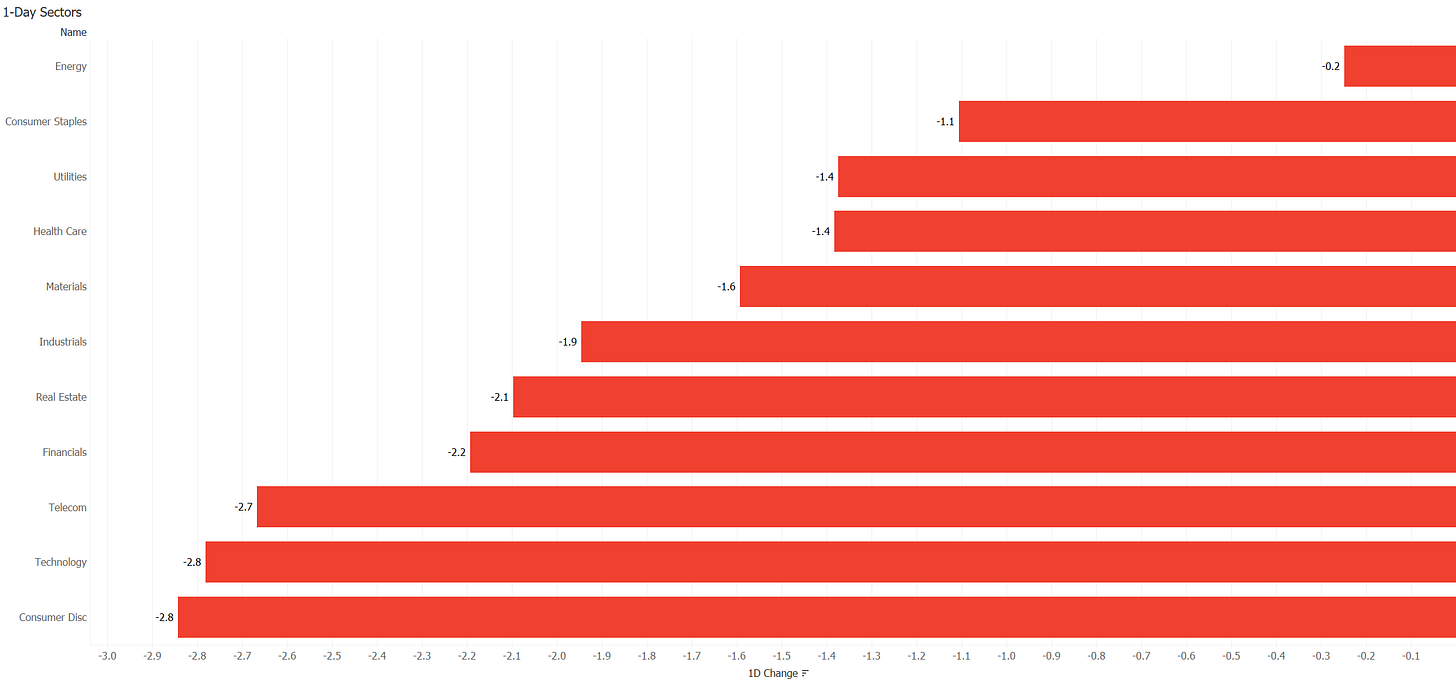
Ok, let’s start picking yesterday’s challenging session apart, starting with equities, which dropped around the globe. Major European and US indices closed down around two percent, with some higher beta indices like the Nasdaq, the Russell 2000 or the DAX (ehem) losing even more. The sell-off was broad, with not one sector in the US for example ending up on the day:
Breadth was absolutely awful, with only 23 stocks in the S&P up on the day, which leads to this sea of red in the indices market carpet:
By the way, I have a similar heatmap for the European market (see below), but show it less often due to reduced readability:
But if you like it and want to see it more often, just drop me a comment in the Comments section:
Alright, just before turning to bonds, let’s have a quick, closer look at the S&P 500. The following chart obviously inspired today’s QOTD:
So if price breaks the upward sloping trend channel (grey), as it has on all prior occasions this year, we could conclude that at least a retest of the June lows is at hand. This could also mean that we have just witnessed an island reversal (red circled), with all of its bearish implications. HOWEVER, the trend channel has not yet been broken and 4,080 is our point of interest.
Asian equity markets are weaker across the board this morning, with European and US index futures also suggesting a softer start to today’s cash session.
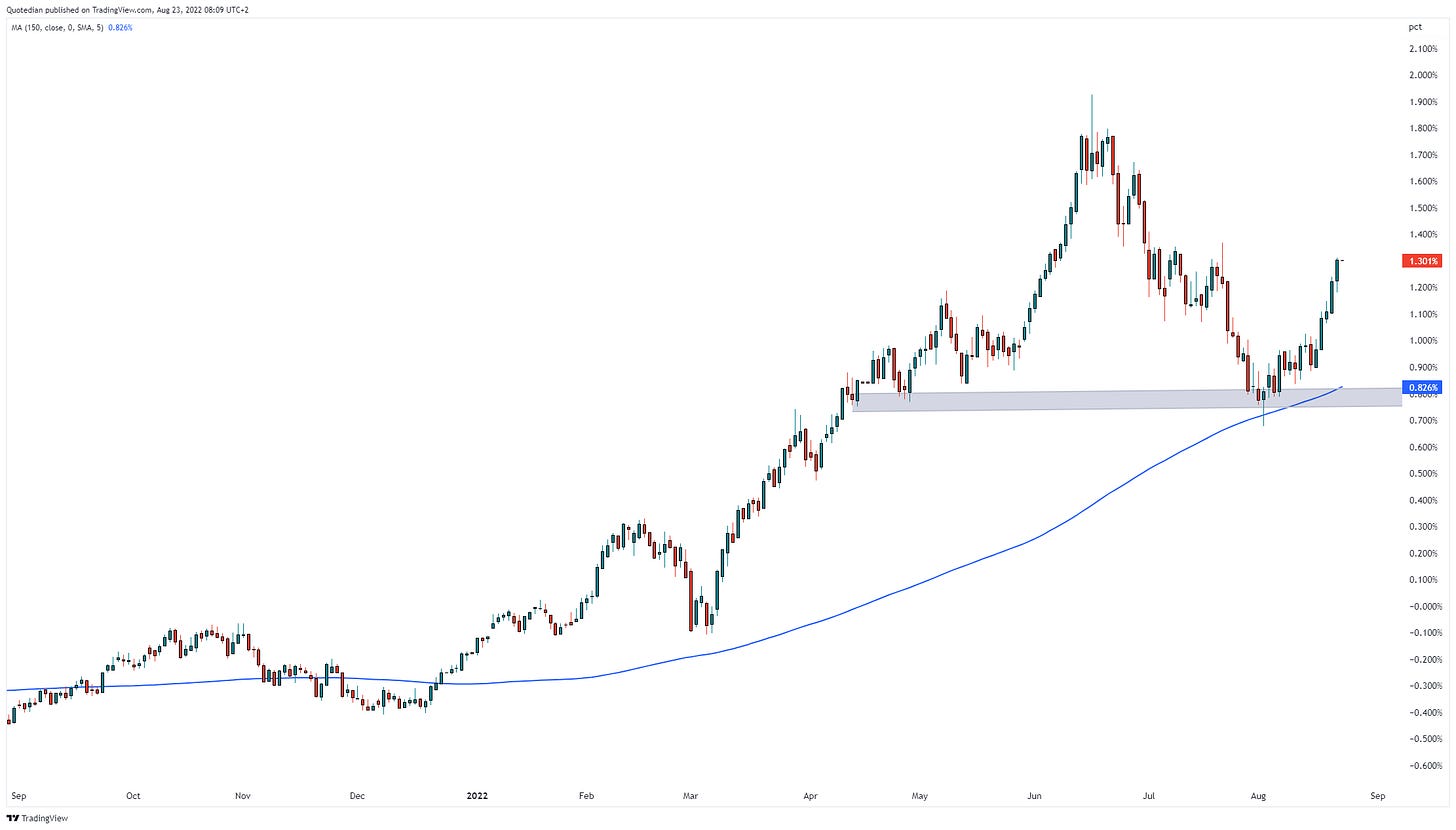
Bonds did once again not work as a hedge to the equity sell-off yesterday, as the fear of continued inflation and hence a hawkish Fed are the very reason for the sell-off. US yields pushed above 3%, where they continue to trade this morning, whilst their German counterparts (chart below) also are stampeding higher again:
Remember we discussed last week how High Yield bonds (HYG) had started to diverge (negatively) from stocks (SPY)? Well, HYG won…
This means of course that credit spreads are widening again and to be honest, on the chart, this looks quite ominous:
Moving into currency markets, this is of course where most attention should be paid to. Why? This chart from the always insightful Julian Bridgen at MI2 Partners gives a good explanation to the ‘why’:
In short:
The rate of change of USD strength is now approaching levels where it has a tendency to “break” things
The EUR/USD cross-rate has dropped below parity and has taken out the previous low with ease. Even so, the sell-off felt more or less orderly so far, hence we still need a panic moment for an intermediate bottom to be hammered in. I do not expect this to happen until somewhere slightly above 0.97. Here’s the long-term chart:
USD/JPY is closing in on 1.40 again in the meantime:
And staying with ‘currencies’ one more moment, our favourite risk indicator, Bitcoin, has been crying “buckle up” and warning of the impending “risk-off” mode before anyone else:
In commodity markets, keep your focus on natural gas, which is now breaking higher its US pricing:
Ok, time to hit the send button. Today the economic agenda is relatively light, with PMI measures as ‘calculated’ by S&P being the main attraction. Especially a weak reading in Europe could lead to further acceleration of the Euro downtrend (and associated stock markets). As a small heads-up, those PMIs in Australia and Japan this morning came in below 50, i.e. economic contraction …
But hey, it is the second day of the week, which of course could mean we are in for a ‘Turnaround Tuesday’. Let’s check back in tomorrow.
CHART OF THE DAY
The USD rate-of-change chart was going to be today’s COTD, but was to important in terms of context within the currency section to omitt there.
So today’s choice has fallen on the following graph from the fine folks at JPMorgan Asset Management, showing how the US equity market outperformance over other regions is now entering its 15th year …
DISCLAIMER
Everything in this document is for educational purposes only (FEPO)
Nothing in this document should be considered investment advice
Past performance is hopefully no indication of future performance


