Road to Nowhere
The Quotedian - Vol VI, Issue 31 | Powered by NPB Neue Privat Bank AG
It doesn't matter where you are, you are nowhere compared to where you can go.”
— Bob Proctor
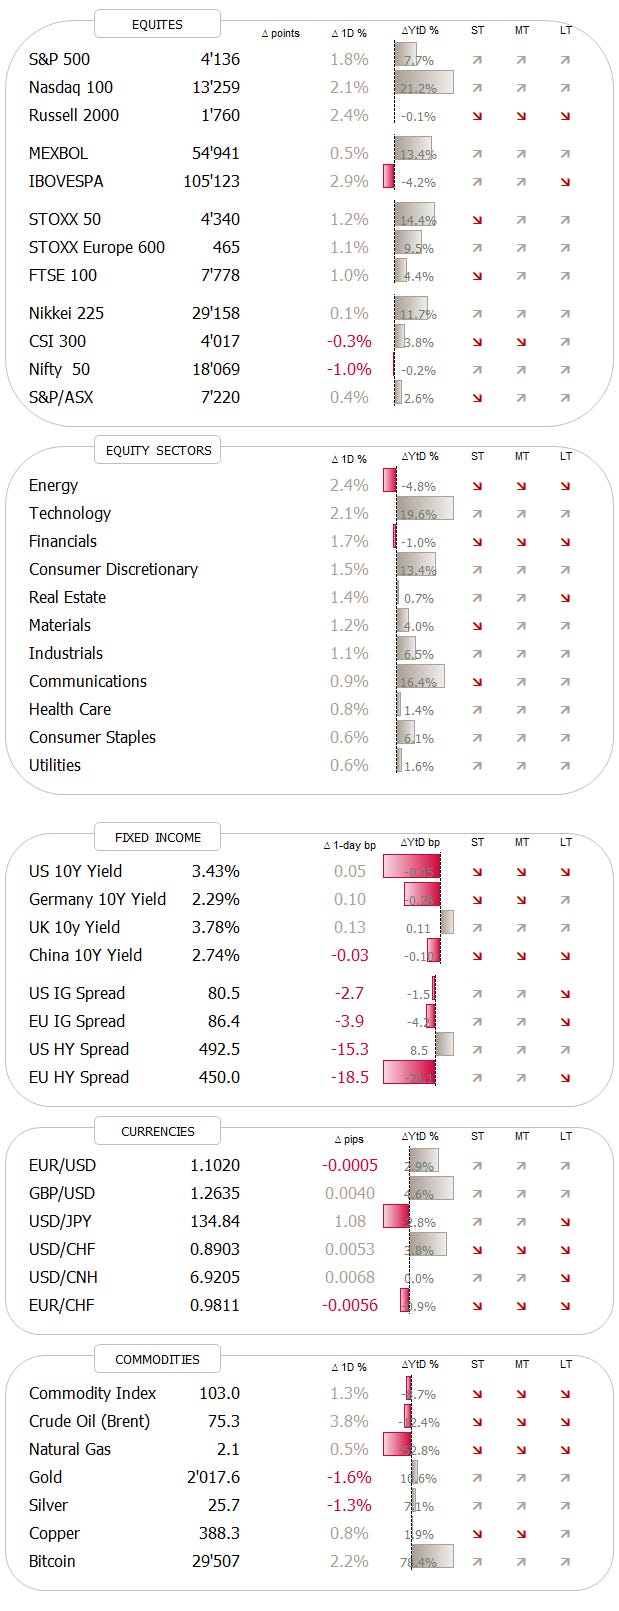
DASHBOARD
AGENDA
CROSS-ASSET DELIBERATIONS
What’s the one-year price return for the S&P 500?
Exactly! +0.31%
And for the tech-heavy Nasdaq?
A whopping 0.75%
Hong Kong stocks have been very volatile, surely they have moved big time up or down, no?
Nope, +0.24%
What about the commodity-related Australian or Canadian market then?
A very sleepy +0.20% and -0.44% respectively
Switzerland? Brazil? China?
-1.50%. +0.01%. +2.76%.
During this week’s review, we then will, aside from our usual weekly performance checks, also try and find some moving parts in this market that is seemingly on a Road to Nowhere.
Hence, what better song than Talking Head’s 1985 hit “Road to Nowhere” to accompany today’s journey across global markets?
The good old Quotedian, now powered by Neue Privat Bank AG
Lost on the market Road to Nowhere? NPB Neue Privat Bank AG is a reliable partner for all aspects of asset management and investment advice, be it in our dealings with discerning private clients, independent asset managers or institutional investors. Contact us: info@npb-bank.ch
Let’s start our weekly review, as usual, by looking at the 5-day performance of some of the most popular equity benchmarks around the globe:
Looking at the almighty S&P 500, the weekly rate-of-change could suggest it has been relatively calm out there. However, a look through the magnifying glass would reveal a pretty turbulent 5-day period:
A lot of movement for little net progress, which is exactly a fractal of what is happening on the yearly chart too:
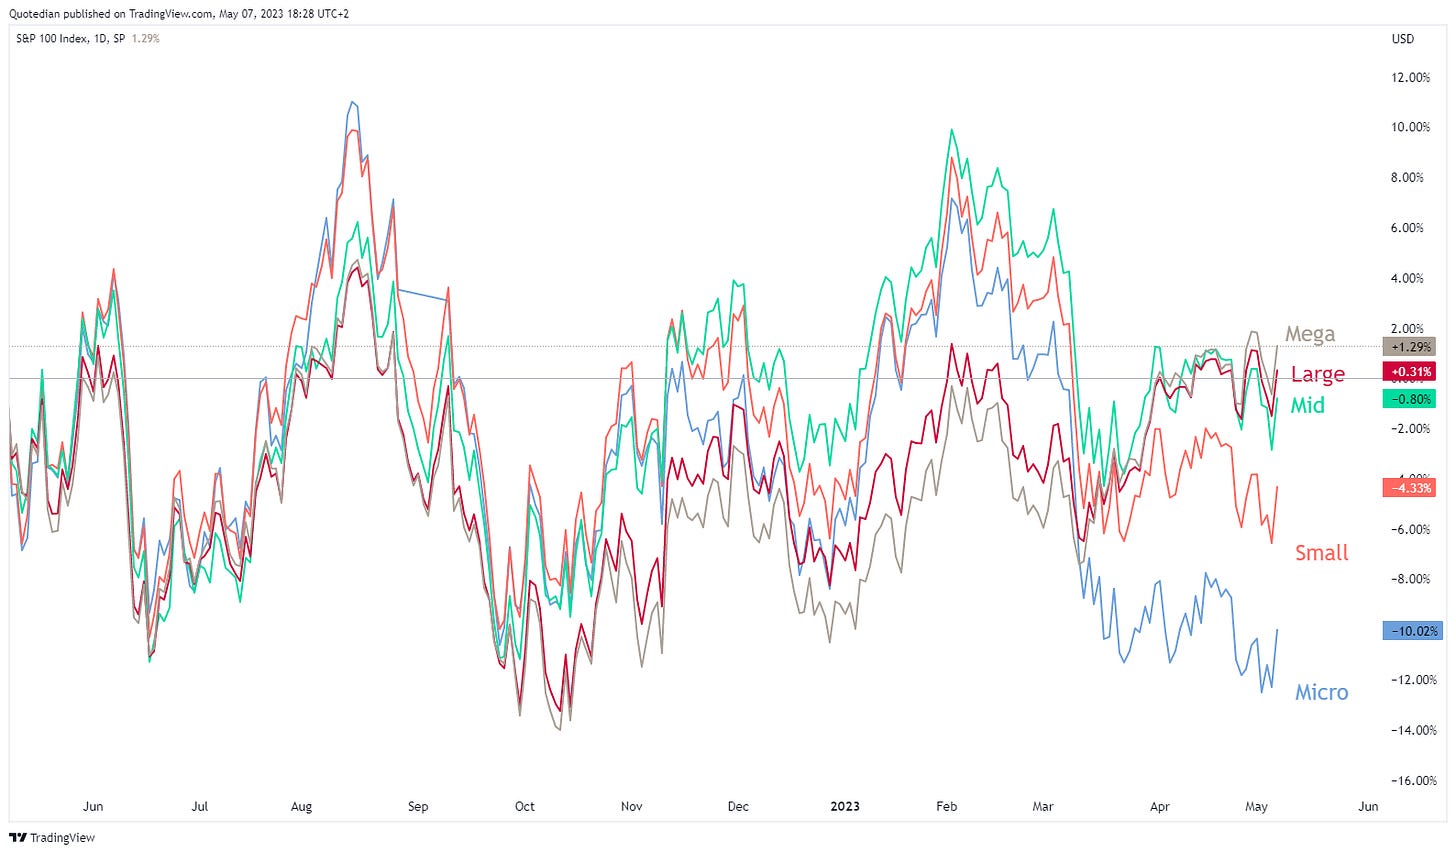
Looking for pockets of relative strength, size did matter over the past year:
Of course, returning to the global perspective, there were some markets which did perform strongly in either direction, leaving the ‘unchanged’ behind. Europe, for example, was definitely a place worth having been invested in. Here’s the narrow Euro STOXX 50 for example:
But also the broad STOXX 600 Europe index eked out an 8%-plus gain. Here’s what Europe’s recent outperformance looks like on a relative basis, compared to the broader US market (Russell 1000) in this case:
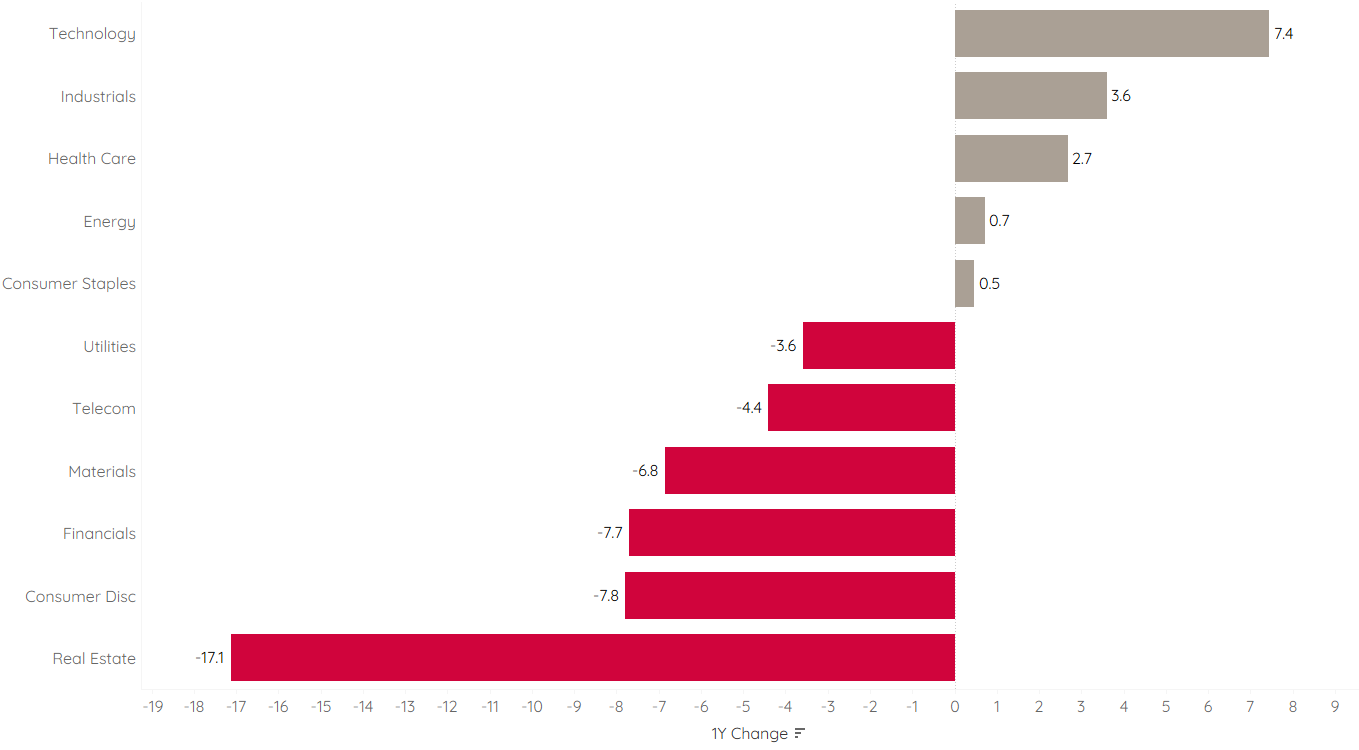
But also, as I have often argued, there is a lot of energy spent (no pun intended) to find out where best to invest geographically, whilst there is always a lot of dispersion to be found amongst sectors in every investor’s home turf. Consider the performance dispersion at a global sector level over just the past five days for example:
That’s 4.5% difference between best and worst in just one week! Imagine this zooming out on a yearly basis. Here’s European sector performance for example:
Nearly 75% between best and worst!! Why would you look somewhere outside of your home market for alpha?!
Let’s check the same for the US:
Less, but still nearly 25%. And no go back to the beginning of our deliberations and remember that the S&P is basically unchanged over the same period. I rest my case.
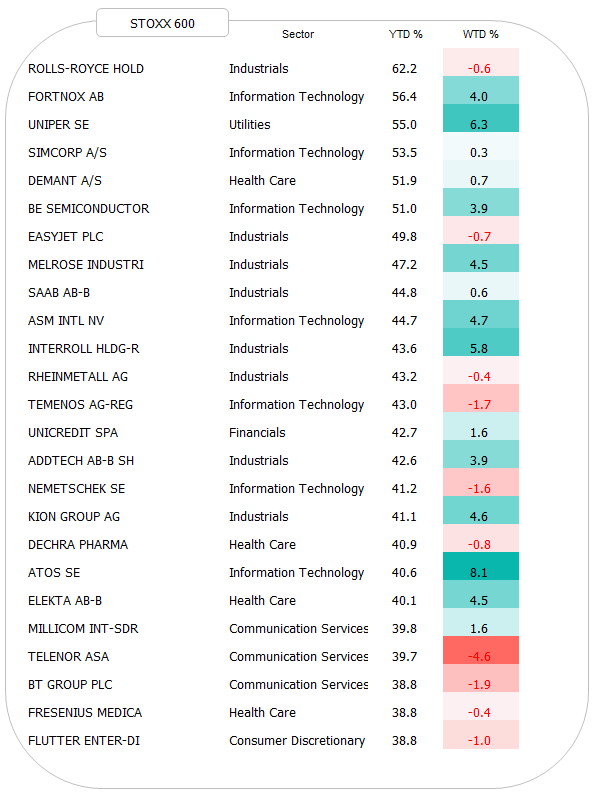
Before moving into fixed-income, let’s have our usual look at the top performing stocks for the year and their weekly change.
Starting with Europe for example:
I repeat what I said last week already. It seems that European investors have developed a craving for ‘local’ technology companies, of which there are not too many, compared to the US or Asia.
And here are this year’s top performers in the US:
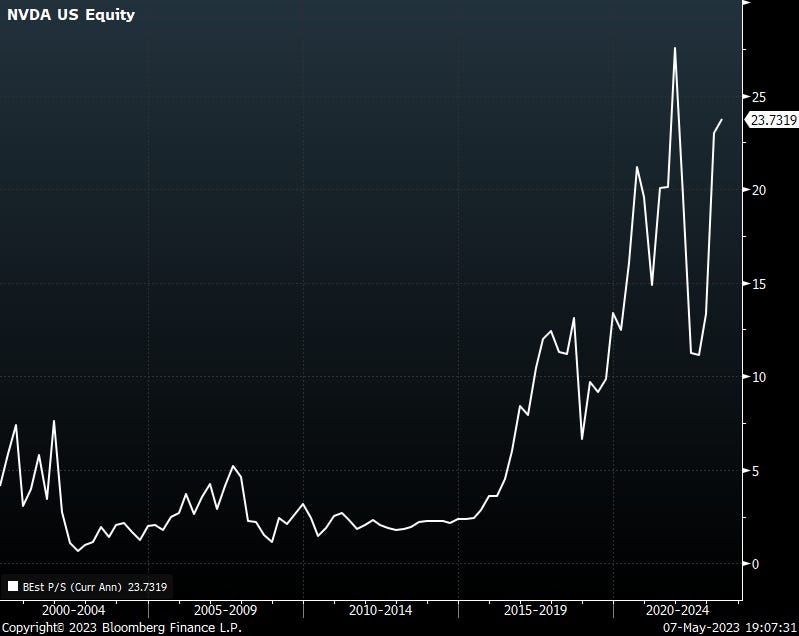
NVIDIA has always been one of my favourite companies out there, having had the smart to ride the “wave-du-jour” (videogames then crypto now AI) very smartly. But at a 23x Price/Sales valuation
it is time to re-read the famous “What were you thinking” speech from Sun Microsystems’ Scott McNealy and act accordingly:
“At 10 times revenues, to give you a 10-year payback, I have to pay you 100% of revenues for 10 straight years in dividends. That assumes I can get that by my shareholders. That assumes I have zero cost of goods sold, which is very hard for a computer company. That assumes zero expenses, which is really hard with 39,000 employees. That assumes I pay no taxes, which is very hard. And that assumes you pay no taxes on your dividends, which is kind of illegal. And that assumes with zero R&D for the next 10 years, I can maintain the current revenue run rate. Now, having done that, would any of you like to buy my stock at $64? Do you realize how ridiculous those basic assumptions are? You don’t need any transparency. You don’t need any footnotes. What were you thinking?”
Turning to fixed-income markets, the weekly performance picture would suggest that yields overall softened and credit spreads somewhat widened:
And here again, whilst bonds have been very volatile, there actually has been little to no net progress for eleven months now. Here’s the US 10-year yield:
Road to Nowhere anyone?
But here also, not everything is equal, and the shorter end of the curve is substantially higher over the same 11-month period (courtesy of fed hikes, of course):
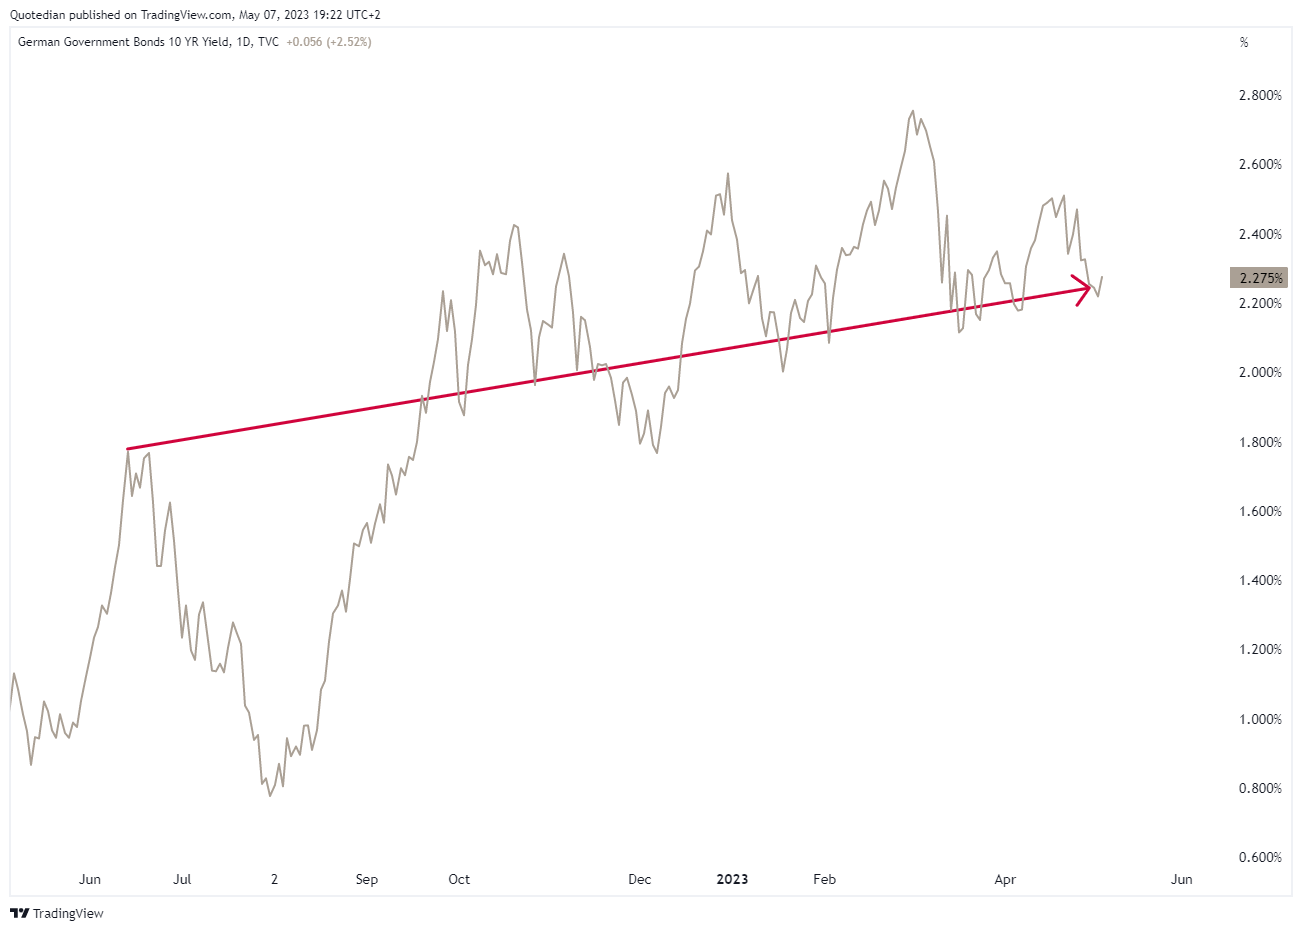
Or geography also mattered, with the 10-year German Bund also seeing a steep increase over the same period:
We of course also need to speak about Friday’s once-again-knock-out job numbers, where non-farm payrolls came in stronger than expected and the US unemployment rate dropped to a new cycle low (3.4%):
Not unsurprisingly, this put upside pressure on bond yields, especially at the short end of the curve. Here’s Friday’s intraday chart of the 2-year yield:
Let’s use this as a segue into currency markets, where the US Dollar did react as expected to the stronger-than-expected jobs data by shooting higher, but then giving it all back and then some. Here’s the intraday chart of the US Dollar Index
I am not sure what provoked the reversal lower on the Greenback whilst yields remained (correctly) elevated.
The truth is that the Dollar was under pressure versus all other currencies during the entire week:
Versus the Euro, the chart continues be extremly murky, not inviting to any major directional call for now, though a move above 1.11 would be a clear win for the Euro-bulls:
Needing to wrap up, here’s for completeness purposes the 5-day performance of popular commodity futures:
And here one chart for the commodity section, which is the one of Gold:
The yellow metal reached briefly a new all-time high at $2,081, before crashing back to $2,000. Something’s going on …
Have a great start into the new week!
André
CHART OF THE DAY
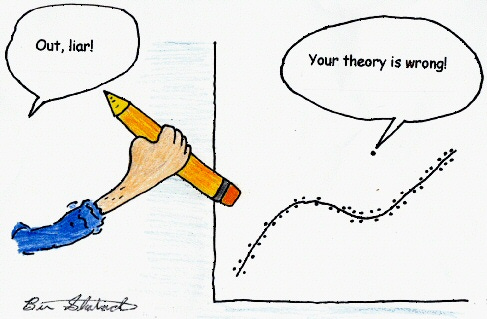
With too many stats and charts already, here’s a quick insider joke for statisticians (a word I cannot even pronounce):
Thanks for reading The Quotedian! Subscribe for free to receive new posts the moment they are published.
DISCLAIMER
Everything in this document is for educational purposes only (FEPO)
Nothing in this document should be considered investment advice
The views expressed in this document may differ from the views published by Neue Private Bank AG
Past performance is hopefully no indication of future performance


