Running Late
The Quotedian - Vol V, Issue 141
"A group of people who think differently is a market. A group of people who think alike is a mob."
— Naval Ravikant
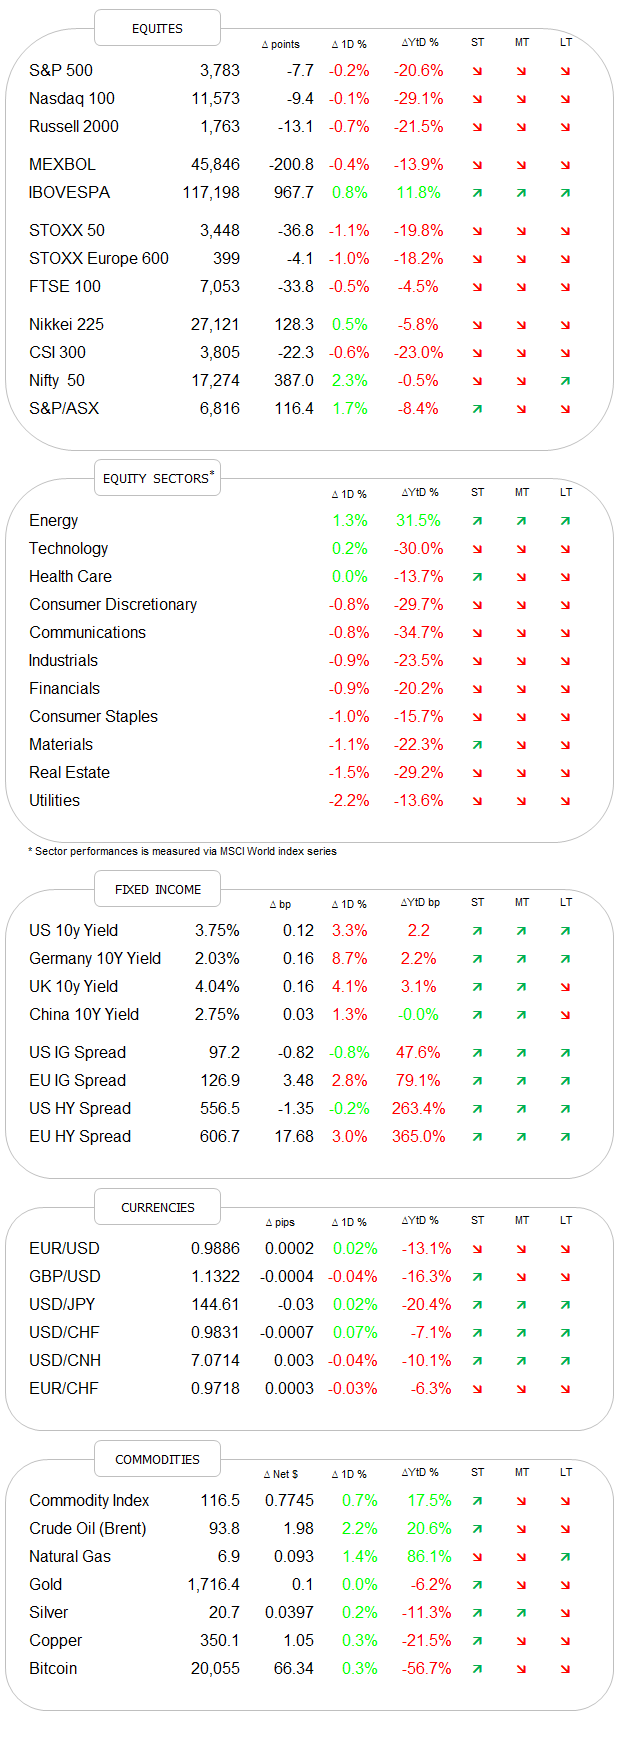
DASHBOARD
AGENDA
CROSS-ASSET DELIBERATIONS
Apologies for the delay in today’s publishing; Luxembourg metro workers are currently on strike … The good news is, that your favourite daily macro newsletter will be short ‘n sweet today.
Hence, without further ado, let’s dive right in!
This is probably NOT the headline I would have chosen to describe yesterday’s equity session if I were CNBC’s headline editor (which thank god I am not). Given that stocks closed down a full 7 index points (yes, sarcasm alert) and taking into consideration the intraday recovery provided by stocks, the headline can indeed be somewhat misleading. Here’s the intraday chart of the S&P:
What makes the rally after the initial slump even more appreciatable is that it took place in the face of rising yields and a rising US Dollar (see FI and FX sections further down).
Breadth-wise about two stocks fell for every stock up, whilst only three sectors managed to eke out gains:
leaving us with a market carpet as follows:
It definitely smells like a consolidation day with the potential for further short-term gains. And then one advantage of sending this letter a bit later to you today is that we already are half an hour into the opening of European cash markets, and we can confirm that indeed the rally is continuing for now (of course, Europe also missed large parts of the US recovery yesterday). But with Asian markets having behaved decisively bullish too and US index futures in the green as I type, there is little doubt that the bulls stay in charge for now.
The focus over the coming hours, and this also serves as a segue into the fixed income section, will be on the US jobs market, with initial jobless claims out this afternoon and the almighty non-farm payroll due tomorrow.
As aforementioned, yields rallied around the globe yesterday, with a hawkish interview by San-Francisco Fed president Mary Daly and a better (56.7) than expected (56.0) ISM reading cited as the main “culprits”. Perhaps. On the chart, the turnaround is a bit ‘neater’ to explain on the German Bund than on its US equivalent, especially as it was a possibility we discussed in yesterday’s Quotedian:
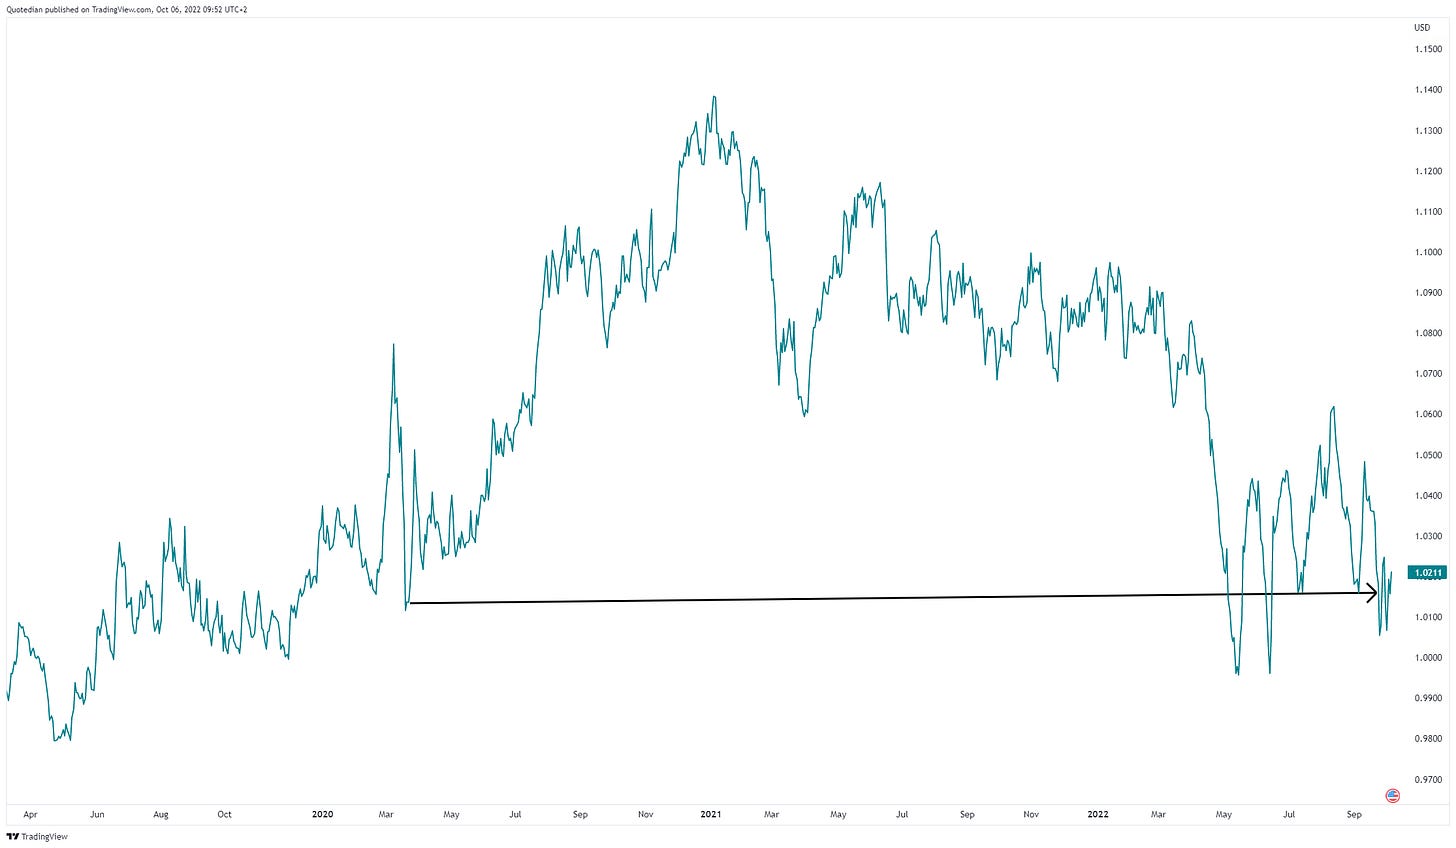
Let’s head right into the FX section, where today’s ‘beef’ of The Quotedian lays. But just before we get to that longer-term thought, similar to two-day recovery in yields, the US Dollar has also halted its recent slide, and right at the point we had discussed on the EUR/USD chart:
No need to say, that the potential for Euro gains would increase if that downward sloping trend channel could be broken to the upside. This would also allow for a pause in the rising yield cycle and give further potential to an equity relief rally. And with that, I probably just made myself very popular with thousands of fund managers which are hoping for some performance improvement into year-end. As the saying goes:
Hope is not an investment strategy.
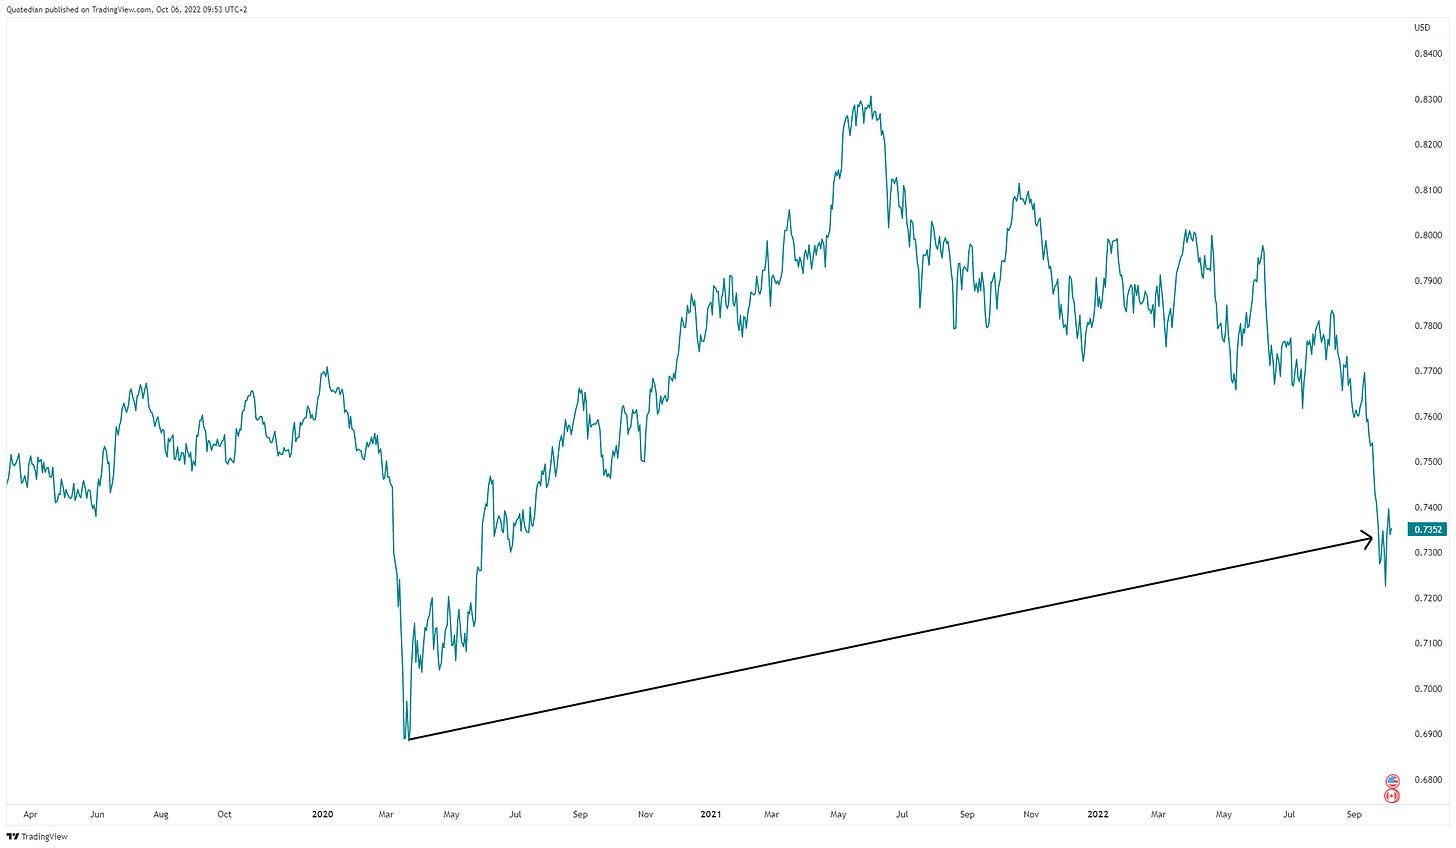
On with that FX observation, and please bare with me, as we have a number of charts to quickly flick through. The following charts show a series of different currencies versus the US Dollar over the past three years or so and we will pack them into two groups.
Let’s start with group one:
And now group two:
See the pattern, of non-commodity currencies (Group 1) recently all making new lows versus the US Dollar, whilst commodity-currencies (Group 2) all make higher lows in the current cycle?
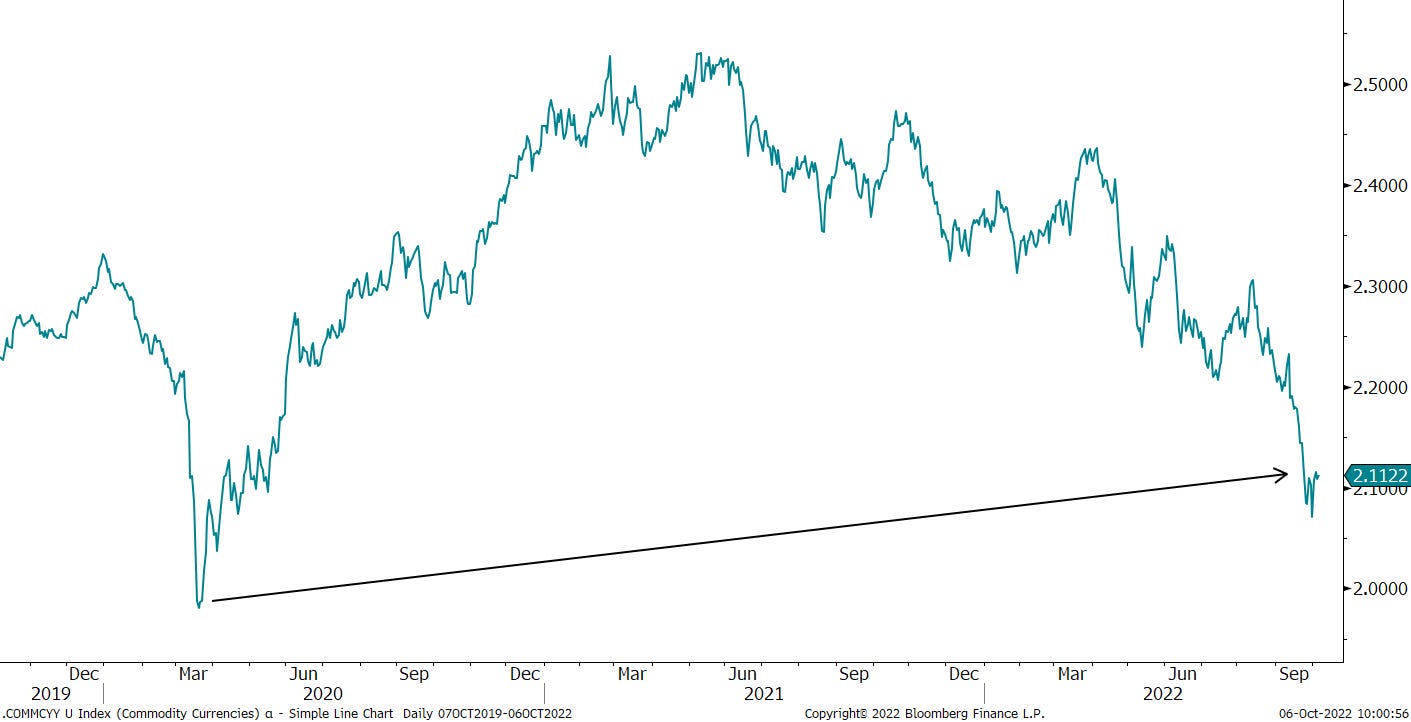
All truth being told, I could have saved a lot of screen real estate by simply packing the groups into two simple, combining charts, so let’s do that anyway:
Group 1 - Average of GBP, CHF, JPY, EUR versus USD
Group 2 - Average of AUD, CAD, NOK, ZAR, NZD versus USD
Long chart series, short conclusion: I really, really like to see that pattern of pockets of relative strength during major trends, such as we have seen of commodity-related currencies during the USD-bull run. These will be the leaders once the USD ends its cyclical upturn (getting closer?).
How to implement this? For a small fee … just kidding. Let’s discuss this in another Quotedian, but let’s also see if there is a similar pocket of relative strength to be found in another asset class (hint: there is), hopefully, tomorrow.
Have a great Thursday!
CHART OF THE DAY
Instead of a gorgeous COTD (you have plenty to chose from above), I leave you with this. Even though it seems to be too hilarious to be true, it apparently is true!
Some proof here and here and here.
Thanks for reading The Quotedian! Subscribe for free to receive new posts and support my work.
DISCLAIMER
Everything in this document is for educational purposes only (FEPO)
Nothing in this document should be considered investment advice
Past performance is hopefully no indication of future performance


