“Everything is going to be fine in the end. If it's not fine it's not the end.”
— Oscar Wilde
DASHBOARD
AGENDA
CROSS-ASSET DELIBERATIONS
After yesterday’s relatively long essay I will need to keep things a bit shorter this morning, as our dog has an 8 a.m. appointment - yes, you read that right and no, please don’t ask …
On to some observations of the past few hours: Stocks on both sides of the Atlantic eked out some gains on Wednesday, with indices in Europe outpacing those in the US (having missed the US recovery rally the previous day). Market volatility clearly increased after the release of the June FOMC minutes at 8 pm CET (red box):
Market internals such as breadth (slightly more winner than losers) or sector performance (eight up, three down) did not give much more clues about possible market direction. The S&P 500 heatmap gives some further insight on how fragmented the session was:
Asian markets are primarily up this early Thursday, with markets such as Japan, Taiwan and Korea showing gains in excess of one and even two per cent. The feel-good came not only from the positive Wall Street template but also after Samsung reported better-than-expected results. Of the major regional markets, only Hong Kong stocks are bucking the trend with a small red print, which probably can be assigned to some profit-taking after a recently decent run.
Index futures are currently pointing to additional gains as cash markets open on both sides of the Atlantic.
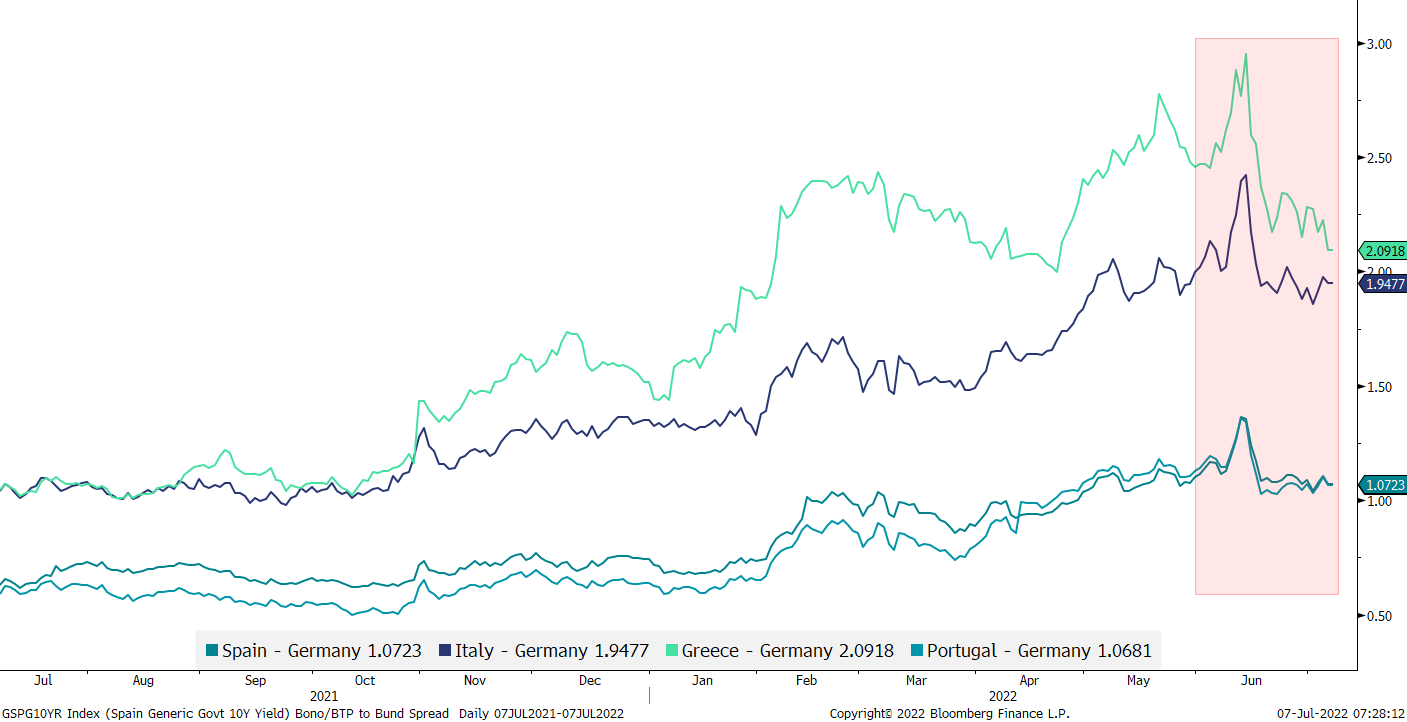
Moving into fixed income markets, we observe that US rates moved higher yesterday (10-Year @ 2.92%), as did their German counterparts (1.17%). Staying with European rates for a moment, the chart below shows that the rise in spreads between ‘Club Med’ countries and the German Bund has recently been reversing:
The question remaining would be: Is it because the situation for Spain & Co. is improving or are worries over Germany on the rise?
And apropos country risk, Japanese CDS-spreads have recently also been increasing, as the BoJ continues to defend the (ultimately undefendable) 0.25% ceiling on the JGBs:
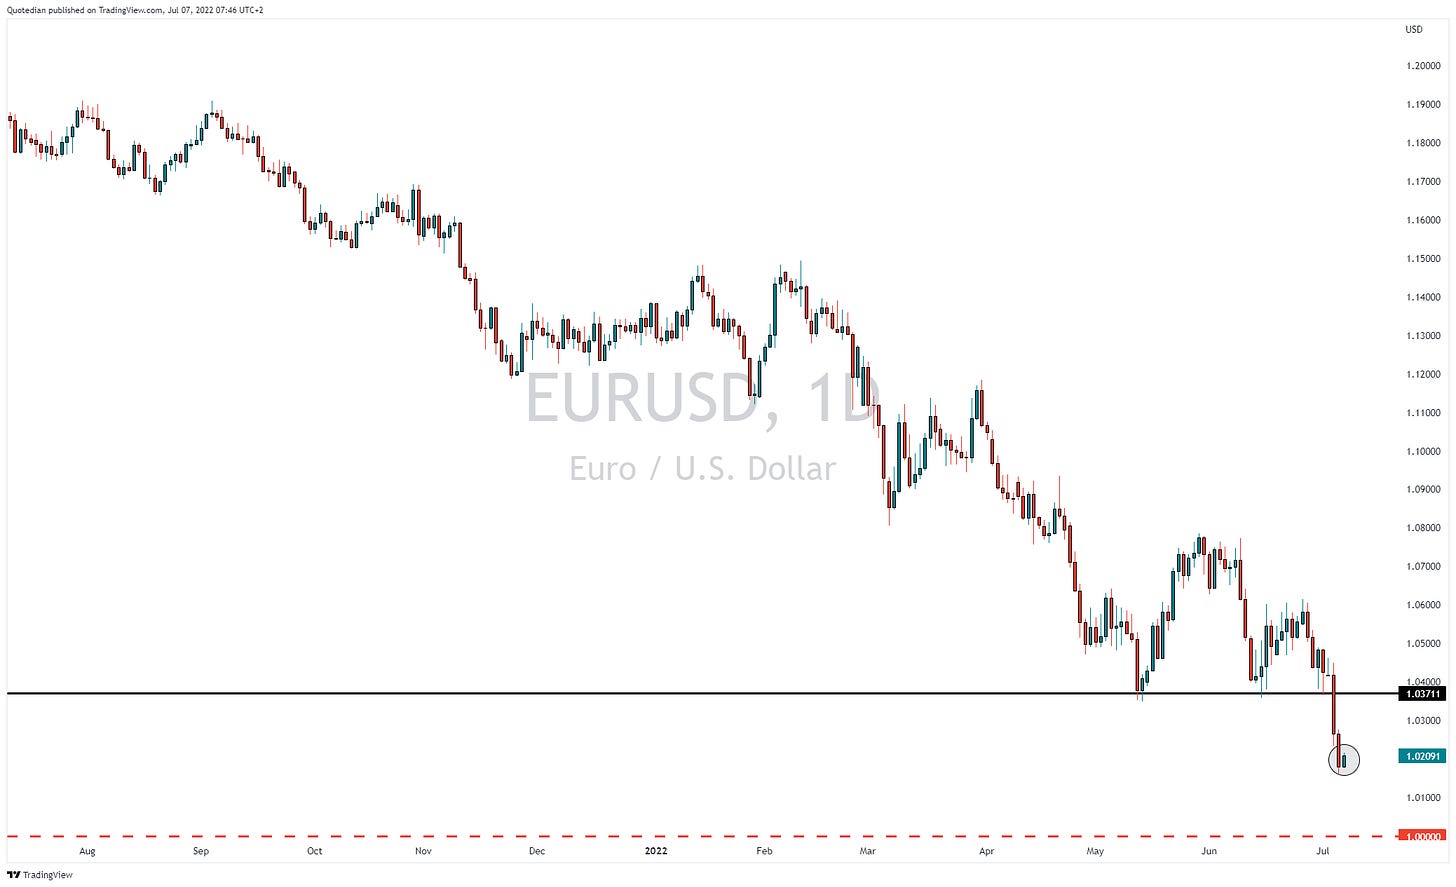
This in turn brings us to currencies, where the US Dollar finally had a (small) corrective day, after three days of relentlessly pushing higher, releasing some pressure on other asset classes of course:
However, the EUR/USD chart nicely shows how small that recovery has been so far:
As mentioned above, I have to hit the send button too soon today, but let me leave you with one more chart in the commodity complex. Of course has Gold made some headlines in the past two sessions, with first a price drop below $1,800 and then hitting a low of $1,730 in yesterday’s trading. Of course is the price of Gold normally measured against the (currently) mighty Dollar, hence the relative strength it has shown against other asset classes (stocks and bonds) since the beginning of the year, is actually quite admirable and maybe a sign of strength to come:
CHART OF THE DAY
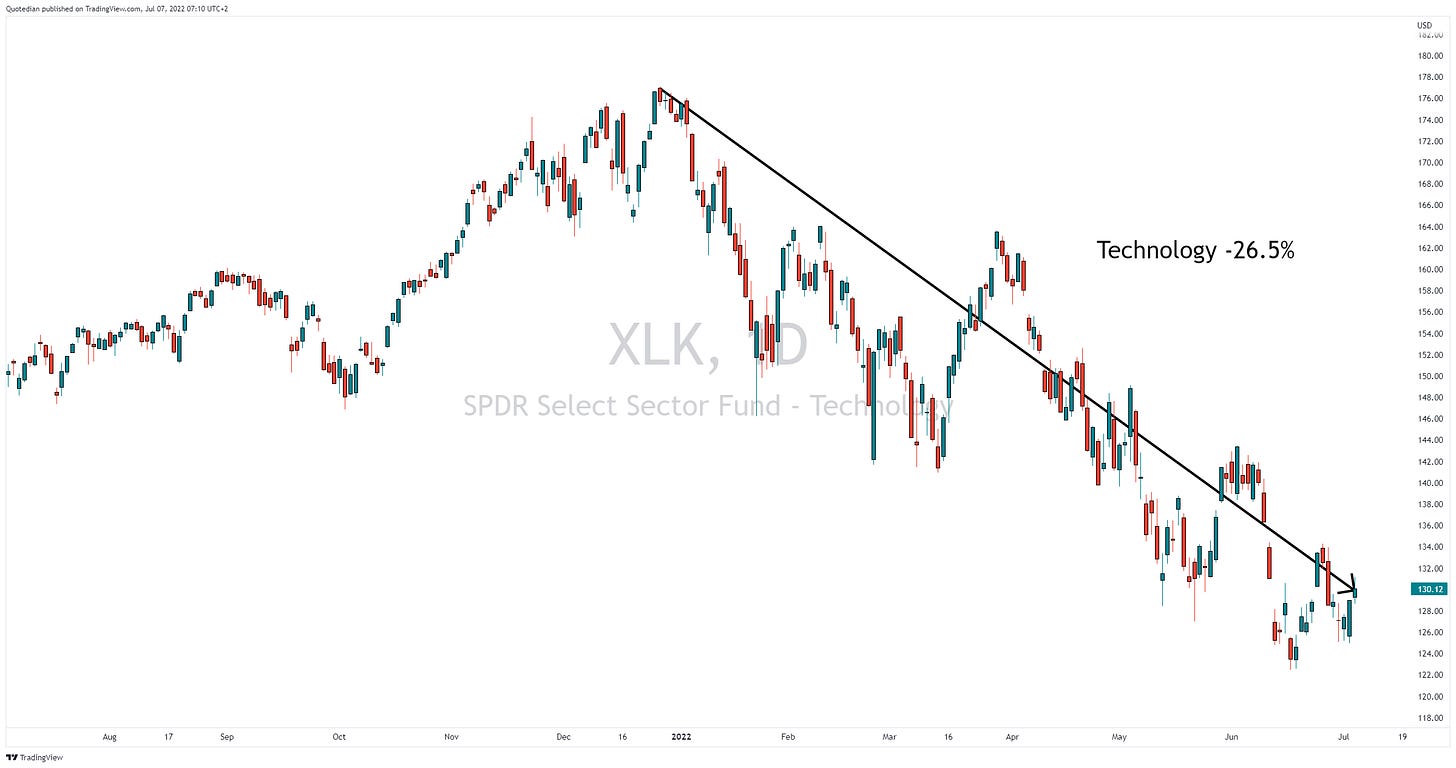
Here I am, writing a daily market column, trying to miss the main macro moves and even point out some of the finer nuances. And then, looking for inspiration for a COTD, I suddenly make this observation:
Using two very popular ETFs for comparison, Energy stocks (XLE) are now down more than Technology stocks (XLK) from their respective 52-week highs!
Don’t believe me? Just watch!
Surprised as me? Leave a comment here:
DISCLAIMER
Nothing of the above is investment advice
Past results are hopefully no indication of future results


