Same Difference
The Quotedian - Vol VI, Issue 53 | Powered by NPB Neue Privat Bank AG
"Markets will do the most obvious thing in the least obvious way."
— Linda Raschke
DASHBOARD*
* Please note that today’s Dashboard data has for technical reasons been download this morning 07:30 CET instead of at yesterday’s NY closing bell. FWIW
AGENDA
CROSS-ASSET DELIBERATIONS
Today’s title of ‘The Quotedian’ refers, as it usually does, to the Chart of the Day section at the end of this newsletter. However, another title that could have worked well today too, would have been “More of the Same”, as equity markets seem to have fallen in kind of a Groundhog Day, with many indices grinding higher day after day … and mostly against all odds.
Take the Nasdaq 100 for example: Since the bottom on Monday 26th June after a hefty (wait for it) nearly four percent pullback, only had three down days in 15 sessions and is now scratching at the 16,000 level:
As a matter of fact, the whole year as actually been pretty smooth sailing for this index:
Now, one fact needs to be known about yesterday’s Nasdaq rally. With 60 winners and 40 losing stocks on the day, the bulls had a slight overhand. HOWEVER, Microsoft’s 4% jump after announcing a re-pricing of the AI-functionality for their suite of Office tools at $30 per user per month, made the stock responsible for 76% of the Nasdaq’s upside.
And here’s one more on this market craze surrounding AI - also related to MSFT. During the fore-mentioned presentation of new AI tools and pricing, the company’s market cap increased by USD170 billion(!) in about an hour:
Here’s another fun chart, showing the 6-month change in the Nasdaq’s market cap over the past 20+ years:
Now, let’s turn to another bellwether index … exactly, the Dow Jones Industrial (DJI)index and its cousin, the DJ Transport (DJT) index. Together, they form the base of the ‘Dow Theory’, formulated nearly 130 years ago by Charles Dow (click on this text to read more).
The fourth of the six tenets of the Dow Theory states that the two indices must confirm each other, i.e. a new high (or low) on one index must be confirmed via a new high (or low) by the other index, in order to trigger a buy (sell signal). Well, here we go:
Anyway, back to yesterday’s session, where the S&P 500 advanced 0.80% via a straight line from the bottom left to the top right:
Three out of the eleven economic sectors closed lower, whilst winners outpaced losers at a ratio of about two to one, leaving us with the following heatmap:
The second best performing sector was financials, where banks are being motivated by mostly decent earning reports. As a matter of fact, the big banks reporting solid earnings is bringing risk-takers in the regional banks back to the table. The chart of the US Regional Bank ETF (KRE) has just completed an inverted shoulder-head-shoulder pattern with an implied price target 20% higher than today’s close:
Asian markets are providing a mixed picture this morning, with most Chinese indices, Mainland and HK, printing losses, whilst most other regional indices are showing small advances.
Popular European index futures are largely higher, suggesting a friendly start to our session here, as earnings continue to pile in.
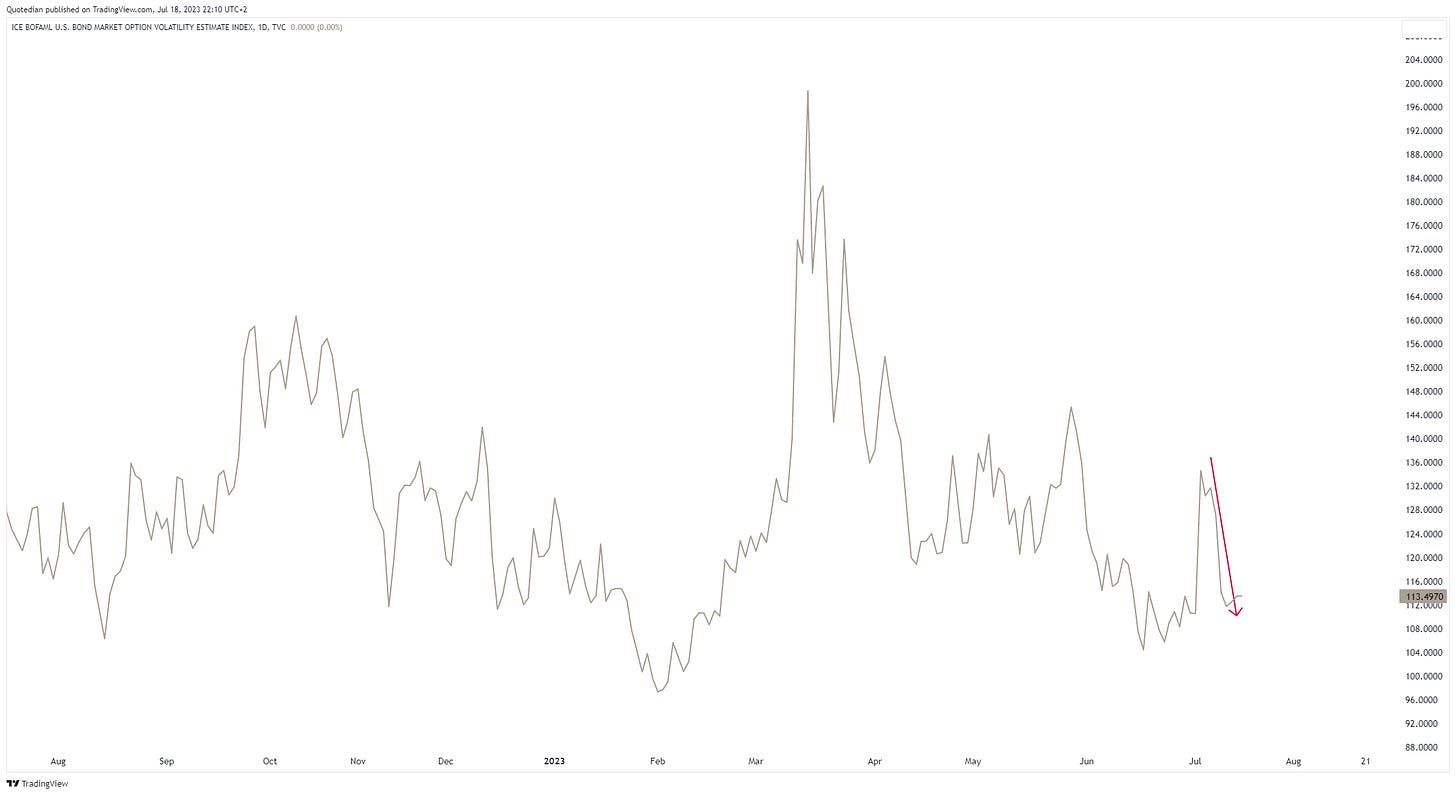
Yields have been trading relatively quiet over the past two sessions, which is also starting to manifest itself in a lower MOVE (the VIX of bonds) index:
But the key chart remains to be the US10-year Treasury yield, at least from a technical viewpoint. The failed break out of the nearly year-old range could mean lower yields ahead:
The German 10-Year Bund yield, as proxy for European rates, has become a snore-festival:
Maybe if key support at 2.30% gives we get some action … maybe …
Credit spreads on both sides of the Atlantic in the meantime continue to negate the possibility of a recession:
And a propos ‘recession’, one thing continues to nag me:
If everybody and his/her dog are now betting on a “soft landing” (of the US economy), which with reason data is indeed a possibility, how can ‘they’ then also price five rate cuts for next year?
One suffering asset as per late has been the US Dollar, which probably has helped the current leg up in risky assets to unfold. The Dollar Index (DXY) has stopped the bleeding for now, but clearly trades below key support (now key resistance):
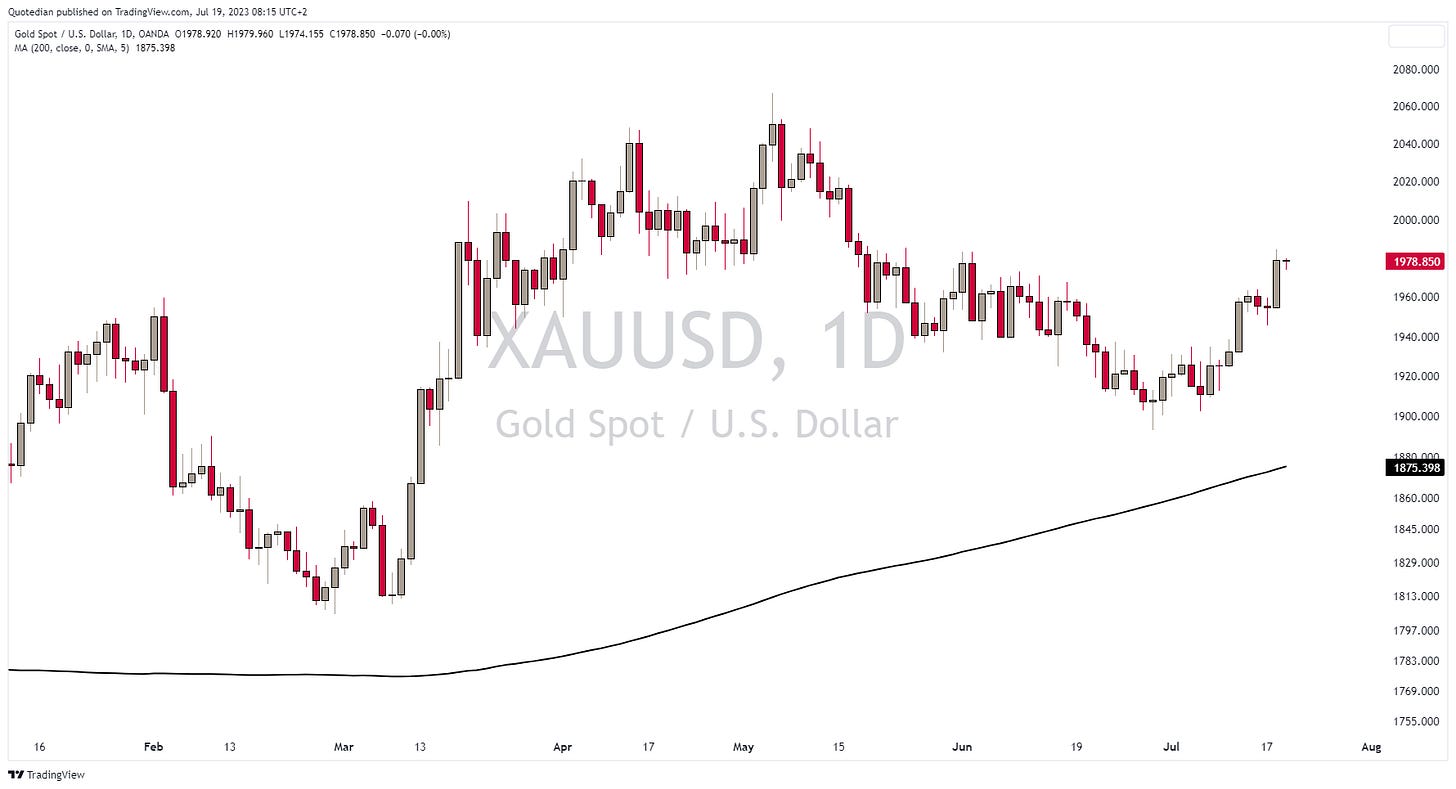
Despite the small footing that the Greenback has found over the past two sessions, Gold (which is normally measured in USD) continues its small rally and the chart starts looking substantially more constructive:
Little more to report from the commodity complex other than oil (WTI) has halted its one-month ‘rally’ just below the 200-day moving average:
That’s all for today - have a great day!
André
CHART OF THE DAY
Today’s chart compares the recent fortunes of the ARK Innovation Fund (ARKK) and Goldman Sachs’ index of non-profitable tech companies (GSXUNPTC).
Same difference …
Thanks for reading The Quotedian! Subscribe for free to receive new posts the moment they are published.
DISCLAIMER
Everything in this document is for educational purposes only (FEPO)
Nothing in this document should be considered investment advice
The views expressed in this document may differ from the views published by Neue Private Bank AG
Past performance is hopefully no indication of future performance


