Seasick
The Quotedian - Vol V, Issue 148
“Seasickness: at first you are so sick you are afraid you will die, and then you are so sick you are afraid you won’t die.”
— Mark Twain
DASHBOARD
AGENDA
CROSS-ASSET DELIBERATIONS
Due to a relatively early meeting in town this morning, today’s note will be somewhat shorter than usual. So, let’s dive right in …
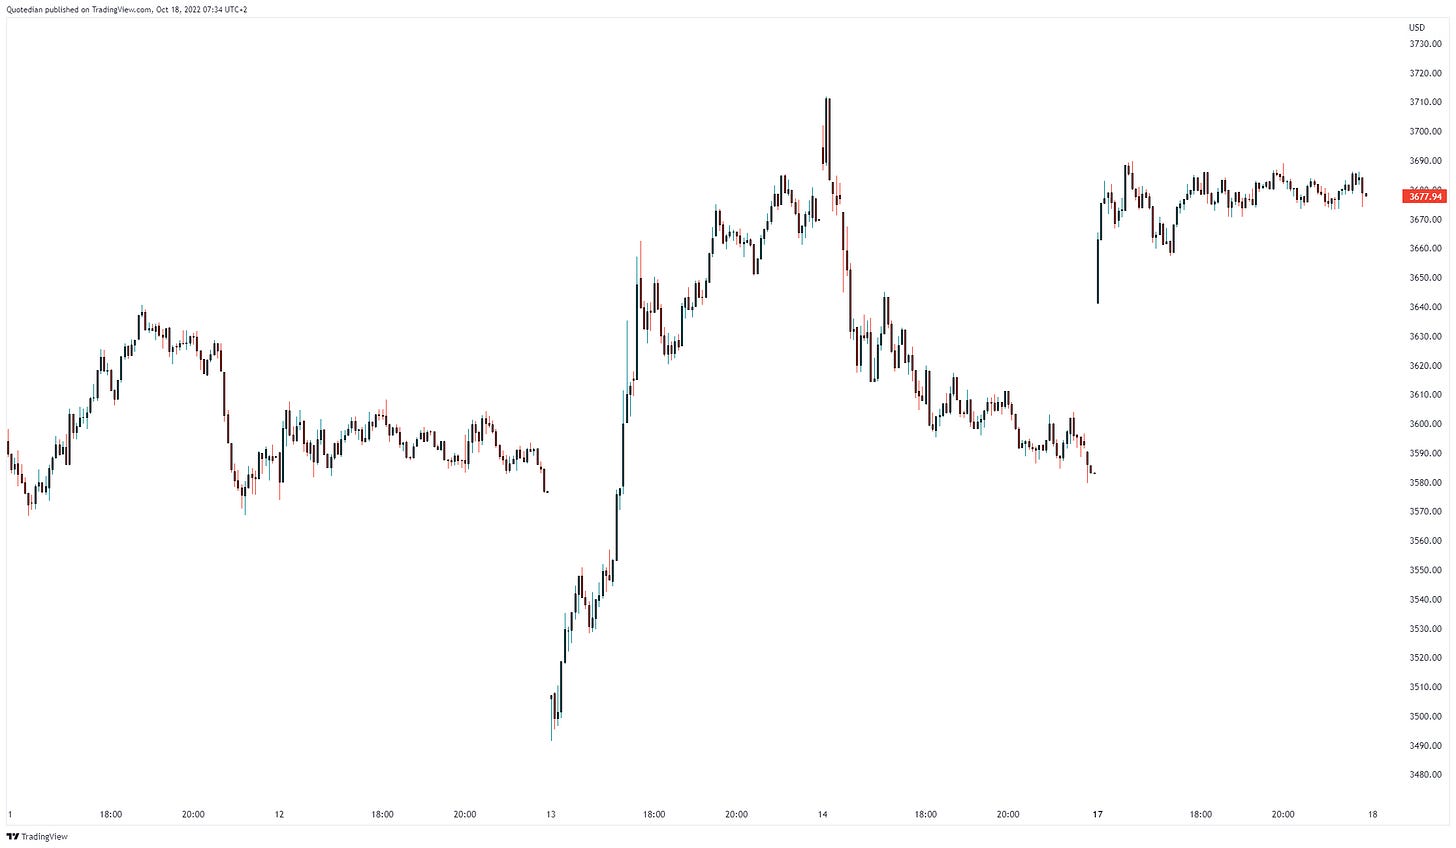
Seasick is what you may bet if you have been looking to close at equity movements over the past three days. Here’s the 5-minute chart of the S&P 500 over the past three days or so:
Whilst such erratic market movements are seldom a sign of a very healthy market, it does show the tug-of-war going on between bulls and bears, with some good arguments up the bulls’ leaves.
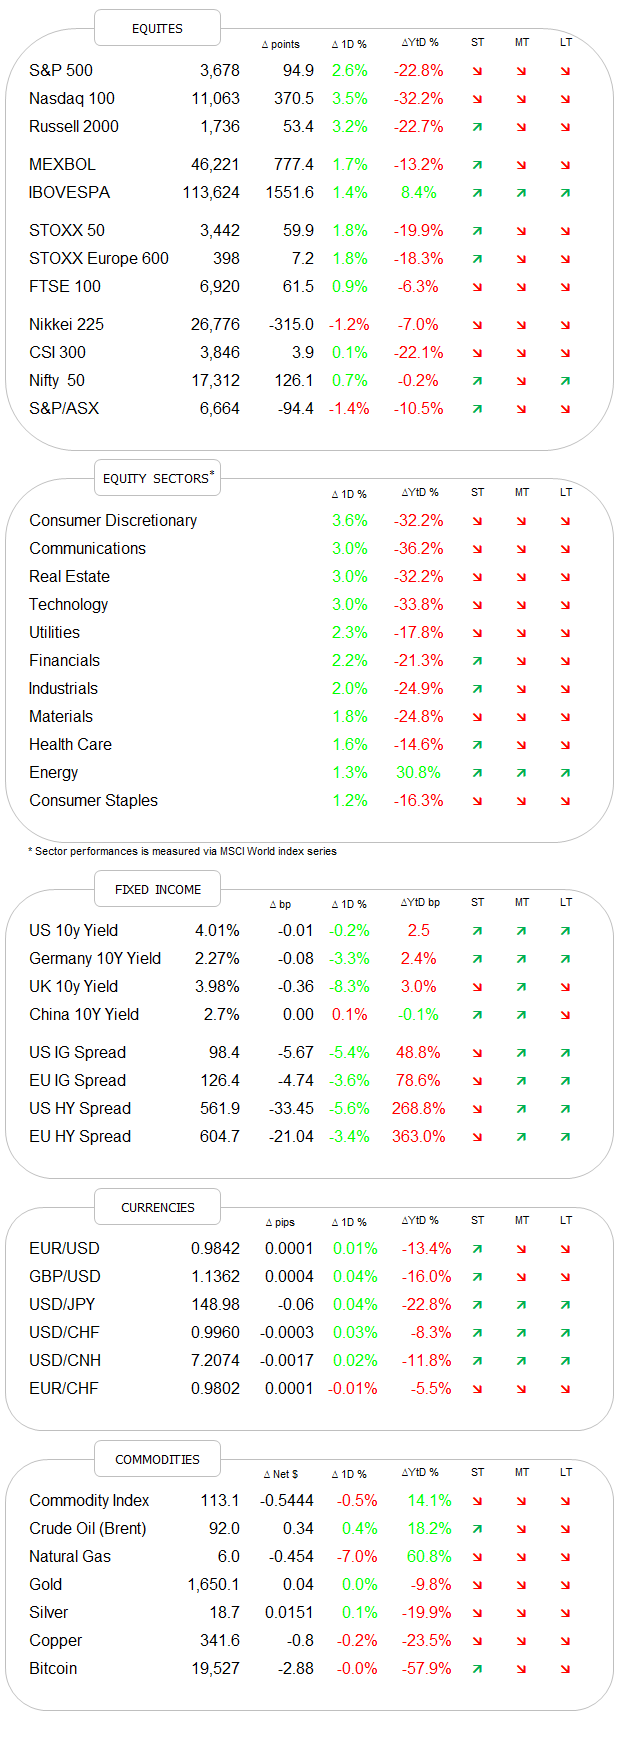
Yesterday’s session, for example, saw 95% of the stock in the S&P 500 close higher on the day (with the intraday reading at 99% at one stage):
Further, and still talking S&P 500, eleven out of eleven sectors closed higher on the day:
Paying close attention, we note that the sectors up most, are the sectors down most on a year-to-date basis.
Also, the press is making quite a fuss that the same index closed well above it’s 200-week moving average, something we discussed here already two weeks ago:
Last but not least, the fine folks at Bespoke Investment Group, produced the following chart, showing all occasions where the S&P 500 was up 2.5% or more in the first hour of trading (kind of opening gap):
We note that such ‘gaps’ happened at the start of new cyclical uptrends, but more often closer to the end of cyclical bear markets. The latter fits the preferred scenario we have been discussing in this space especially well.
Asian markets are a sea of green this morning, with the notable exception of Chinese mainland stocks, which are flat, probably in expectation of more news to come out of the ongoing party congress.
Talking China and party congress, I’ll try to comment a bit more later during the week, but for now, markets seem somewhat disappointed as Sunday’s key speech by Xi was proposing largely more of the same. The biggest change in comparison to his speech in 2017, was the word “reform” replaced by “security”, which says a lot about the changes we have seen on a geopolitical level. But more immediate, market participants were/are expecting a change to the Zero-COVID policy, which so far has not happened.
Bloomberg had this interesting chart up, showing the waning confidence of international investors in Chinese equity:
Turning to fixed income, rates are off their recent highs, which probably can be largely attributed to a rally in UK Gilts, after the government has now completed the U-turn on its “mini-budget” proposed a few weeks ago. Of course, you probably have already seen UK-tabloid Daily Star‘s live webcam of Truss versus a lettuce and the question who will last longer,
but I noticed this morning that now they’re getting really cute about it:
Bless British humour!
Anyway, have another pill against seasickness before checking the UK 30-year Gilt chart:
The US 10-year yield also turned lower during yesterday’s session, until Europe left at least. Thereafter, it quickly rallied up to the 4%-handle again, where it sits this morning:
Nothing particular to mention on the credit risk side of bonds, where spreads have tightened a tad - but just that, a tad. The iShares High Yield ETF is hence off its recent lows, but still trades below its June lows (compared to equities, which are above their own June lows again):
Hence, the jury still stands out on whether yields and credit spreads will support the equity rally attempts. Let’s pay close attention.
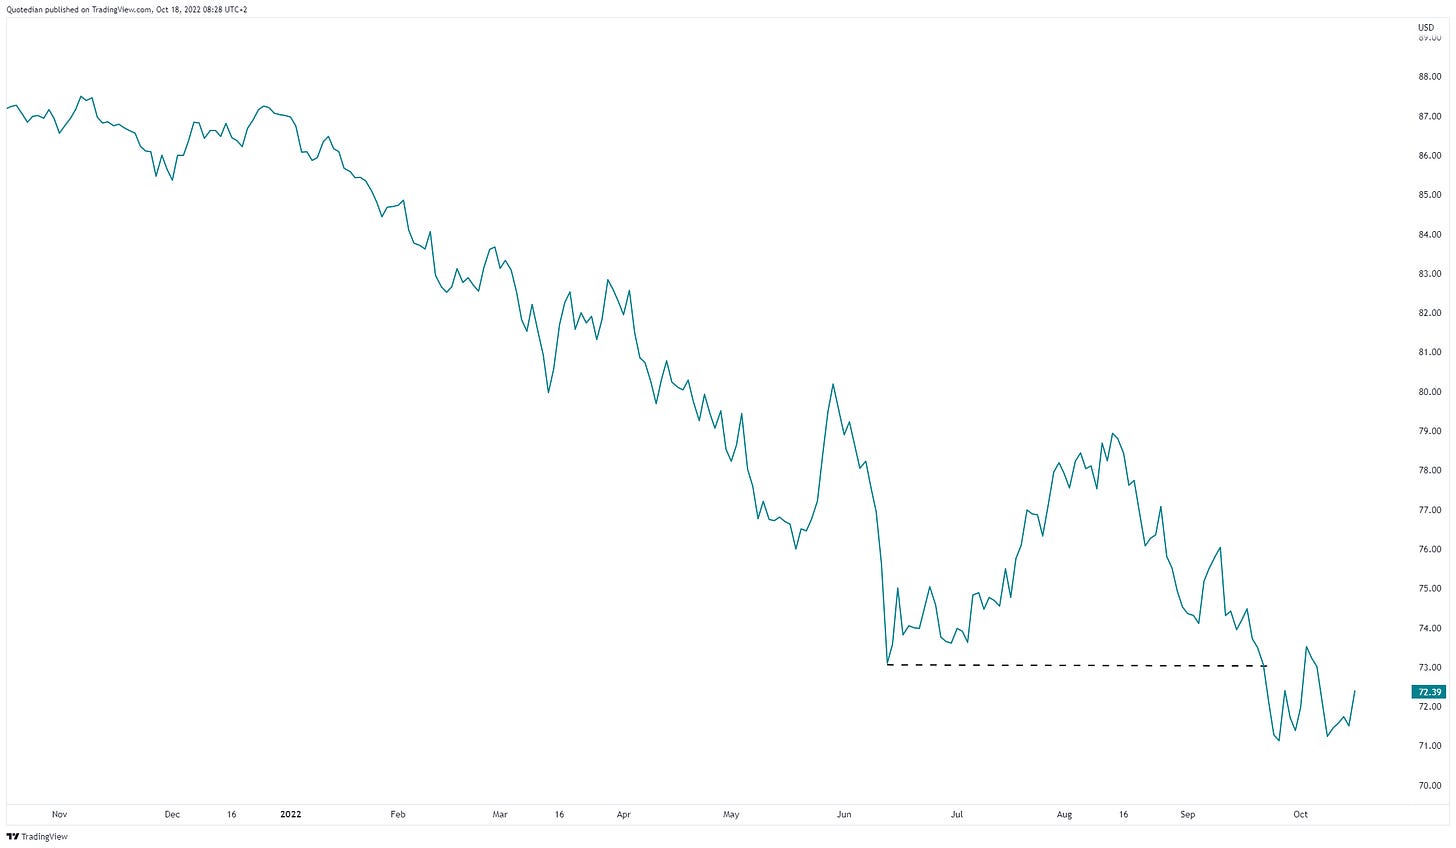
One element that may be supportive to an equity rally is the US Dollar, which is showing signs of having found a short-term top. Here’s the US Dollar Index (DXY):
On the EUR/USD, this looks as follows:
As mentioned, I need to keep it short today, but make sure to tune back in tomorrow.
Also, do not forget to hit that “Like” button and share The Quotedian with whomever you may think could be interested (and if you think it is worthwhile sharing, of course 😉).
Have a great Tuesday!
CHART OF THE DAY
Equity markets are trying to hammer in a bottom, and some encouraging signs are there. However, there are also several hurdles to overcome. First of all, the S&P 500 must move above its 20-day moving average (1), which will also lift it above the downward trend channel (note: right now, futures are achieving this). Then, the Friday Oct 7th gap (2) would need to be filled, without stocks turning lower again and then close by, the early October high at (3). Only then, would the next move be into the cluster zone of resistances around the 3,900 level …
Plenty to do, let’s get started!
Thanks for reading The Quotedian! Subscribe for free to receive new posts and support my work.
DISCLAIMER
Everything in this document is for educational purposes only (FEPO)
Nothing in this document should be considered investment advice
Past performance is hopefully no indication of future performance


