Sell in May and Go Away
The Quotedian - Vol VI, Issue 29 | Powered by NPB Neue Privat Bank AG
"Don't judge each day by the harvest you reap but by the seeds you plant."
— Robert Louis Stevenson
DASHBOARD
CROSS-ASSET DELIBERATIONS
It’s this time of the month were we sit down together and jointly have a look at performances of several asset classes for the month just gone by. Plus, we also check what does performances mean on a year-to-date basis. And if that were not enough already, we also zoom out and have a look at some monthly candle charts in order no to lose the big picture.
And without further ado, off we go…
The good old Quotedian, now powered by Neue Privat Bank AG
NPB Neue Privat Bank AG is a reliable partner for all aspects of asset management and investment advice, be it in our dealings with discerning private clients, independent asset managers or institutional investors.
Starting with global equity markets, generally, it has been another good month for risk-on-inclined investors:
As a reminder, the “thick” bars are the %-month returns in April, whilst the semi-transparent bars are the %-year-to-date returns.
And the Oscar for the top-performing market in April goes to …
India!
Should the 12% drawdown, induced by the Adani “report”, have been bought?
Perhaps.
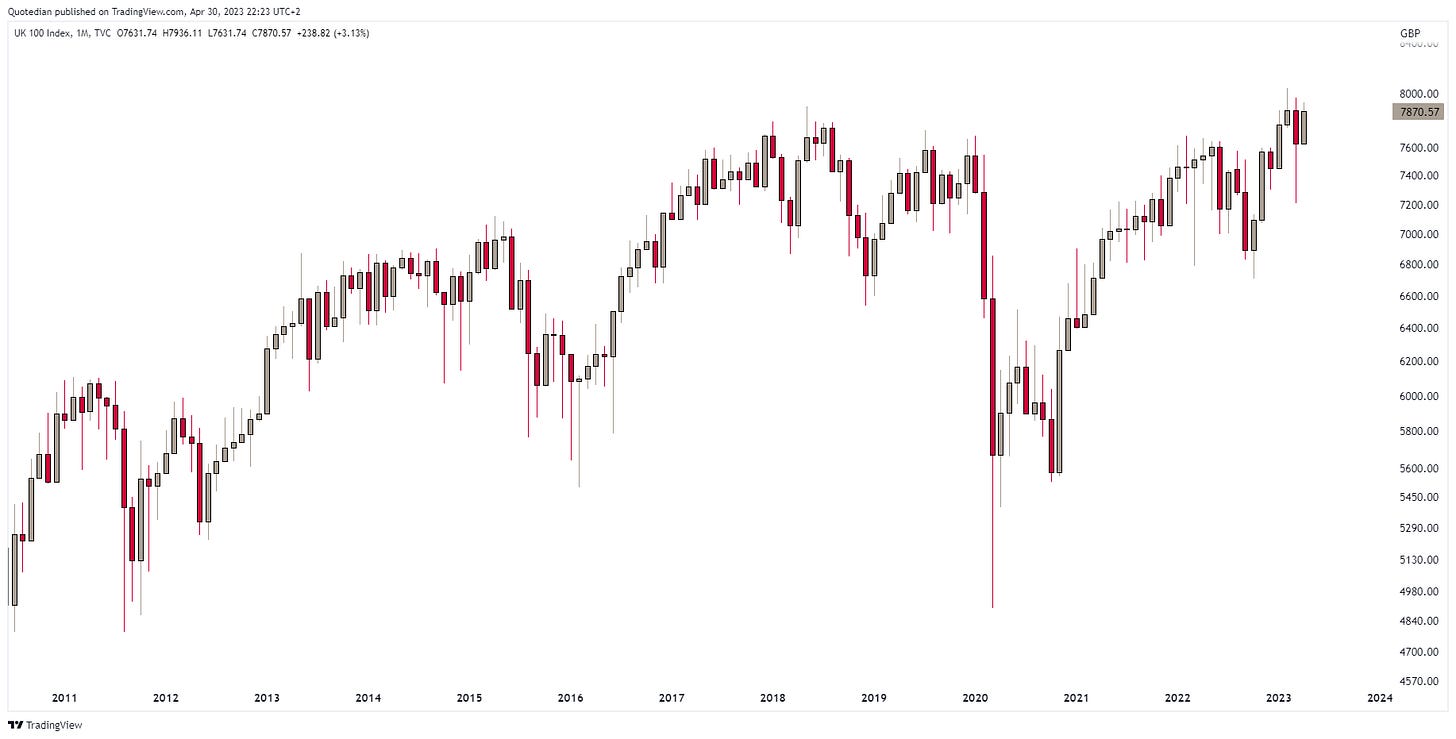
Second best-performer? A country loosely associated with India - Great Britain:
The FTSE-100 did not reach a new all-time high in April, but did see its second-highest closing high ever - not bad for an economy that seems to be in shambles. Or maybe investors are fleeing into equity markets from what continues to be a stubbornly high inflation reading?
At the other end of the monthly performance spectrum, we find China Mainland and Hong Kong stocks, both seemingly still digesting the strong gains seen at the end of last year.
The top performing market on a year-to-date basis is now Nasdaq, strongly impacted by the AI stocks (META, NVDA, AAPL, et al). Here are some YTD returns from the top performers in the NDX:
And here is the monthly chart of the index itself:
Moving above 14,000 would be a clear win for the bulls.
However, the comparison between the market-cap weighted Nasdaq (grey line) and its equal-weight version (red line), reveals that leadership in the index is getting thinner, i.e. fewer companies are participating to the upside:
A phenomenon we had also already observed and discussed on the S&P 500:
Let’s finish the equity indices section by looking at the S&P500, the one index that rules them all and which starts looking increasingly constructive:
Turning to equity sector performance, the monthly statistical table quickly reveals that the strongest YTD performers consolidated some of their gains in April:
Top performing sectors in April were Health Care, Energy and maybe slightly surprisingly Financials!
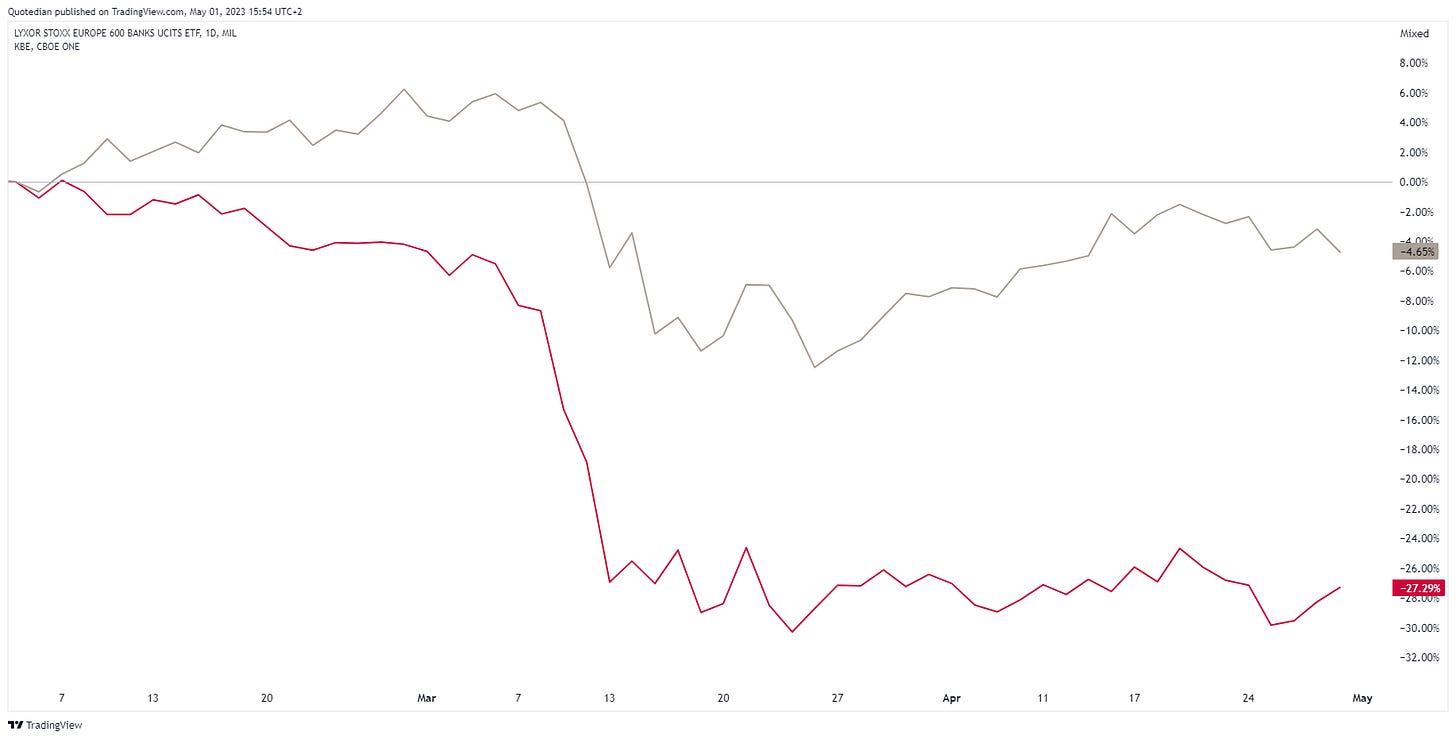
Regarding this latter sector, since the onset of the mini financial crisis in February, there was definitely a difference whether you had your money in European Banking stocks (grey line) or the US counterparts (red line):
With JPM announcing their take-over of First Republic Bank this morning, maybe we arrived at an important inflexion point for US regional bank stocks? Here’s the SPDR US Regional Banks ETF:
Or maybe JPM just felt its position as the world’s largest bank threatened by Apple turning more and more into a bank itself?
ESG-sensitive readers please skip the next paragraph:
But, hey, maybe ExxonMobil is the perfect bank?! Think about it, according to this Bloomberg screen the oil giant has $37bn and change in debt for which it pays a bit more than 3% (which is also the dividend yield they pay, btw):
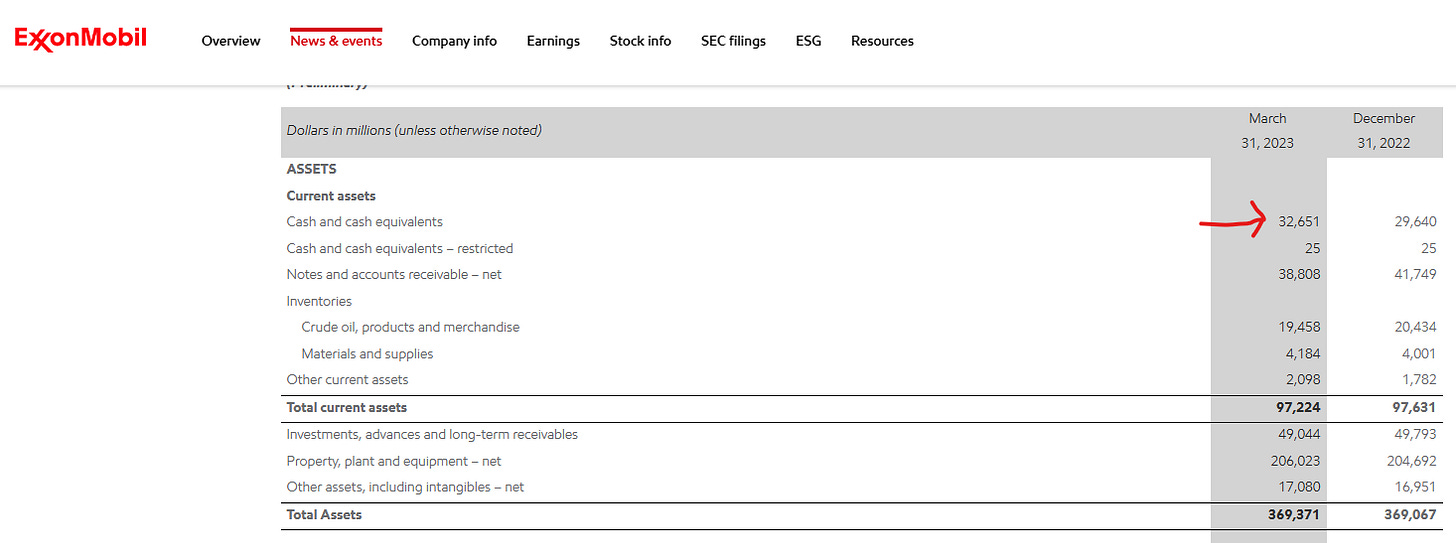
The company has also $32.6 billion of cash on their books, according to their March 31, 2023 statement:
Now, if they go and place those $32.6 bn with Apple at a yearly rate of 4.15% ….
Ok, time to wrap up the equity section with our two tables of the 25 best-performing stocks in the US and Europe on a year-to-date basis and their fortunes over the past five days. Starting with the US:
What a week for META (company formerly known as Facebook)
and Mexican fast-food chain Chipotle:
And here’s the list of the Top 25 European stocks:
At first glance, there seems to be a bit of a tech revolution going on in Europe right now…
Time to turn our attention to fixed-income markets, where the statistical performance kind of confirms the felt boringness during the month of April:
Most of the action actually took place at the very short end of the curve, where futures markets went from implying 2.5 rate cuts into year-end
to ‘only’ 1.5 cuts as of today.
I truly doubt any cuts will take place, tbh and imho.
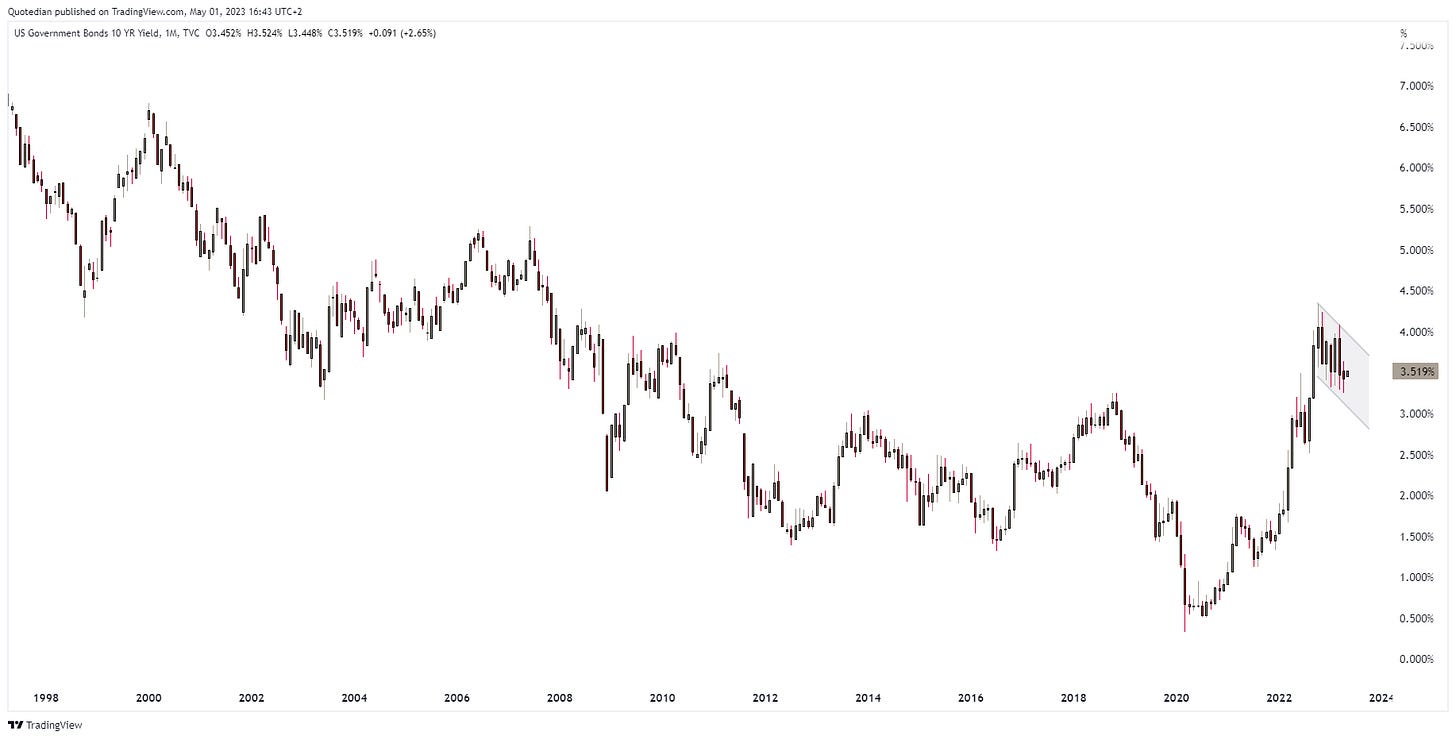
US 10-year yields remain in a clear consolidation pattern:
Now, please note, if this is indeed a consolidation pattern also known as a pole-and-flag formation, then a break to the upside (at approx. 4.0%) would mean that rates from a technical perspective should move well north of 5% … just saying. Here’s the same yield again in a historic context:
Meanwhile, over in Europe, the tension over which direction rates will resolve their current consolidation period is also rising. Here’s the German 10-year Bund:
Credit spreads (below Moody’s BAA - AAA yields) continue to be in no man’s land:
The table of US Dollar %-performance versus other major currencies reveals that April was a month of mixed fortunes for the Greenback:
For example has the Brazilian Real strengthened a lot, doubling the year-to-date gains previously achieved, though the current pair still trades within its nearly three-year-old range:
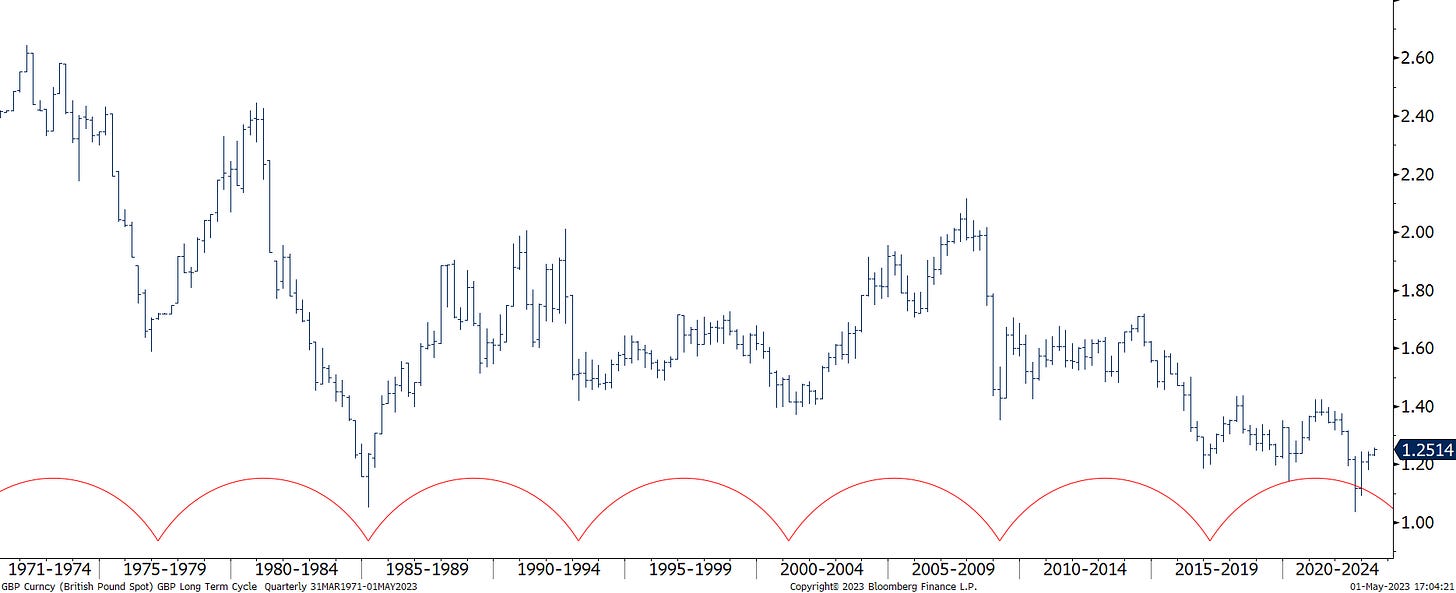
The cable (GBP/USD) also continued its ‘miraculous’ recovery, now trading at above 1.25 - miles away from the September panic low at 1.03:
Though the 8-year cycle we started looking at many, many years ago would still point to further sterling weakness:
The Swiss Franc continues to be bloody strong, not only versus the USD, but also as measured versus the glittering wonder that is the Euro, firmly below parity now:
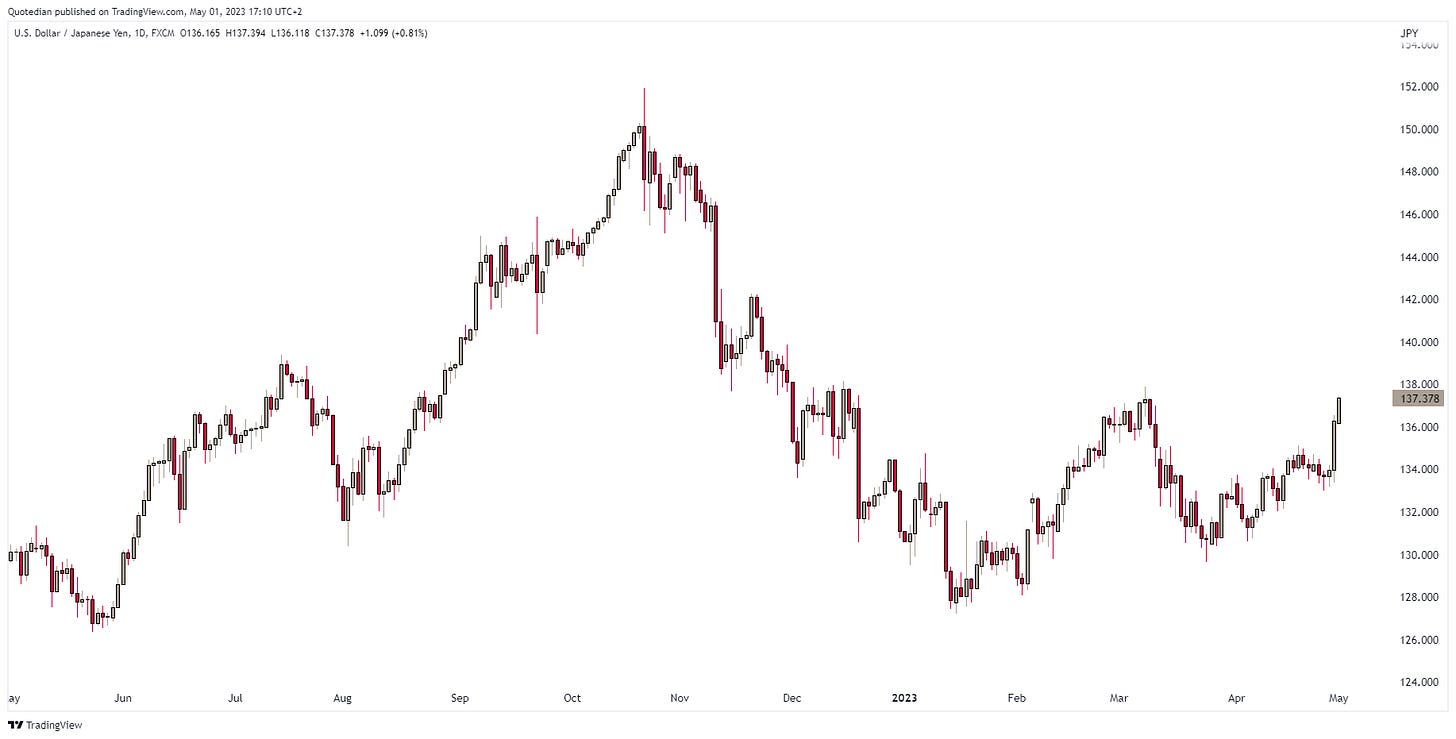
The Japanese Yen is weakening again after the new pilot in the BoJ driver’s seat failed to give the market a clear direction of the bank’s interest rate policy going forward. And markets hate uncertainty:
Maybe the June meeting is too far away for an update and the market will force the BoJ’s hand before that?
Let’s have a look at Bitcoin now and use this cryptocurrency as segue in the twilight zone between FX and commodities:
The $30,000 price level continues to resist the bulls, but probably still only a question of time.
Not unsimilar to Bitcoin, Gold is also struggling to take out its long-term resistance at $2,000:
And also similarly, it only seems to be a question of time until it does …
A move in Silver above $29 would probably be the opening bell for a continuation of the Gold/Bitcoin rally:
Now, as we have moved softly into the commodity space, let’s also look at performance tables here. Commodity ‘sectors’ first,
followed by some of the more popular commodity futures:
Sugar prices stand out for the 20%+ rally just delivered, expanding YTD gains to nearly 55%:
Hand on heart, it has been a while since I traded Sugar in the pits (as in never) and I would consider myself anything else than in the know. Apparently, there are some concerns regarding India’s output quota, but maybe you have more info? Don’t be shy, chime in:
Ok, time has come to hit the send button. Make sure to hit the like button if you liked, or hit the delete button if you did not like ;-)
Have a great rest of labour day!
André
CHART OF THE DAY
“Sell in May and go Away” is an old Wall Street adage. Looking at the seasonality heat map of the S&P 500 below one would wonder why. Turns out May has been up 9 out of 10 times over the past decade …
Stay tuned!
Thanks for reading The Quotedian! Subscribe for free to receive new posts the moment they are published.
DISCLAIMER
Everything in this document is for educational purposes only (FEPO)
Nothing in this document should be considered investment advice
The views expressed in this document may differ from the views published by Neue Private Bank AG
Past performance is hopefully no indication of future performance


