

Shake It Off
Vol VIII, Issue 24 | Powered by NPB Neue Privat Bank AG

“Plus ça change, plus c'est la même chose”
— Jean-Baptiste Alphonse Karr
Enjoying The Quotedian but not yet signed up for The QuiCQ? What are you waiting for?!!

Just before entering our (hopefully?) well-deserved summer-writing-pause I mentioned a possible rebranding of your favourite weekly market deep dive (www.thequotedian.com) and its accompanying daily “under-the-hood” observing sister publication (www.quicq.ch).
After thoughtfully sipping cocktails at many of Costa del Sol’s fantastic Chiringuitos

and deeply deliberating

about possible changes to these two publications, I finally decided to heed to the old proverb “If it ain’t broke, don’t fix it.”
So, here we go, continuing true to Jean-Baptiste’s exclamation of nearly 200 years ago!
As we just finished August (four months to go to new year’s eve!!), this week’s focus of The Quotedian will be the month just gone by, also in the context of year-to-date performance. To newcomers to the letter (thank you!), our end of month editions tend to focus on performance-related data, plus we use a bunch of monthly candle charts to keep abreast of the longer-term picture.
In that context, today’s title of The Quotedian, “Shake it Off”, does not really relate to Taylor Swift’s engagement to a big bloke,

but rather to the market’s capability of shaking off nearly any worry this year:
Fed independence? Shake it off.
Inflation concerns? Shake it off.
Equity and credit valuations? Shake it off.
Geopolitical chitters? Shake it off.
Etc, etc, etc. Shake it off.
Hence, in case you need it to get through the following twenty minutes of charts or so, here’s Taylor for you:
(Hint: Play it three times for this 12 minute read…)

Turns out, that our fear of an increase in volatility, as outlined in a letter shortly before our summer recess, was pretty unwarranted (for now), as all major markets (except India) continued to steam ahead:
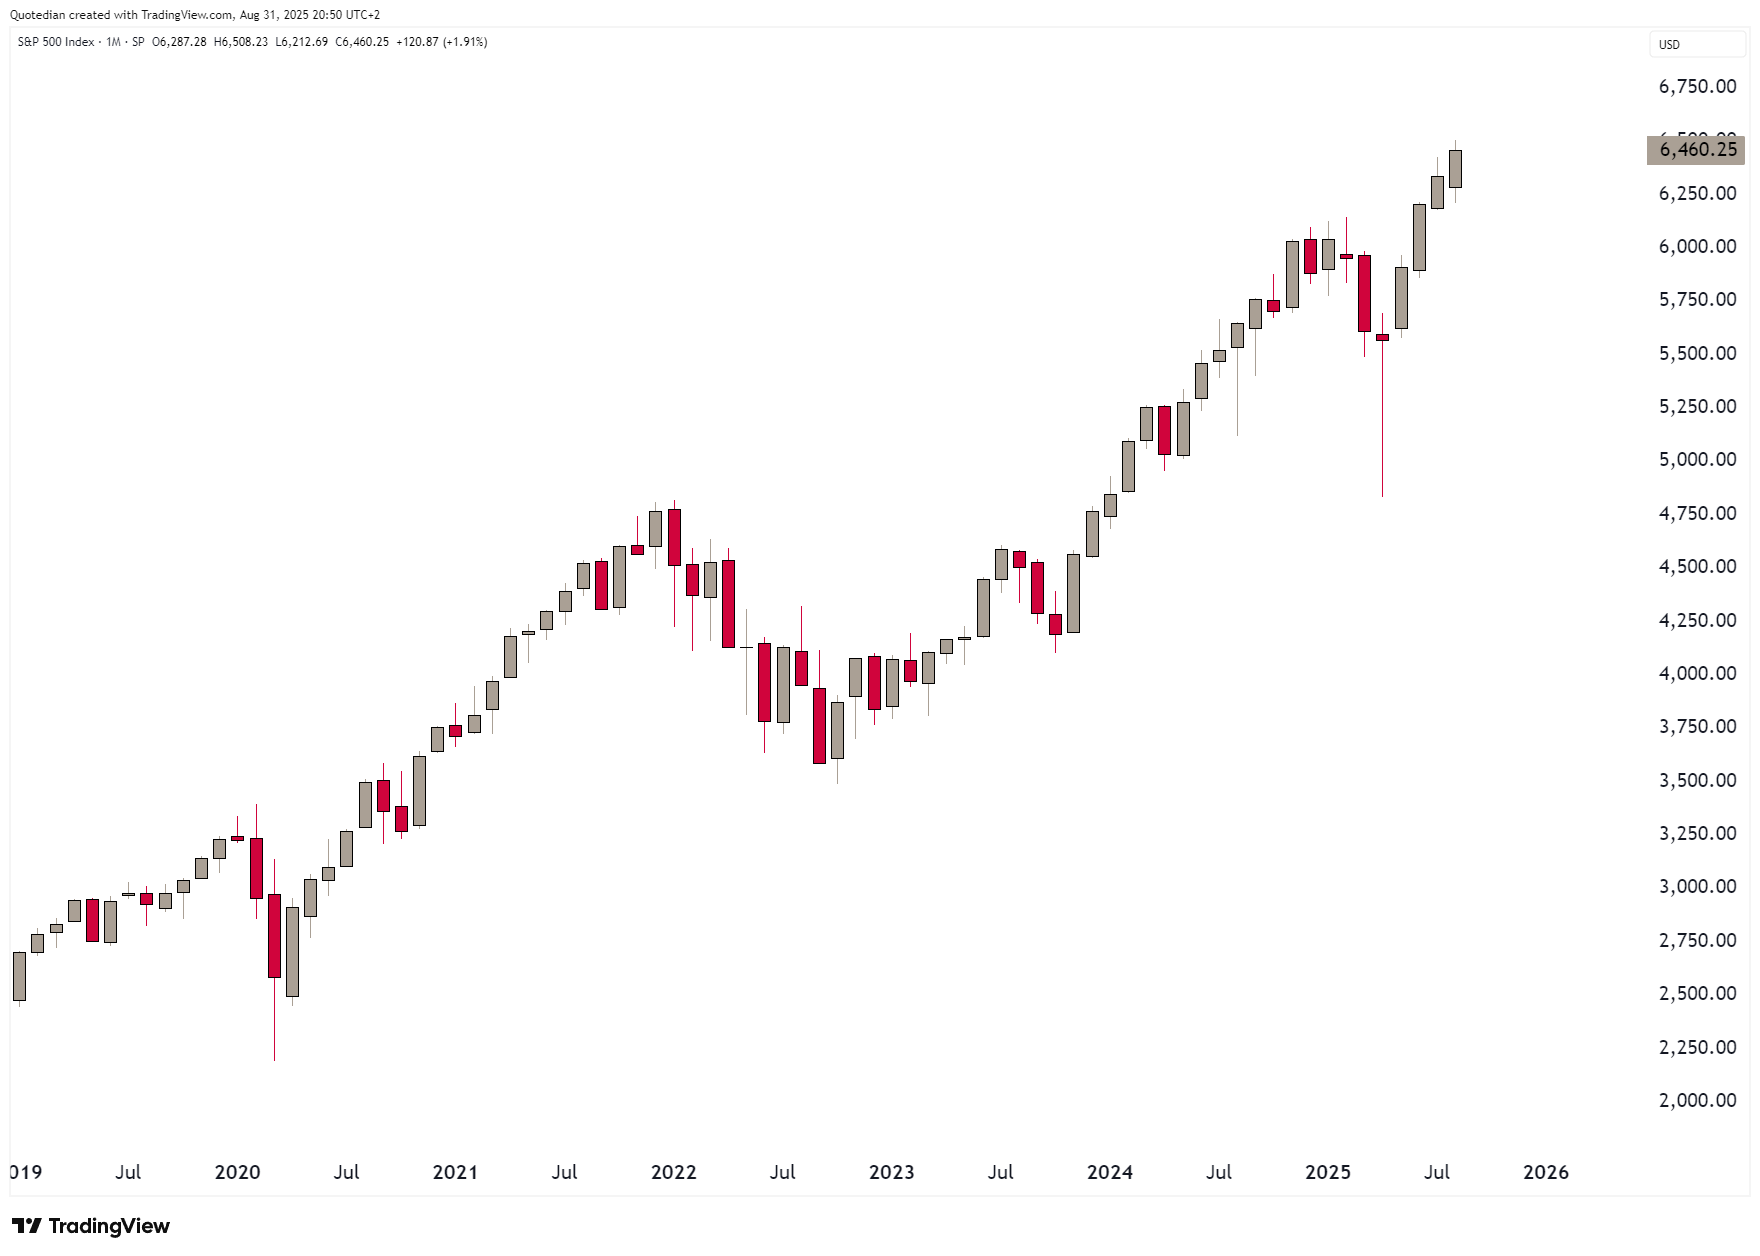
Since that ‘Morning Star’ candle pattern on the monthly chart in April, the S&P 500 has clogged in four consecutive strong monthly advances:
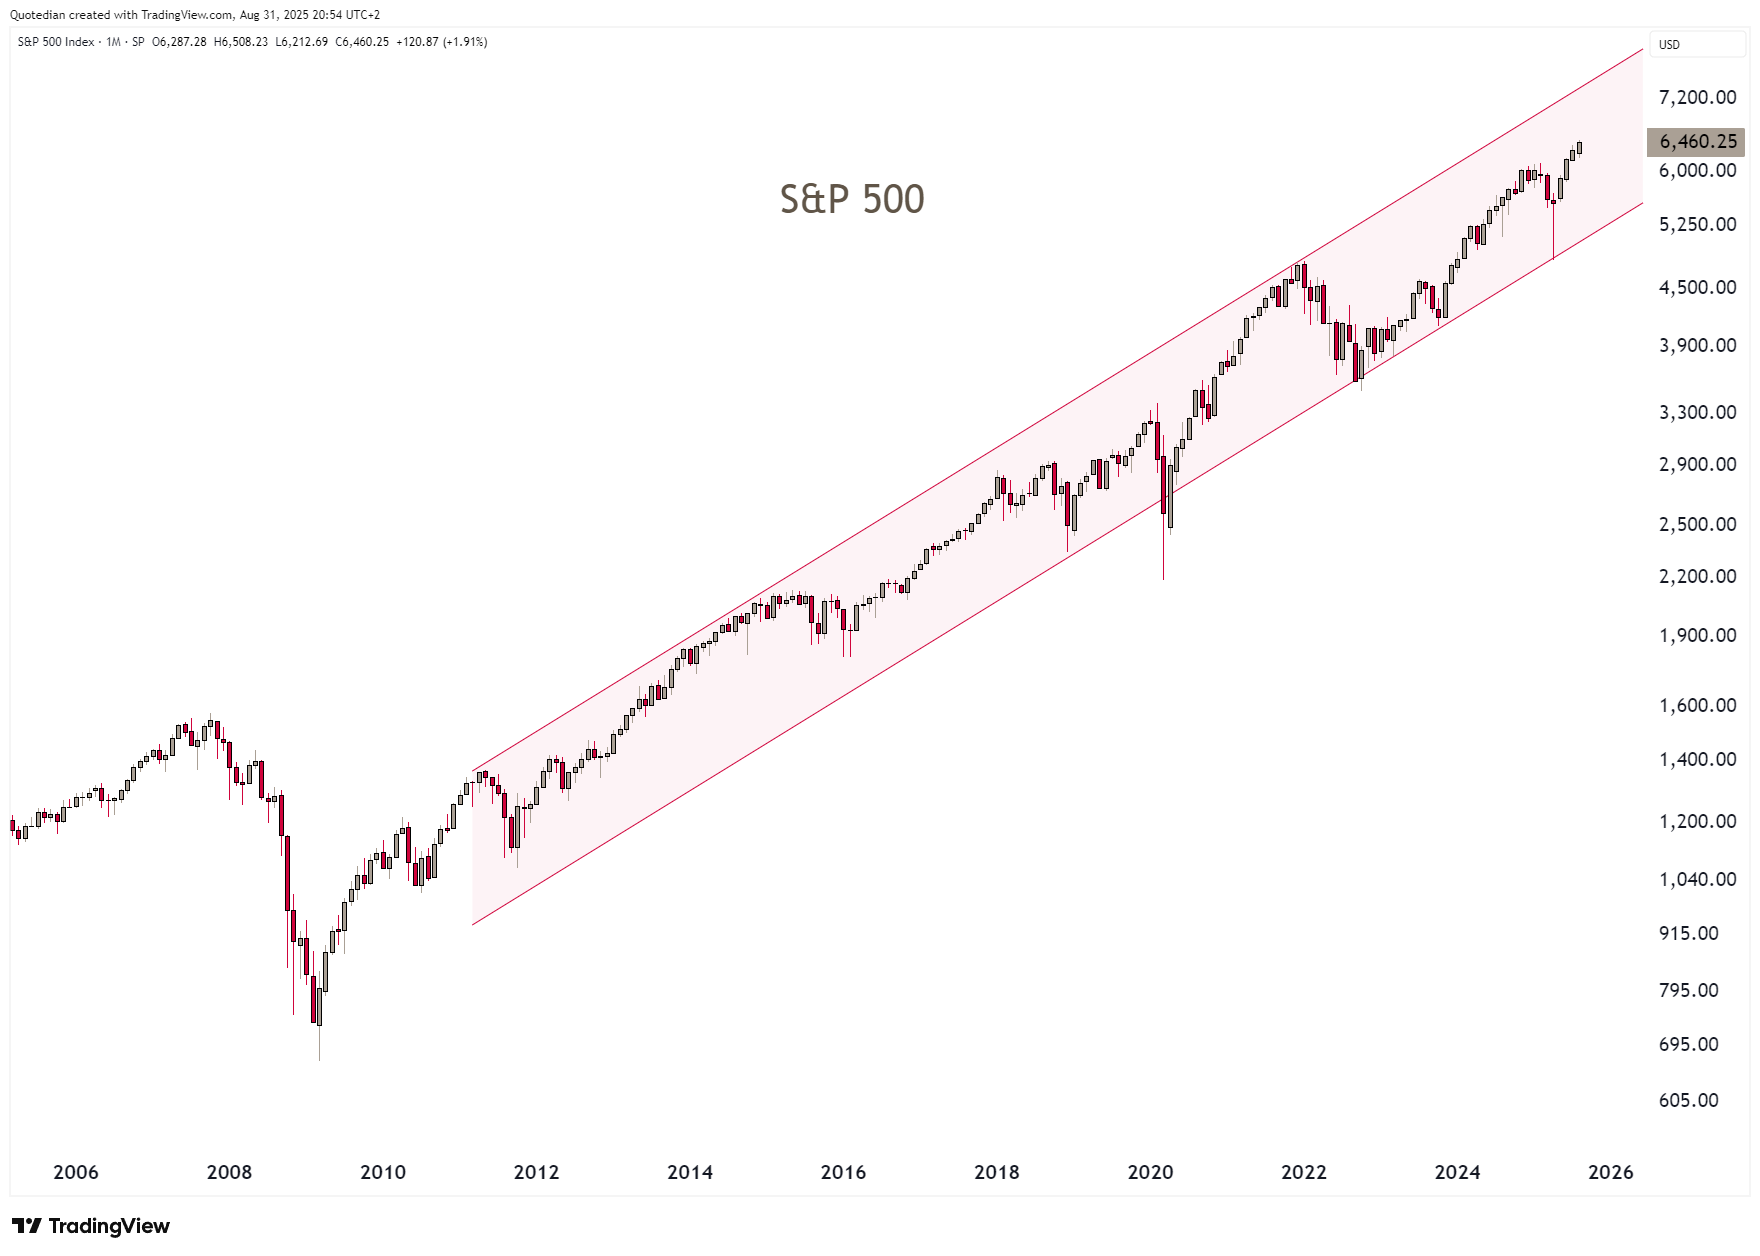
Zooming out on that same monthly S&P 500 chart, we note that US stocks remain well within their defined uptrend since the GFC ended more than 15 years ago:
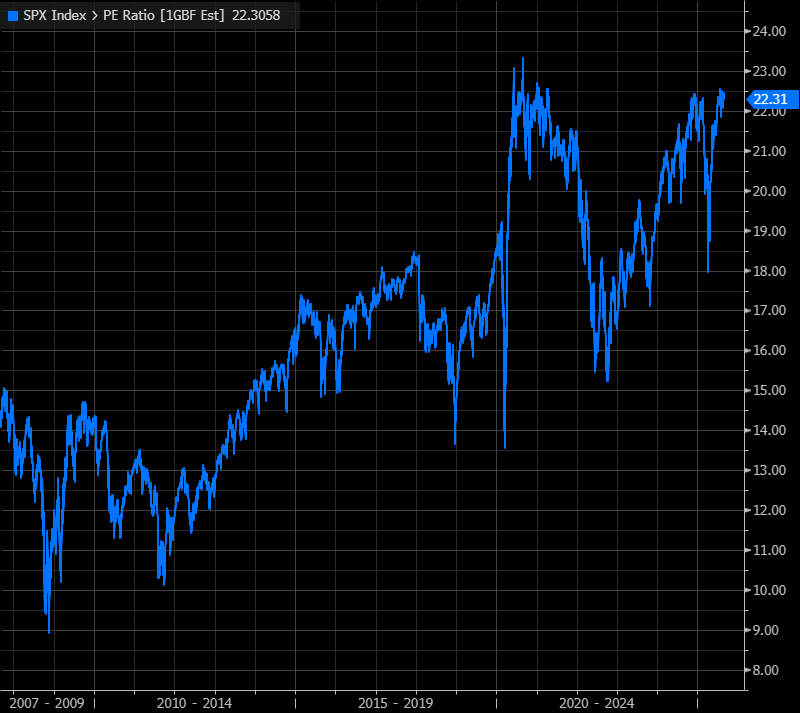
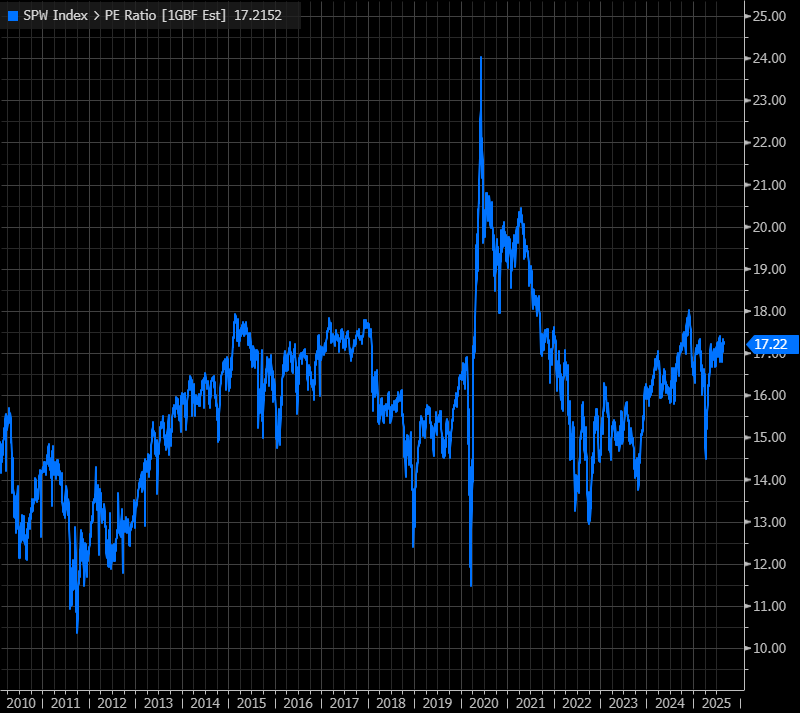
The bad news is that most of this gains have come on the back of a rising P/E ratio (i.e. risk-on expansion), at least from a market-cap weight aspect:
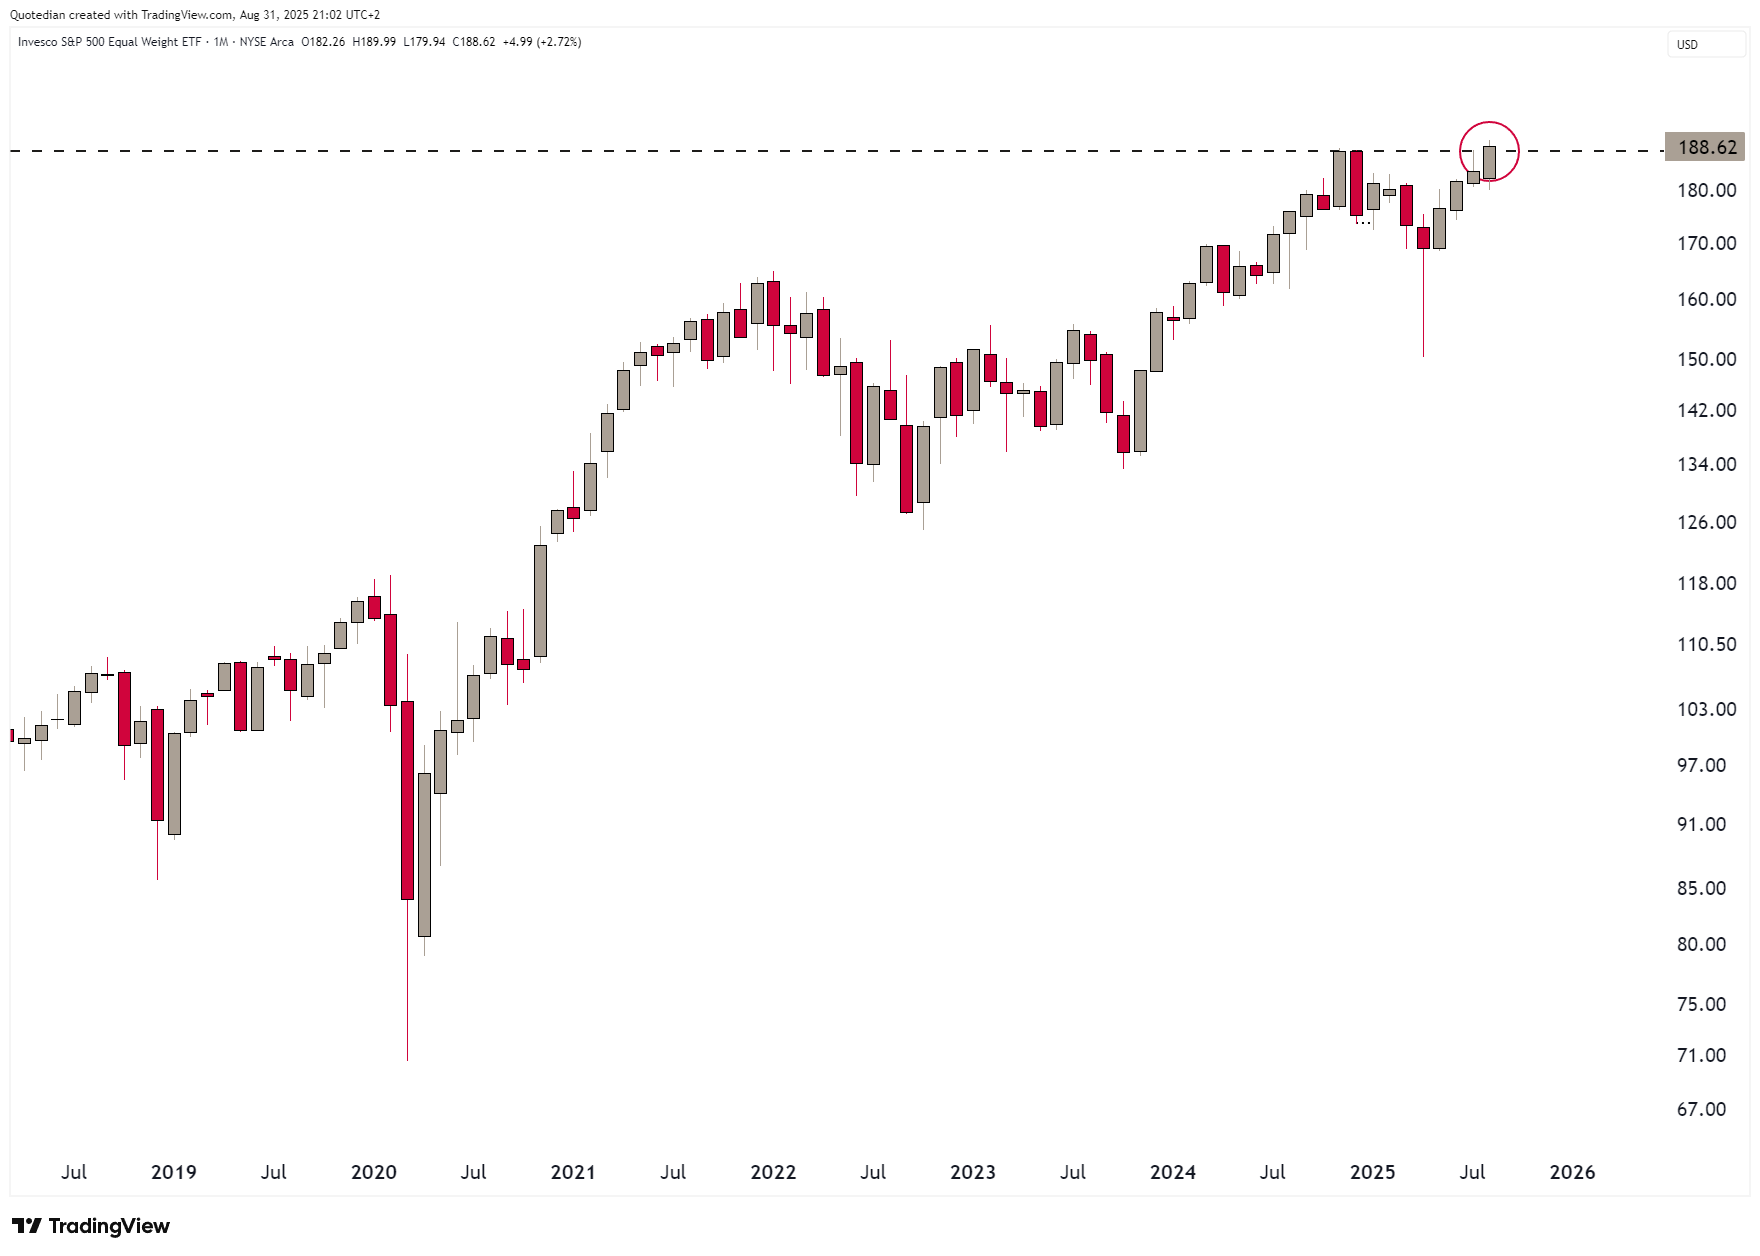
A slightly better news is that on a equal-weight basis, “things” do not seem THAT expensive:
But for the bull market to continue, we need rotation into those lesser expensive parts. The equal-weight S&P 500 hit a new ATH in August, which is a first encouraging sign of such rotation:
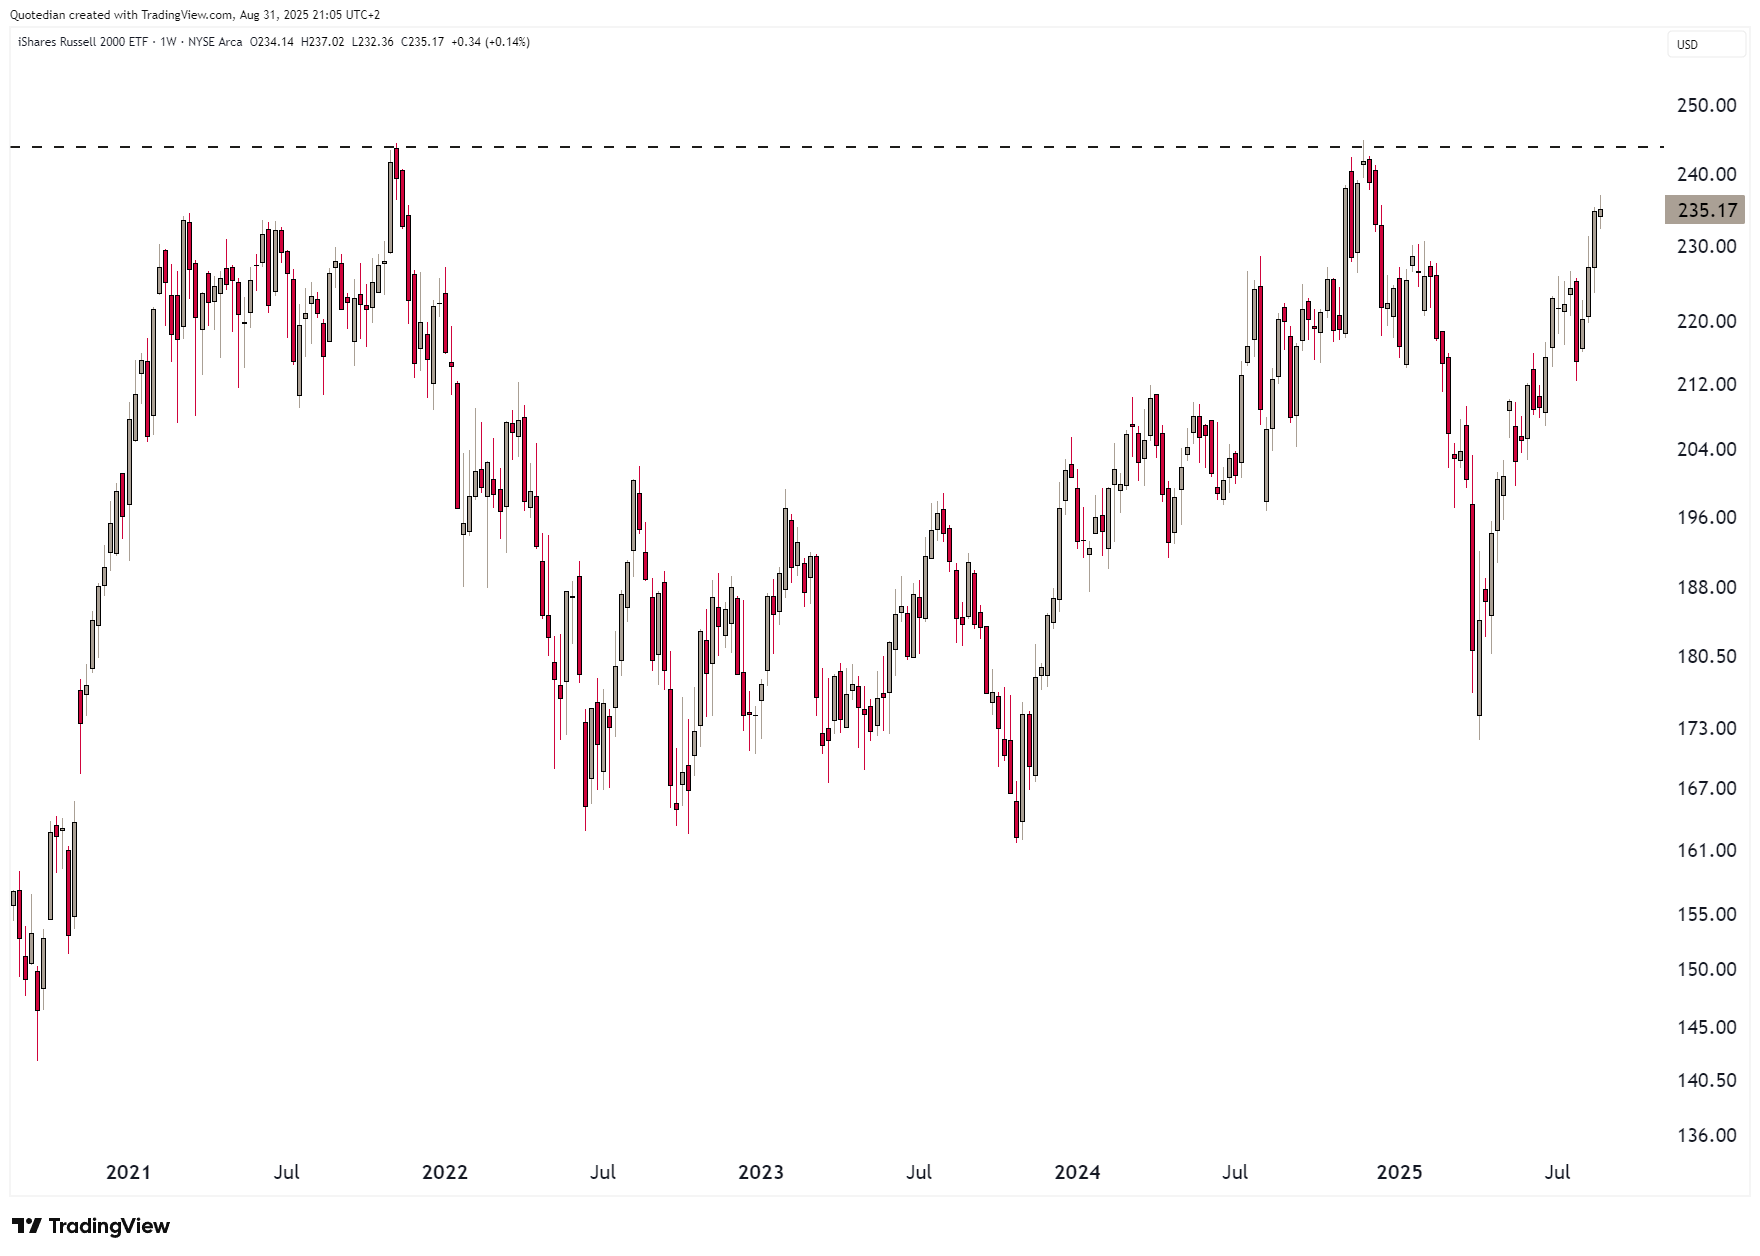
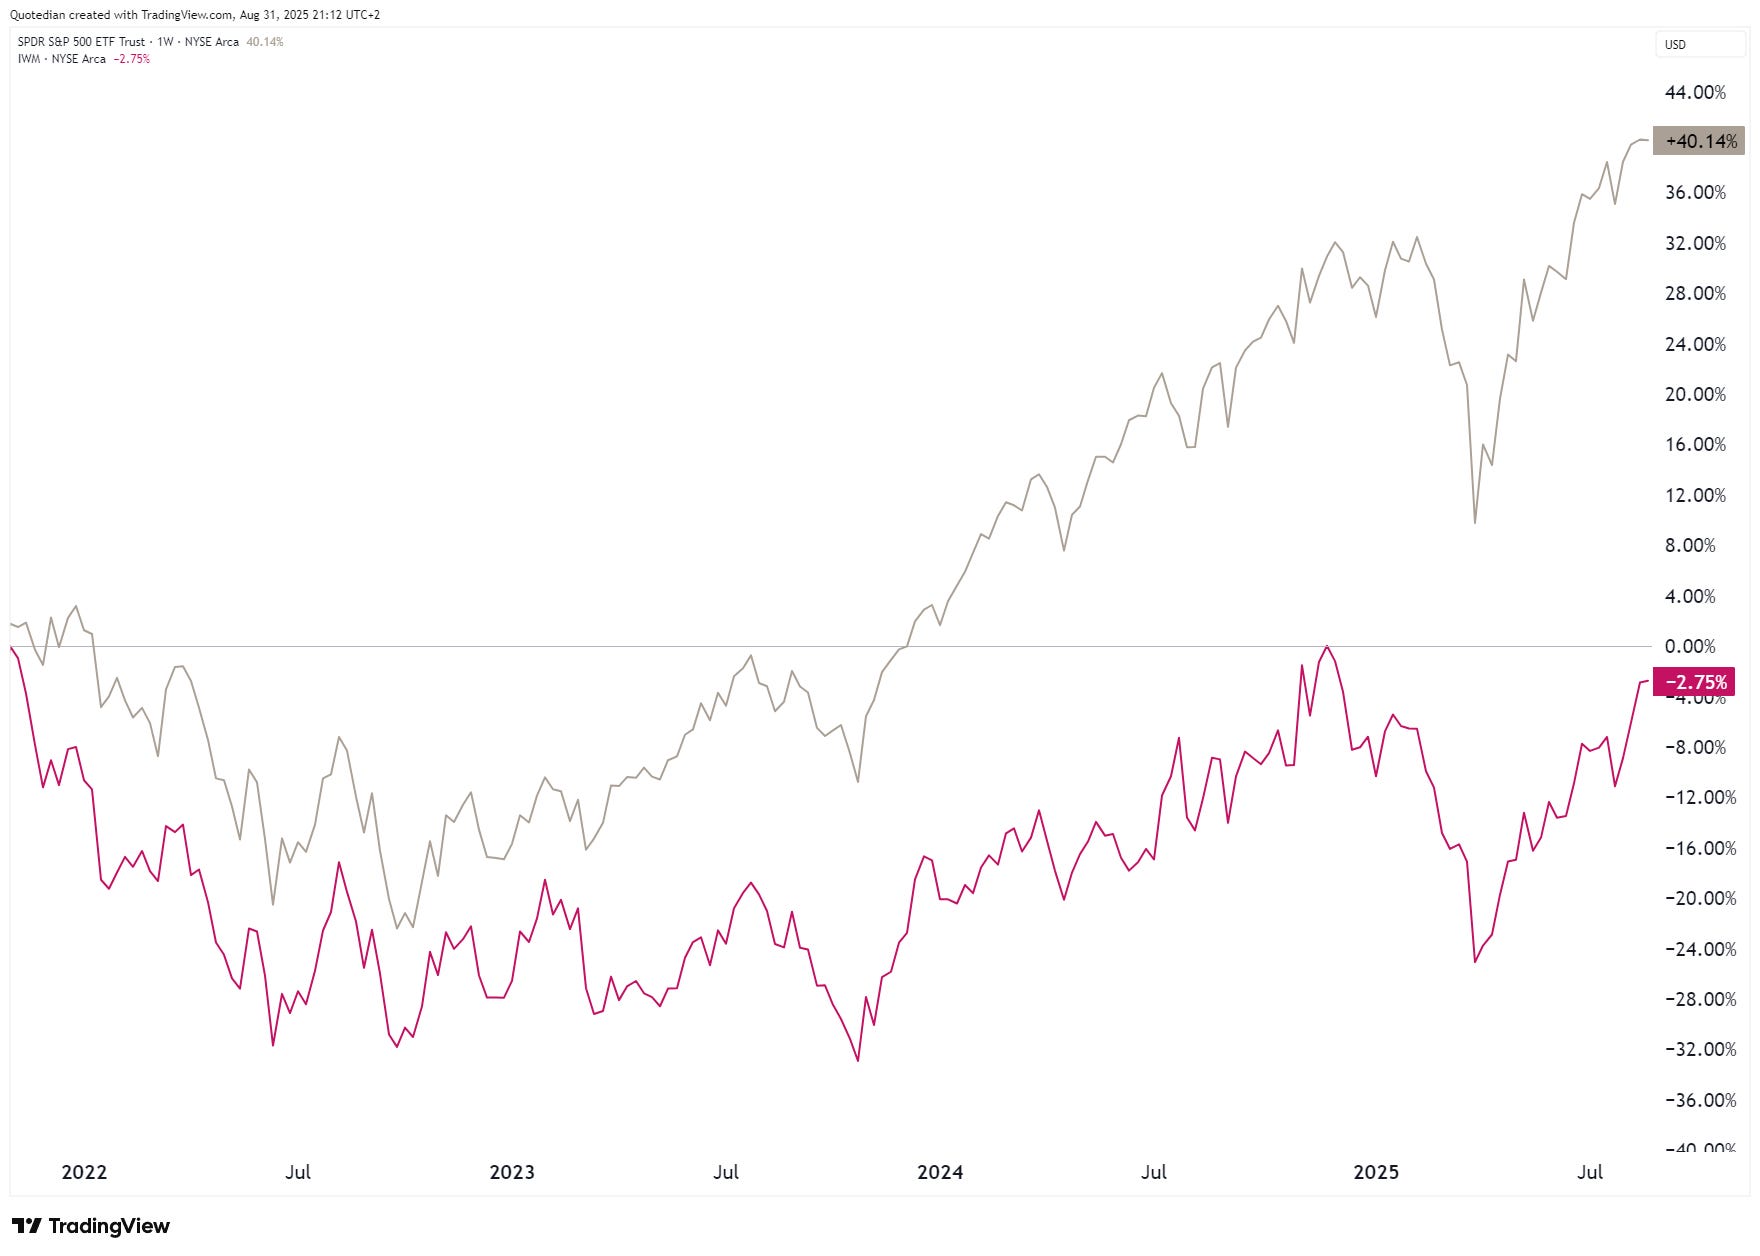
Further evidence of healthy bull market rotation comes from small-cap stocks (Russell 2000), which are suddenly less than four percent away from the 2021 closing highs (weekly chart):
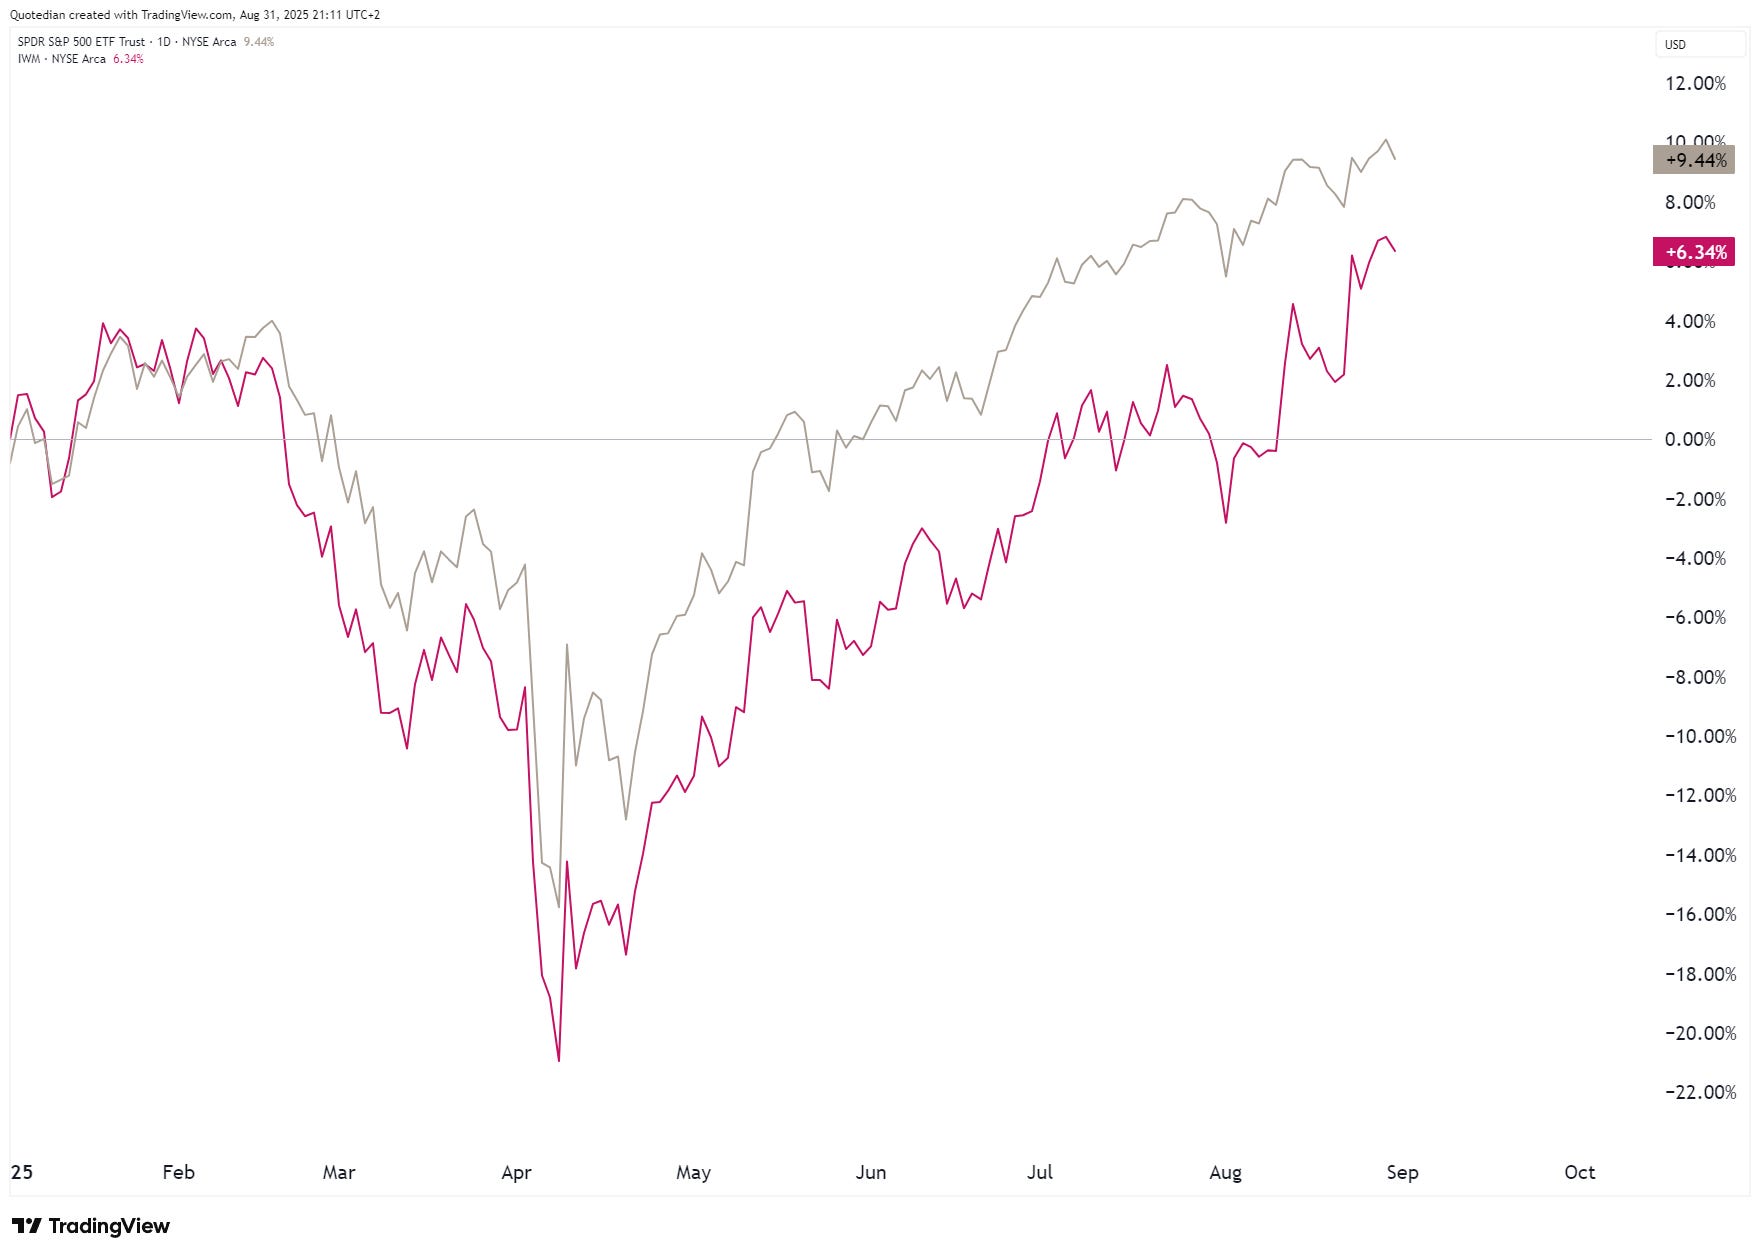
The catch-up of small cap stocks (IWM) to their big brothers (SPY) is very apparent in this chart:
Zooming out 5-years on the same chart, the possible potential becomes very apparent:
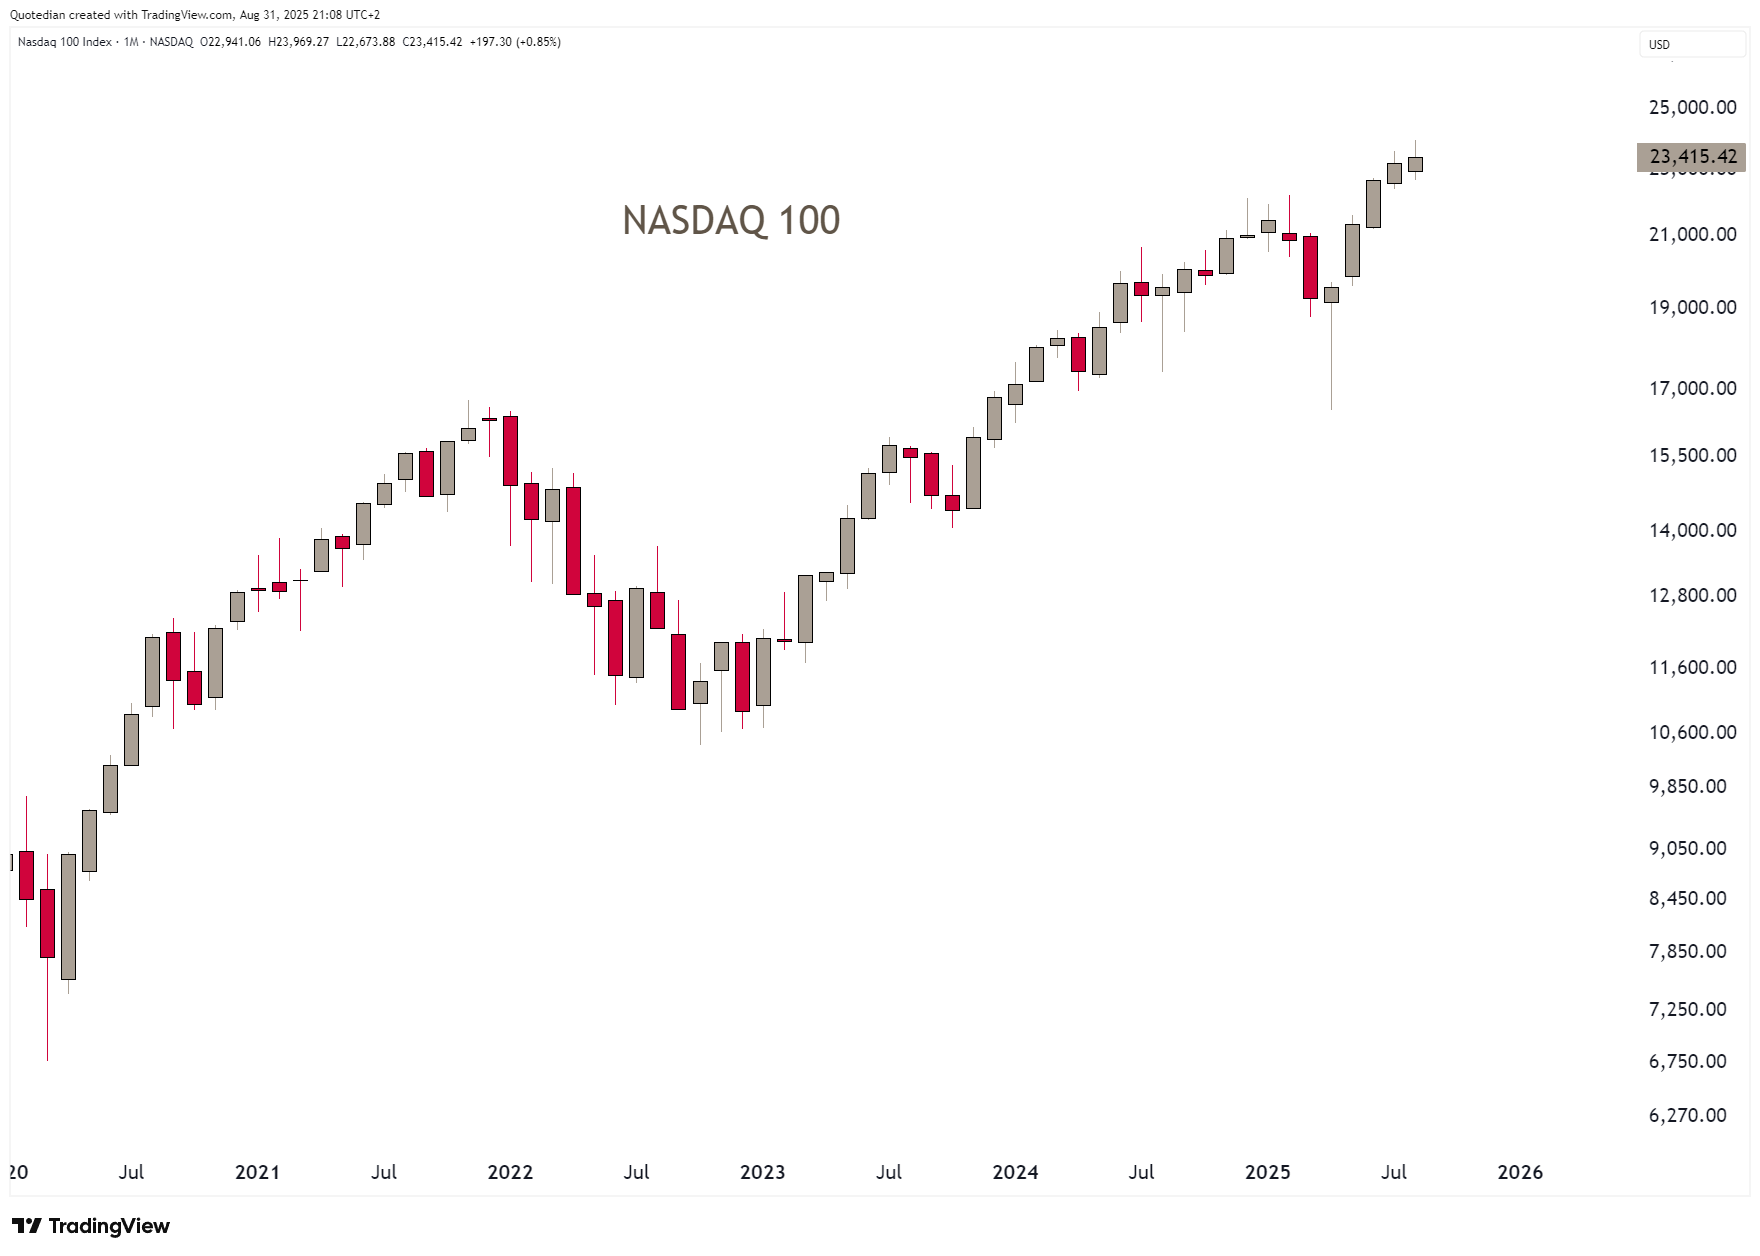
The Nasdaq-100 didn’t even close in the red in April, and is hence, into its fifth month of positive returns:
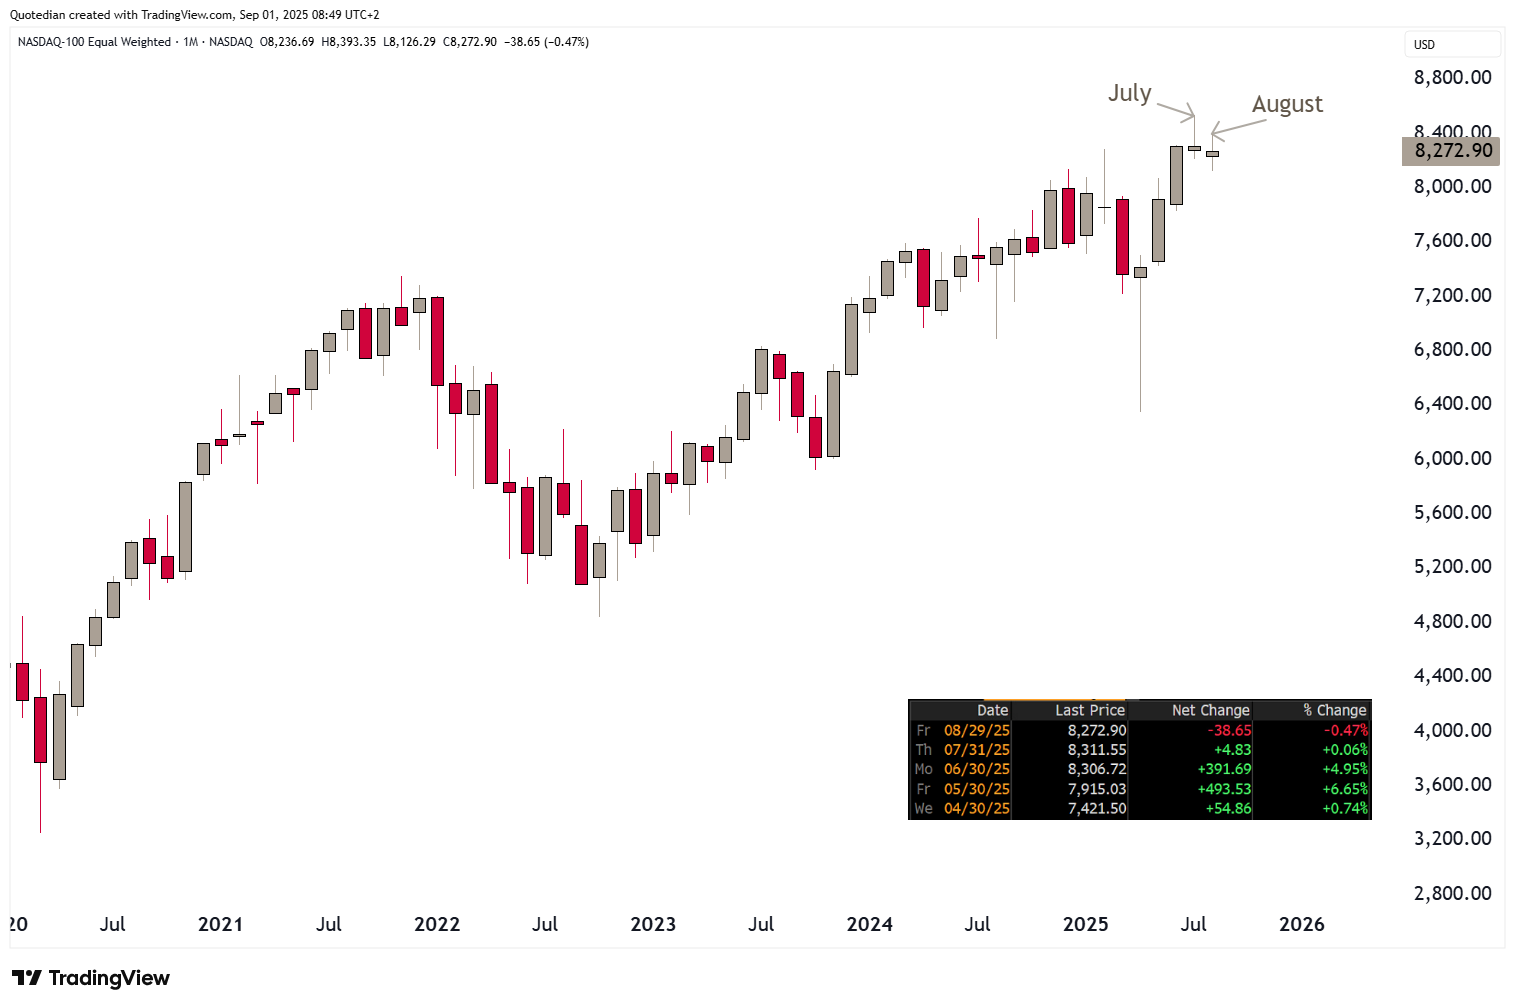
It is interesting to observe that the Nasdaq Equal-Weight index has been struggling to make significant progress over the past two months,
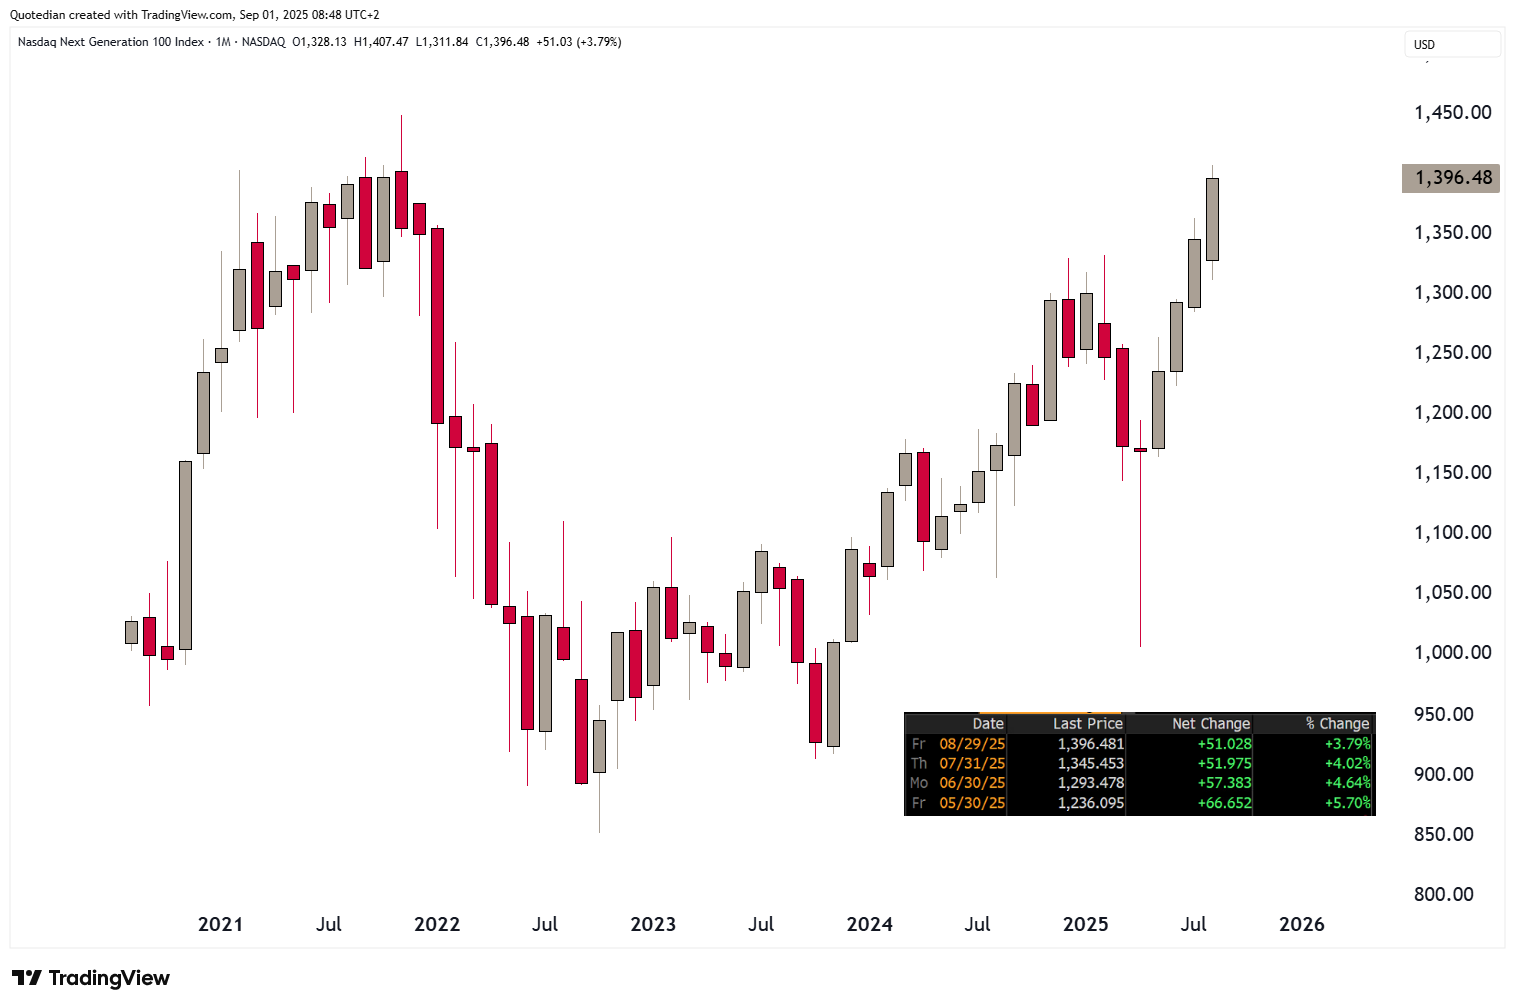
whilst the Nasdaq Next Generation 100 index, which tracks the 101st through 200th largest companies listed on the Nasdaq Stock Market outside of financials (financial companies are excluded, same as the Nasdaq-100) has made steady advances:
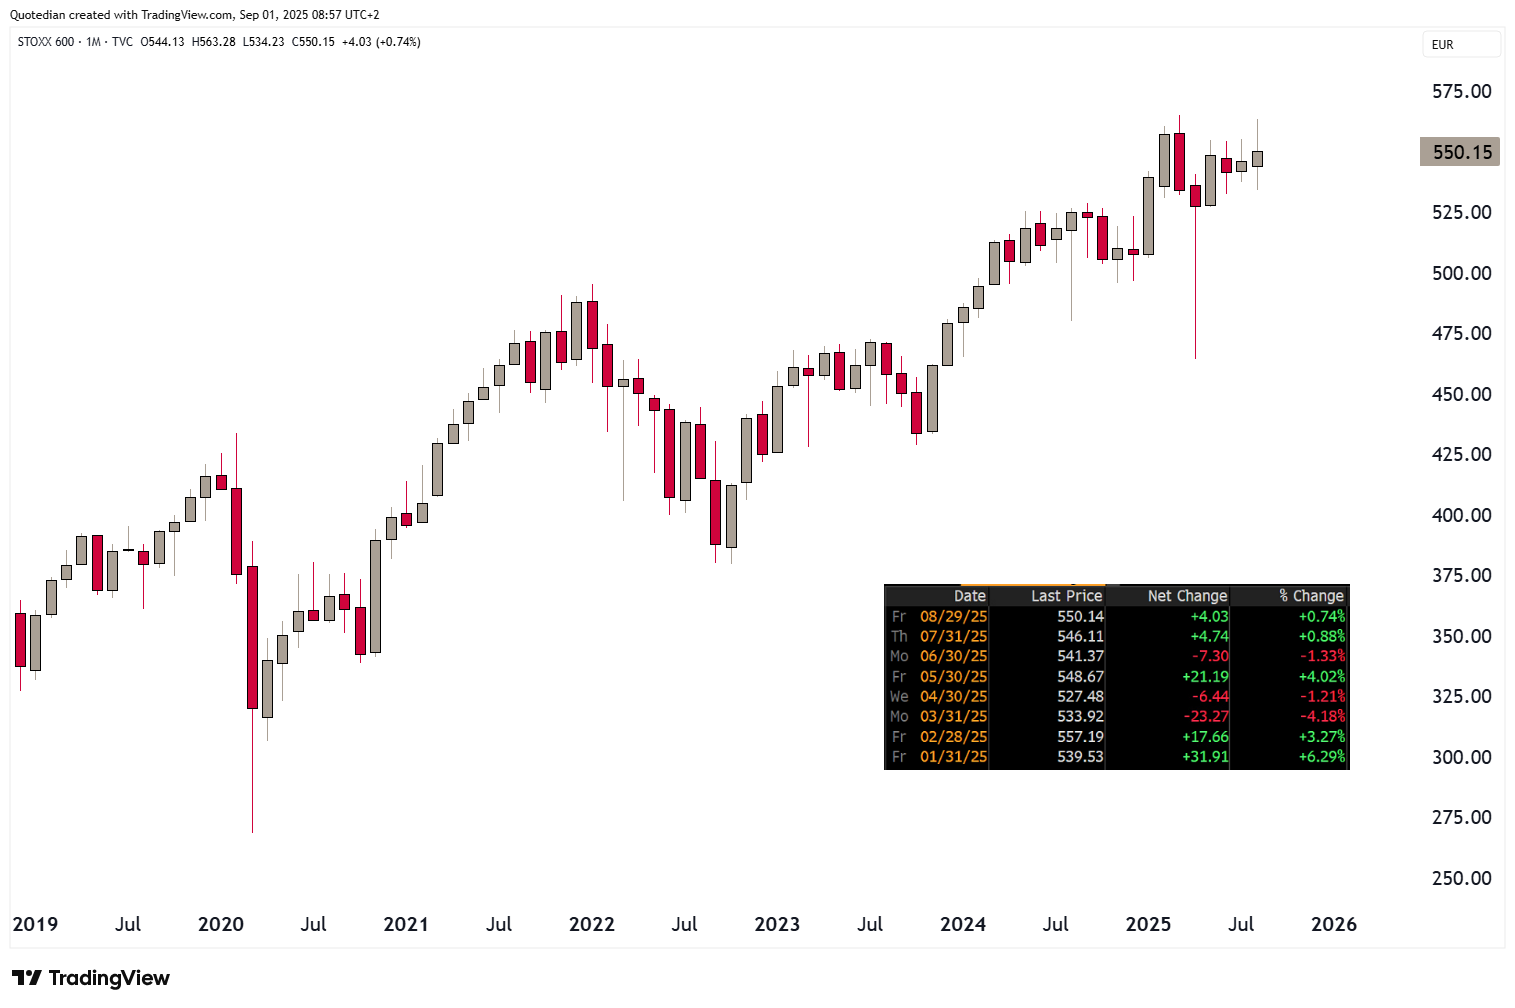
Hoping over to our side of the Atlantic, we note that the broad, pan-European STOXX 600 index has been, after a fulminant start to the year, treading water over the past three months:
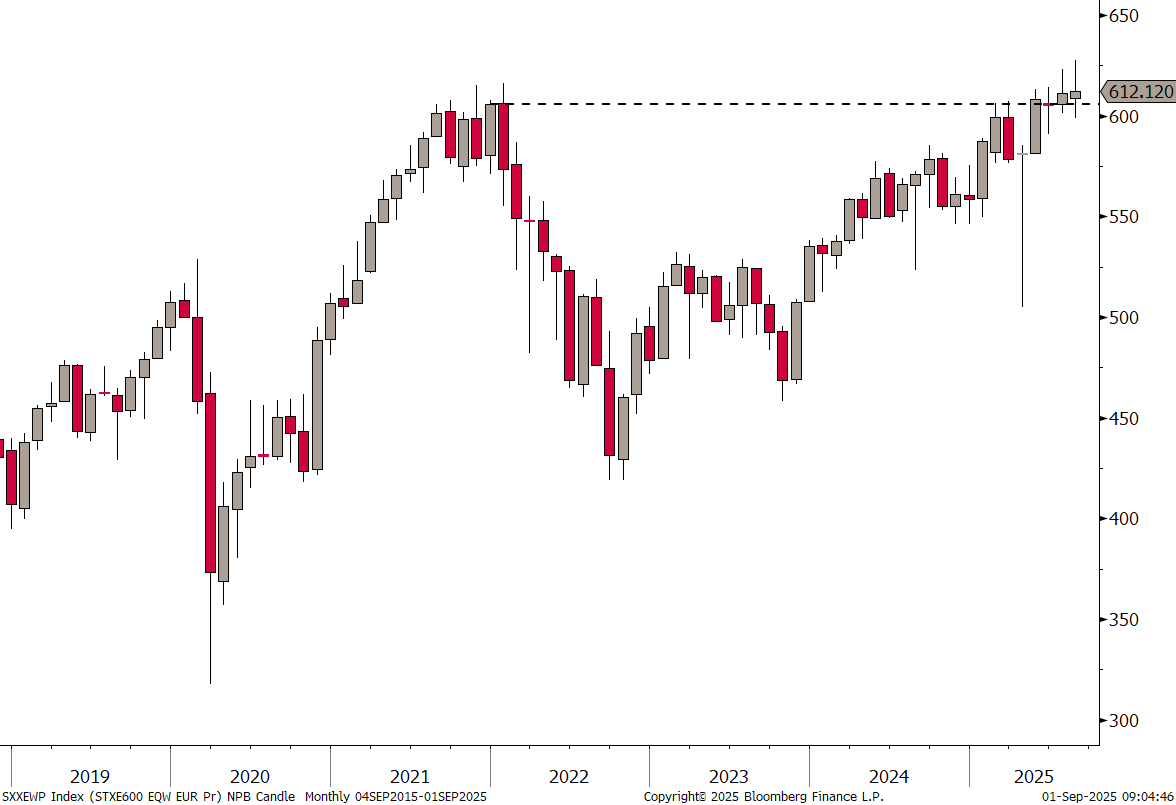
The equal-weight version however reveals a tad more of upside progress and especially shows that the index has closed for two months now above its previous (2021) all-time highs:
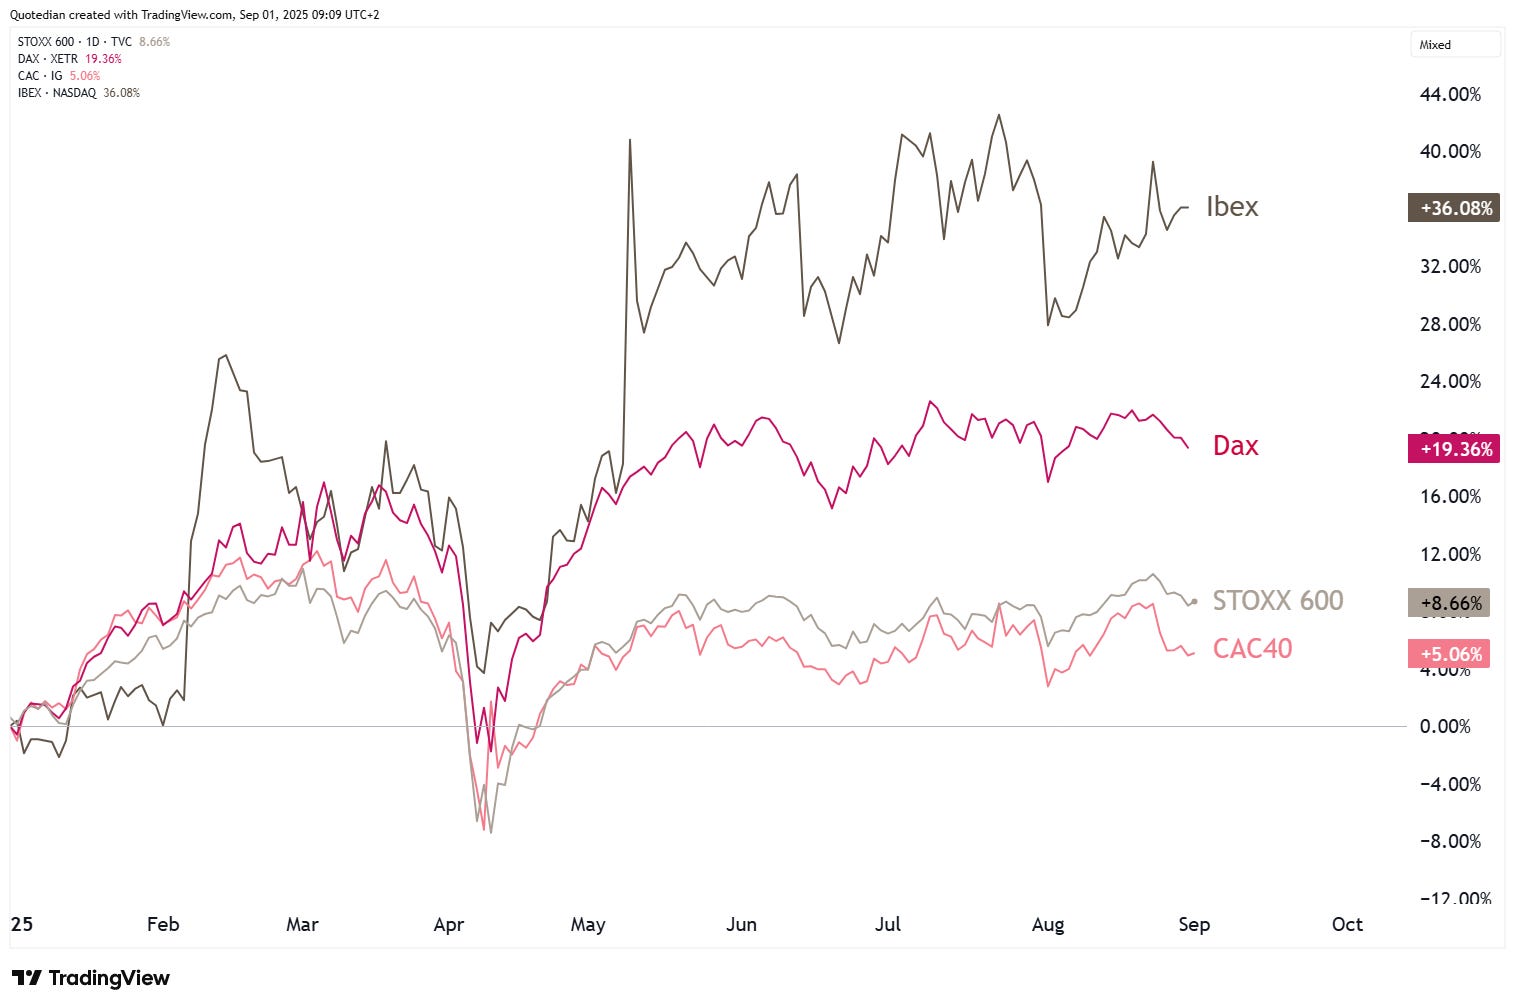
Within the Eurozone, important regional differences continue to apply in terms of year-to-date performance:
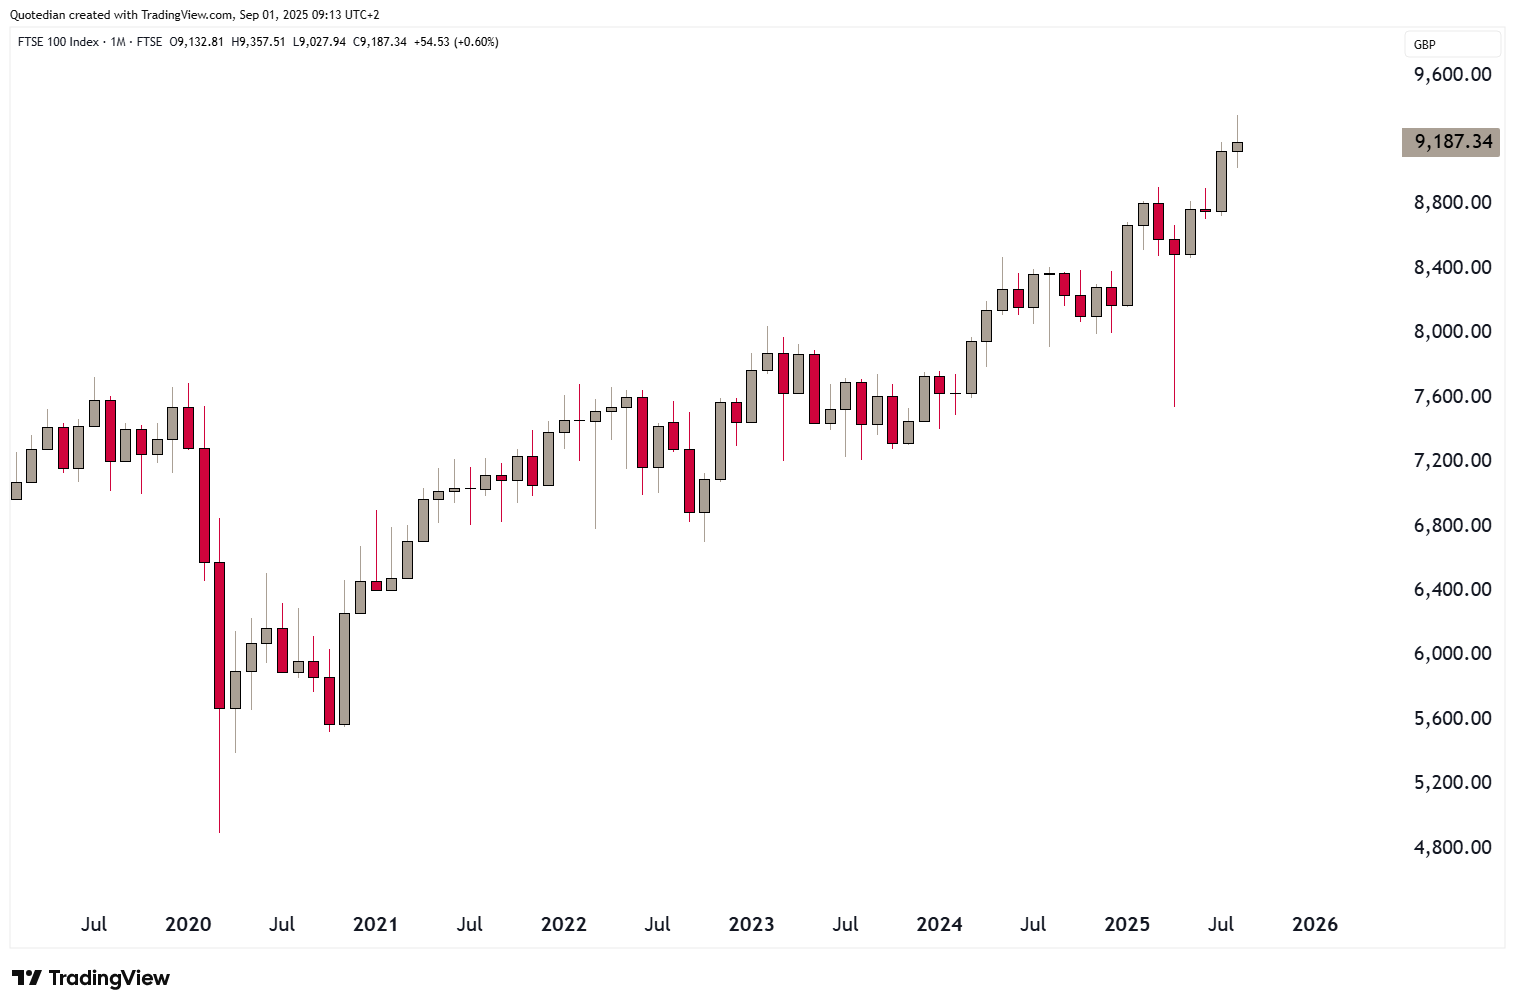
One market probably surprising many of us, given the ongoing political mess, is UK’s FTSE-100:
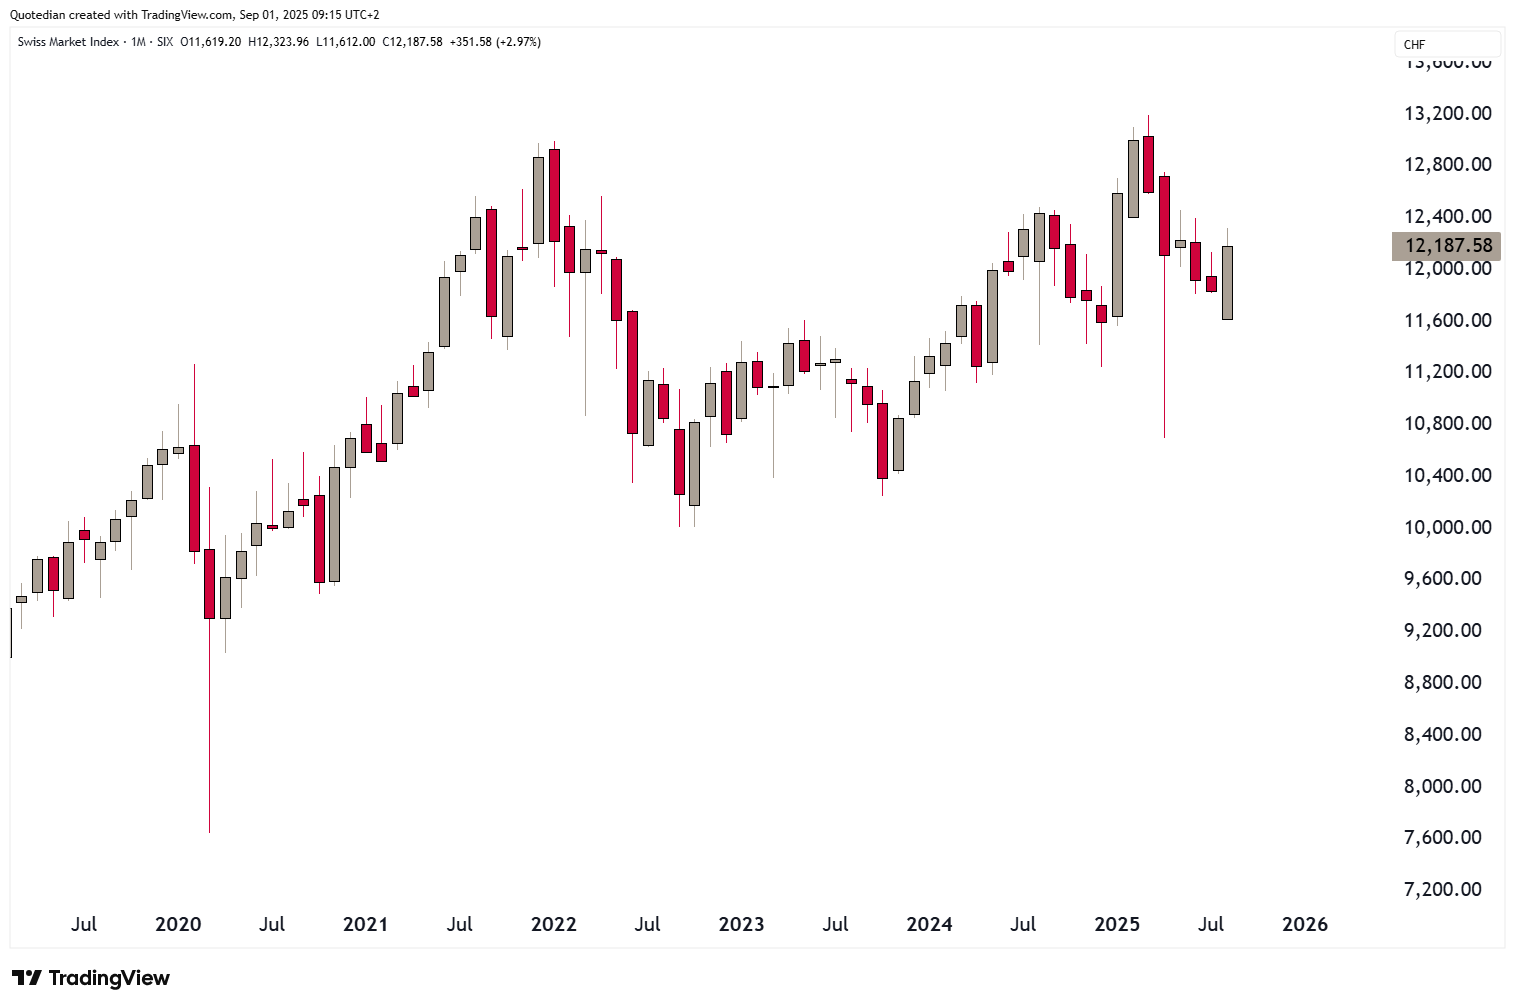
Despite a stellar three percent performance in August, Switzerland’s SMI continues to be on the disappointing side this year:
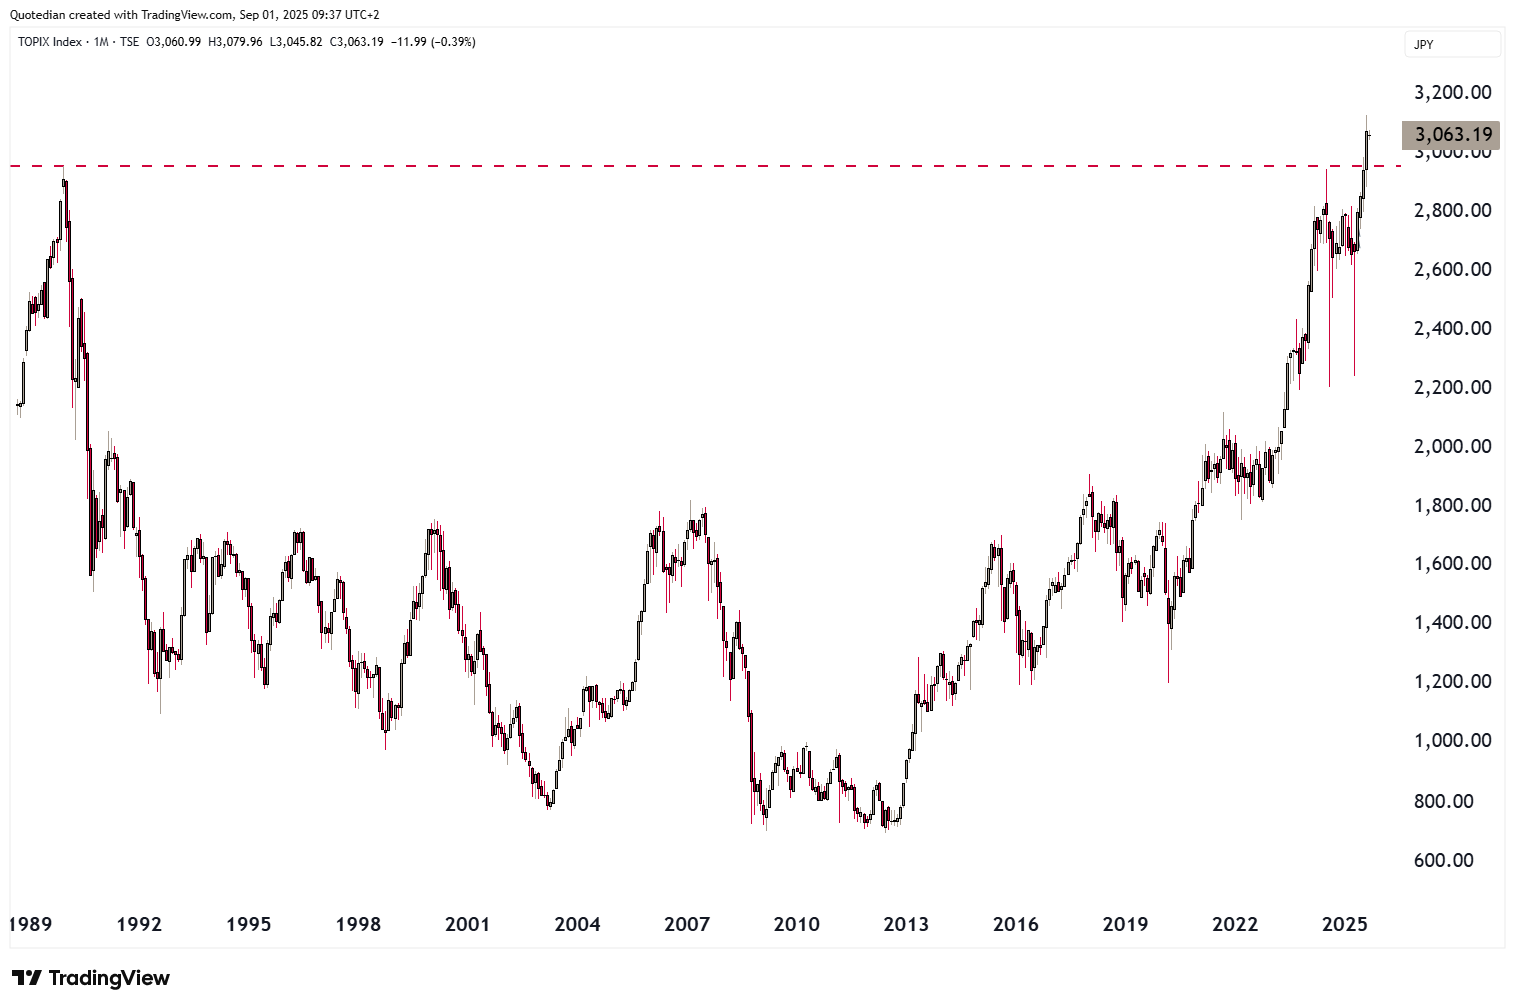
Over in Asia, Japan’s broad TOPIX index has finally taken out (decisively) that 1989 top!
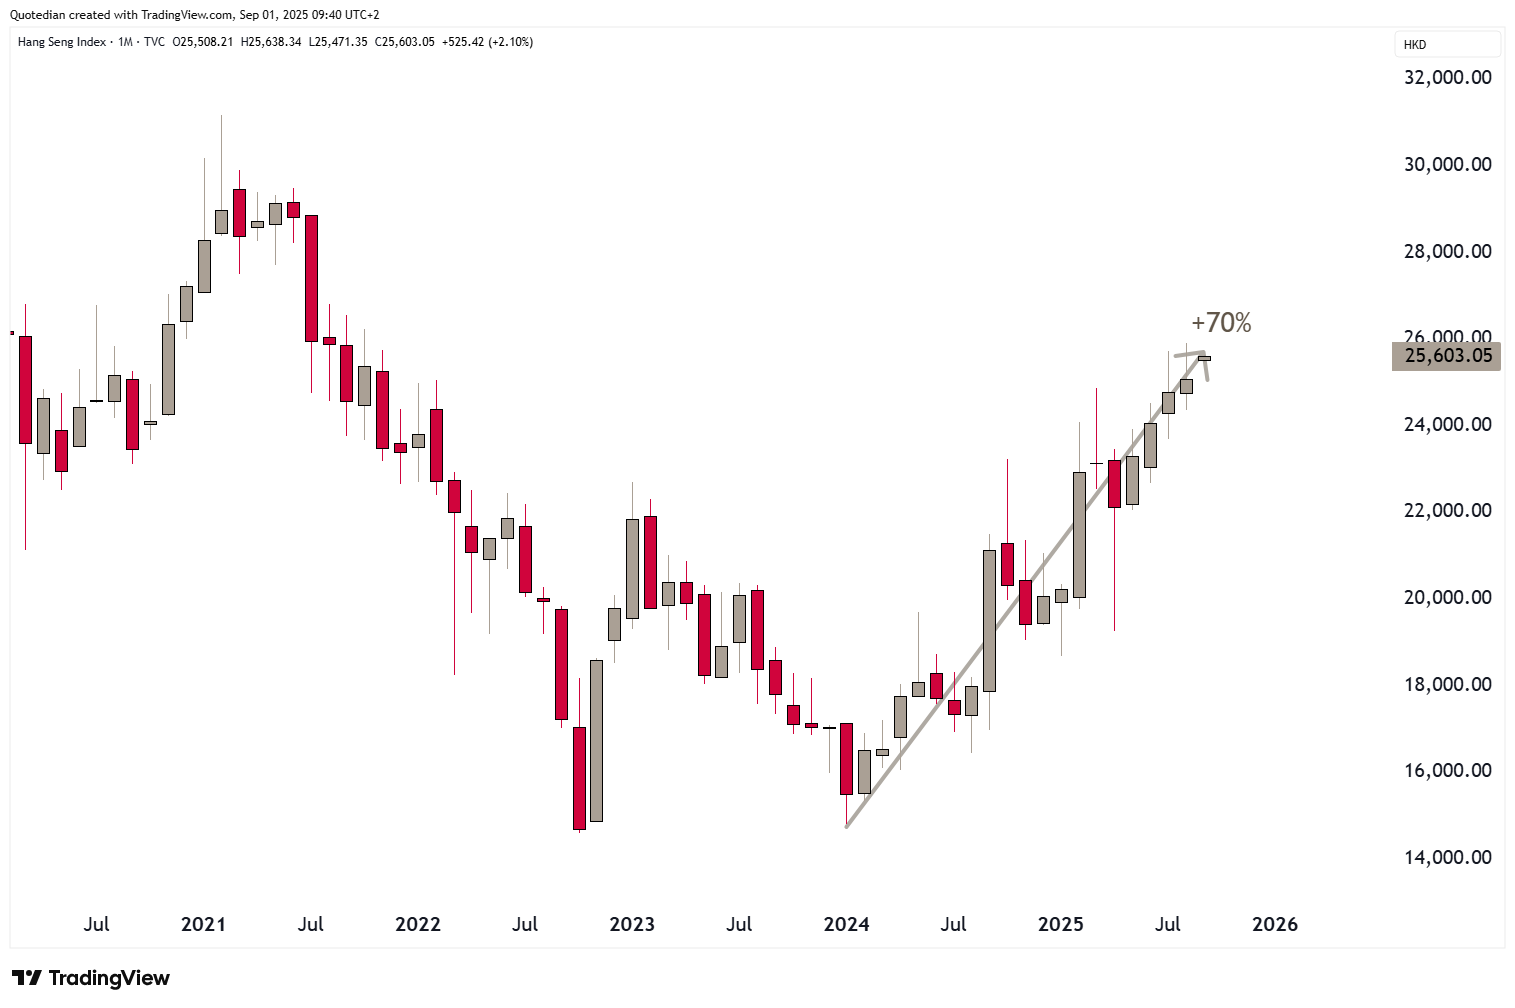
Hong Kong (HSI) stocks continue to rip higher,
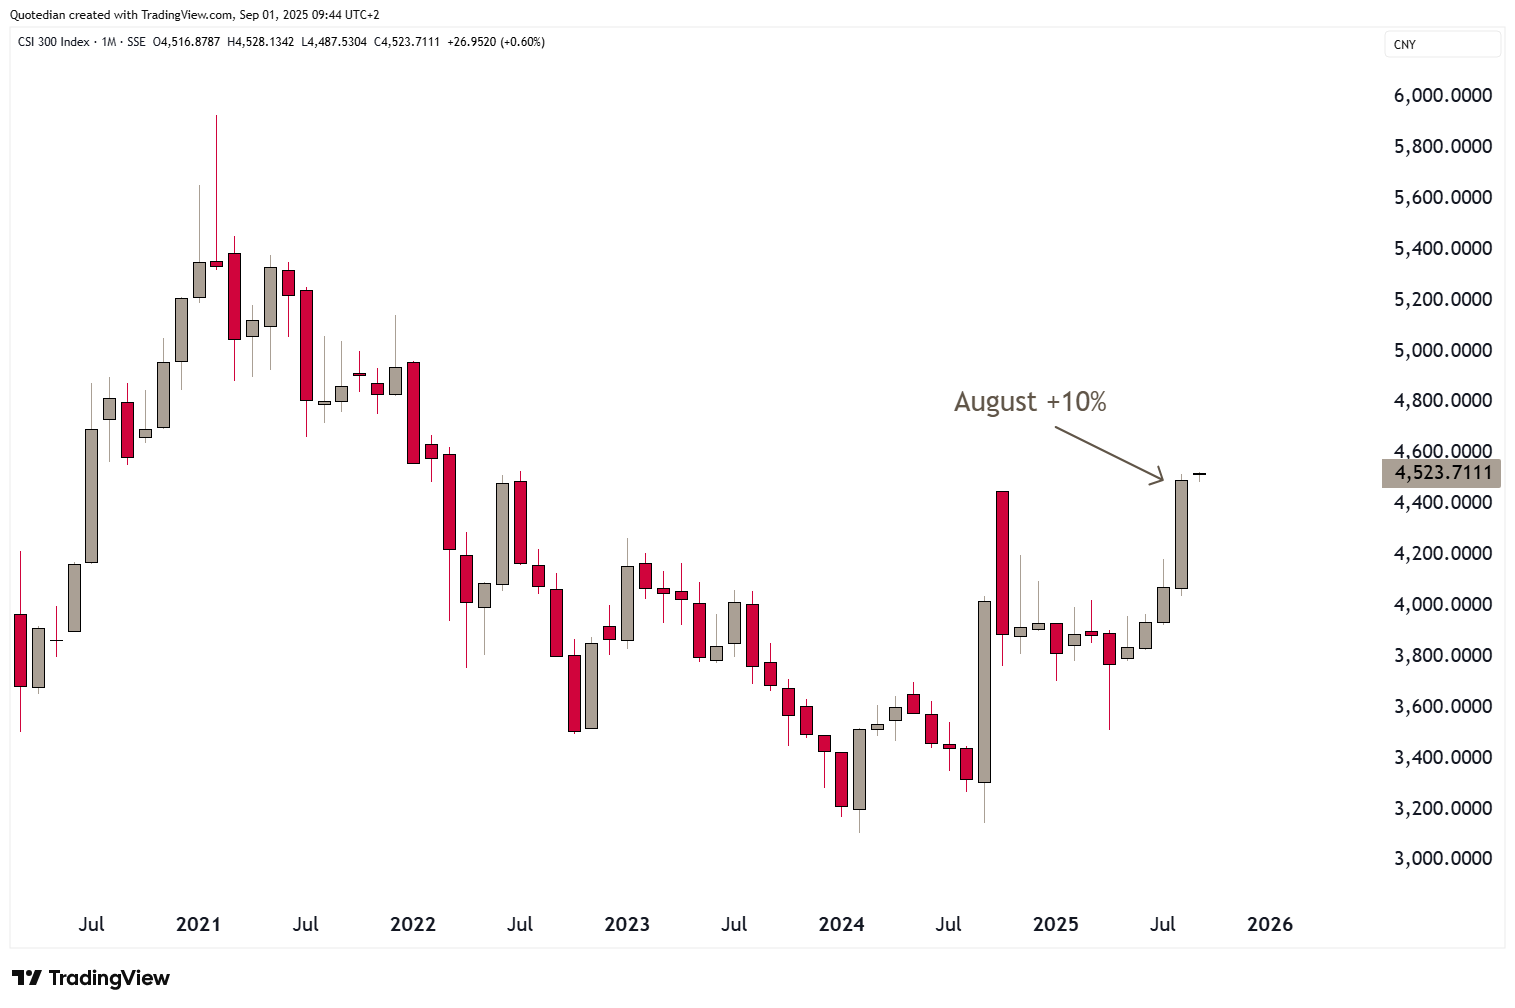
and Chinese mainland stocks (CSI300) have suddenly joined the party:
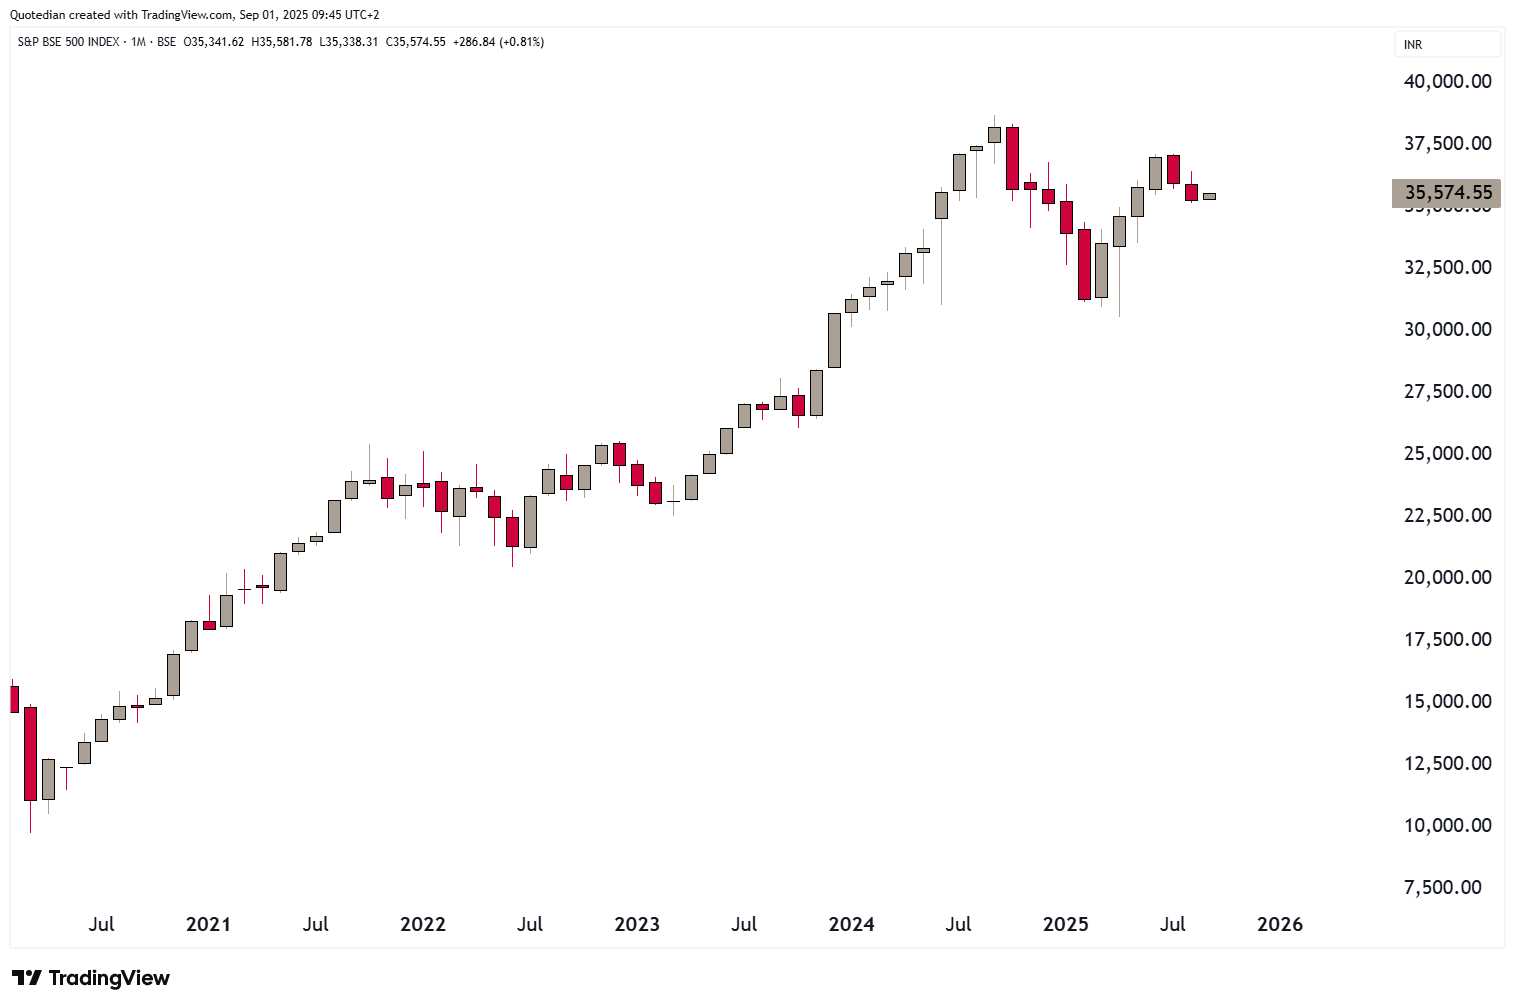
Indian stocks however have been struggling over the past two months, probably mostly due to that 50% tariff slapped on nearly all Indian imports in the US:
Time for a quick look at worldwide sector performance now:
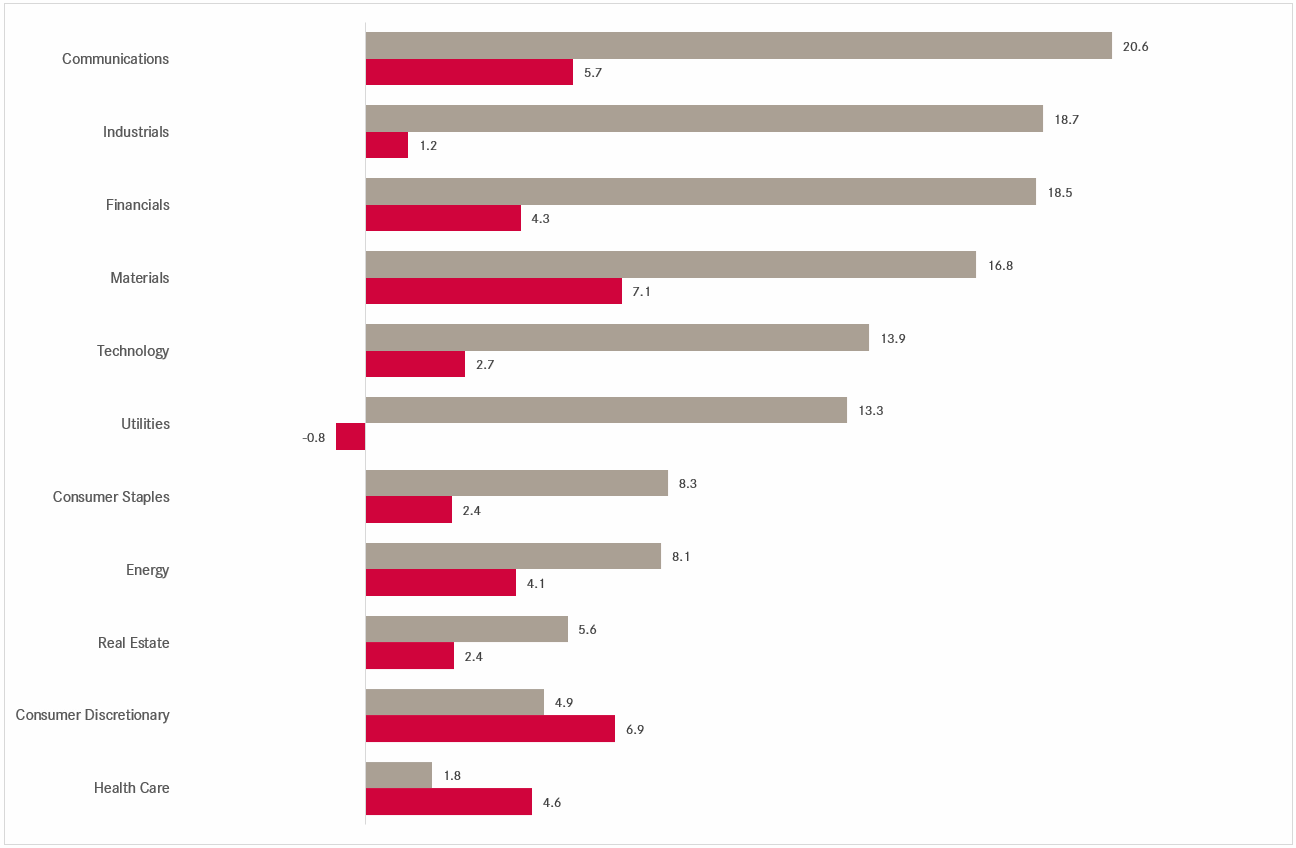
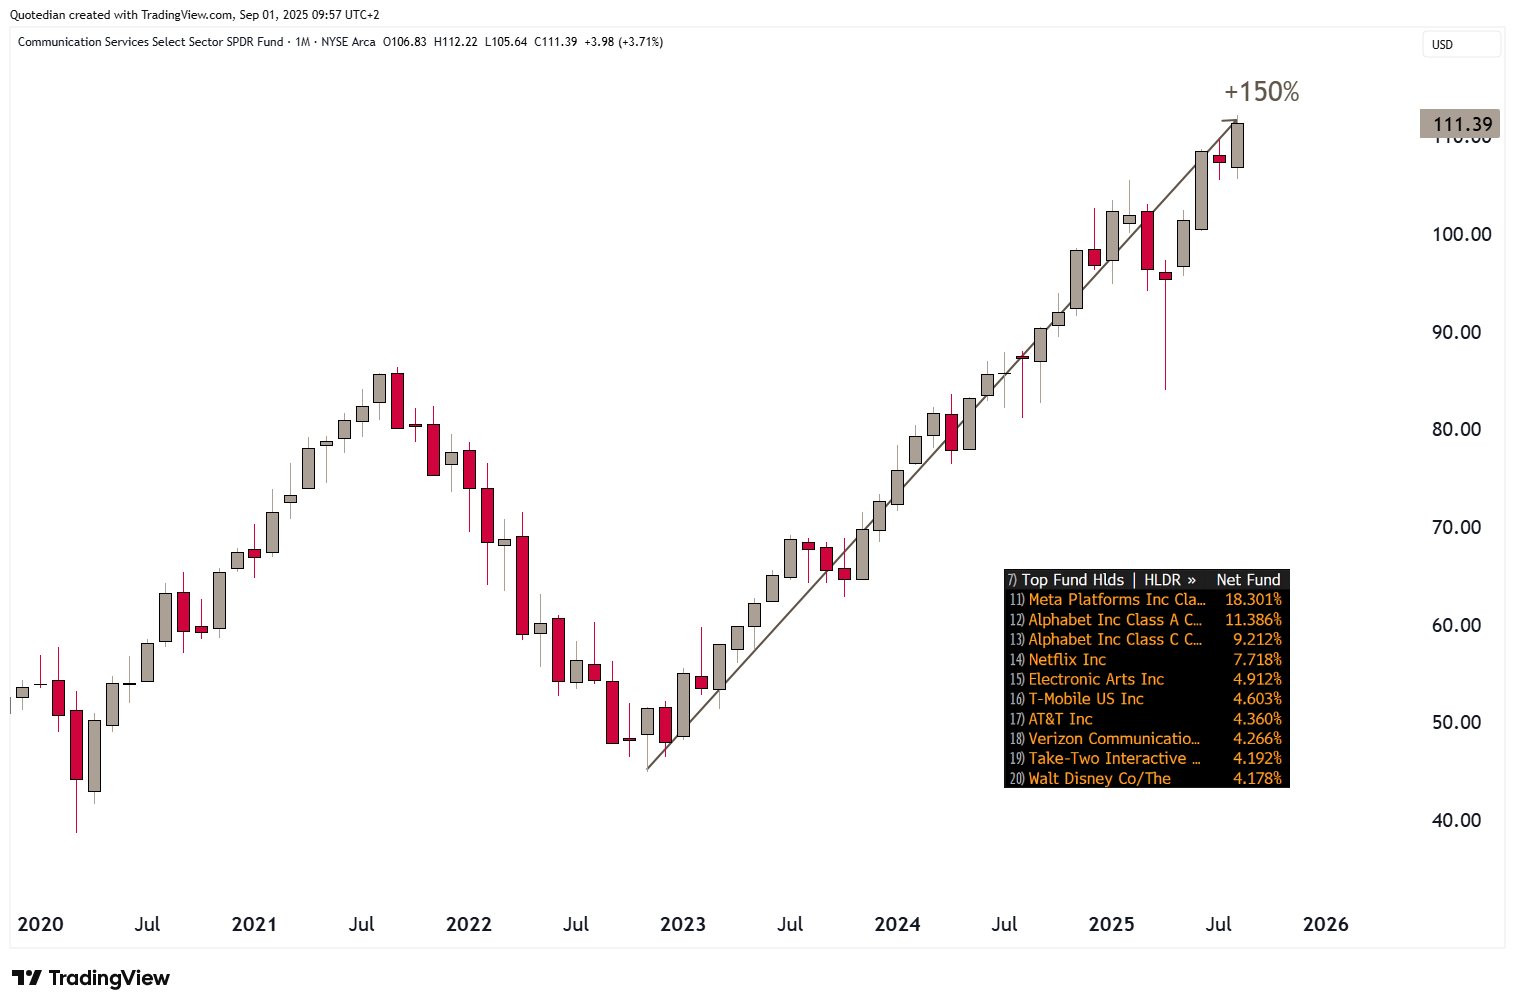
Here, regional differences also apply. Whilst communications stocks (SPDR Communication ETF - XLC) continue to go from strength to strength in the US,
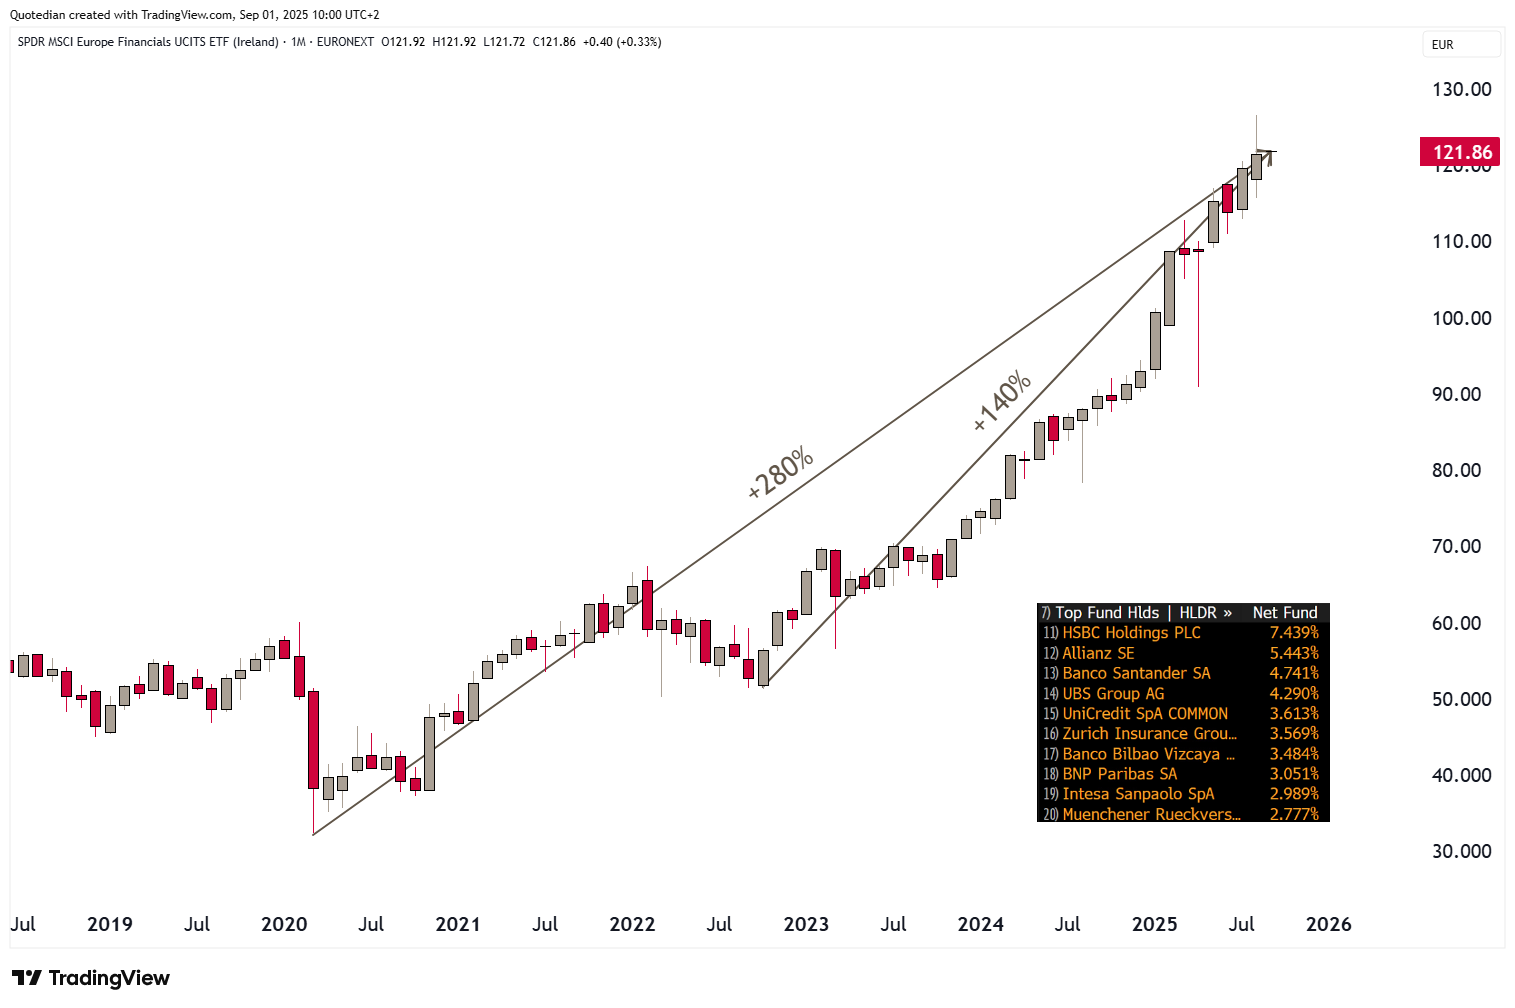
it is the financial sector in Europe that has been steamrolling higher:
Chinese technology stocks should get a special mention here, which have now nearly doubled since January of last year:
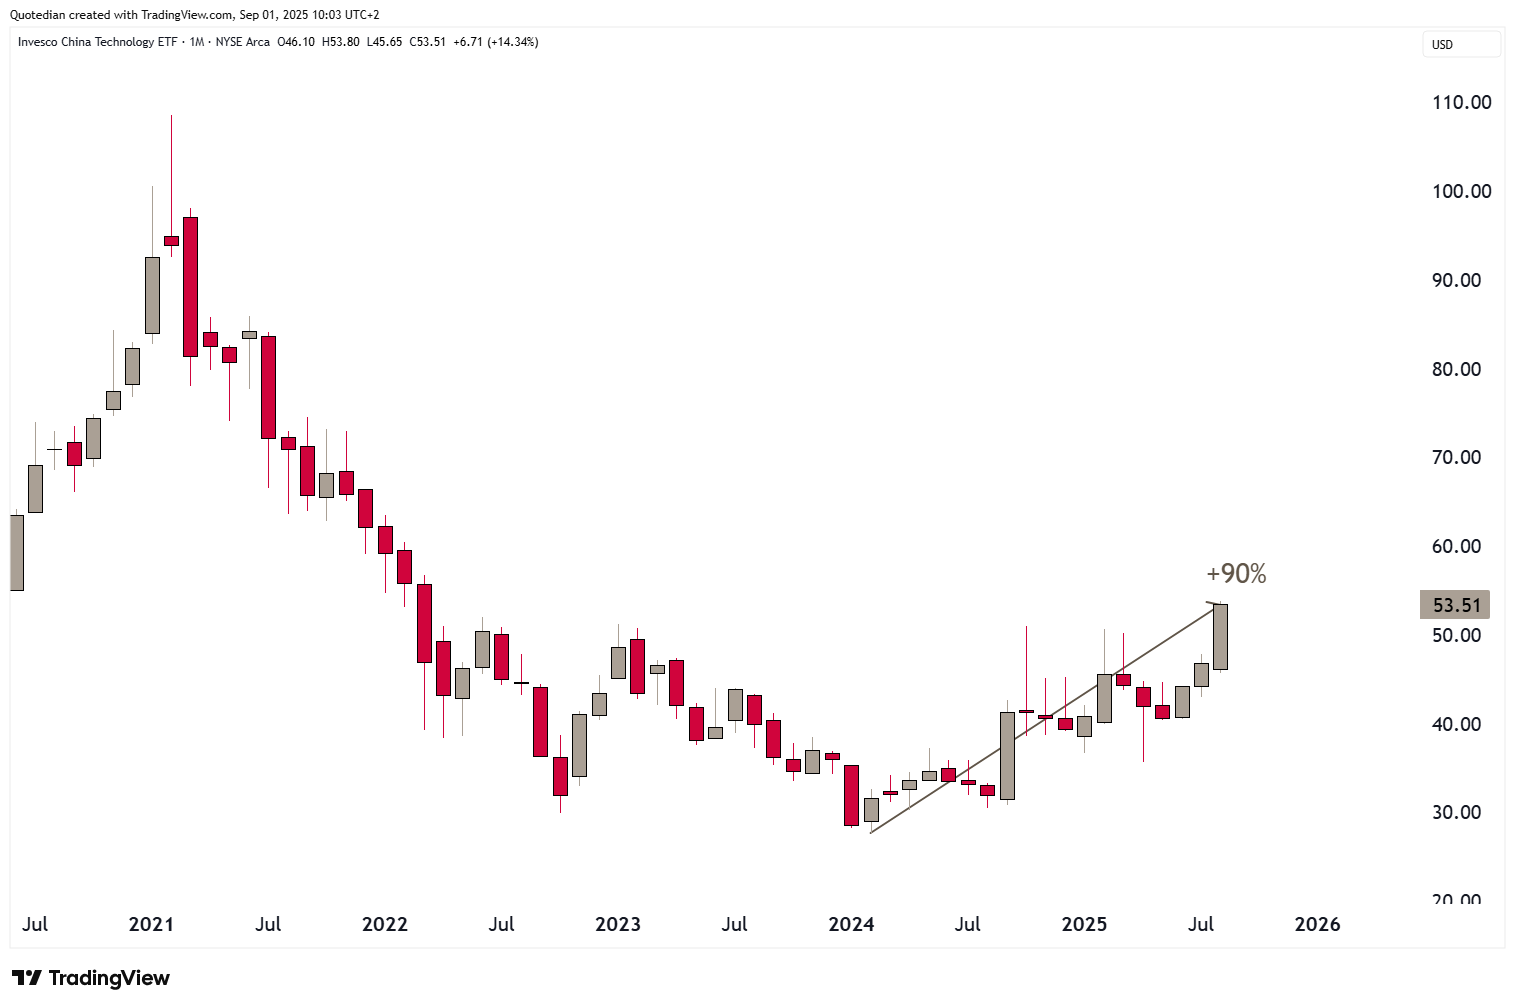
Though still being down 50% from their 2021 highs, there’s probably more upside to this theme …
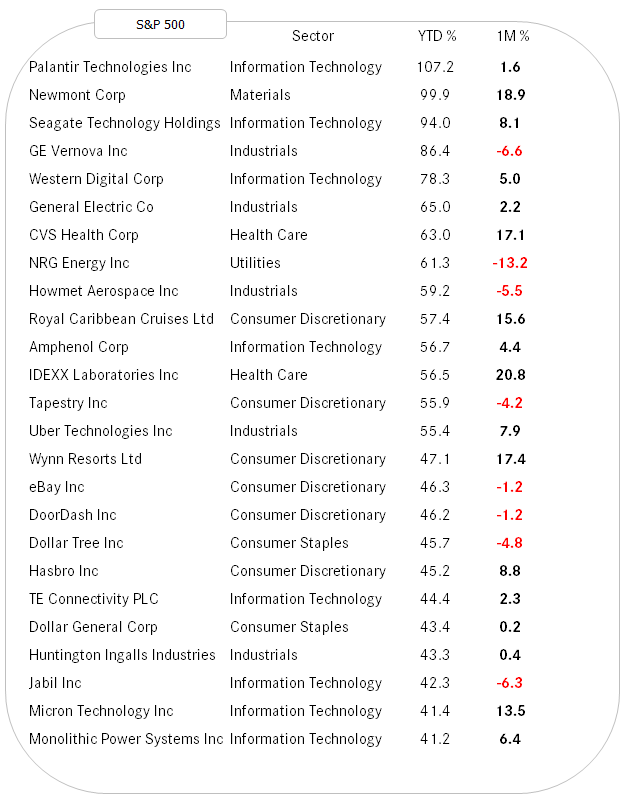
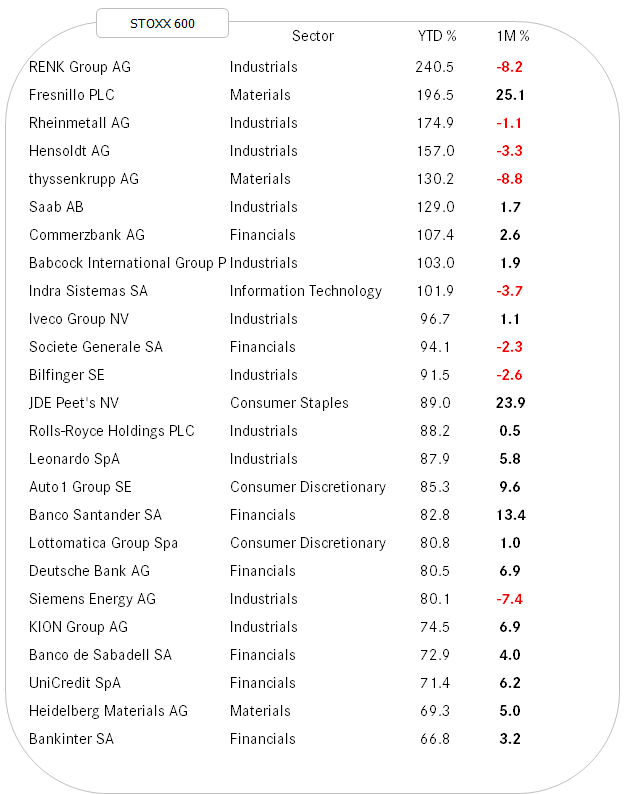
Now, a quick glance at the best performing stocks on a year-to-date basis in Europe and the US, and how they have fared during the month of August:
Now, just before we happily over into the fixed income section, let’s finish with a slightly tweaked Mark Twain Quote and the seasonality graph of September for the MSCI World index over the past 30 years:
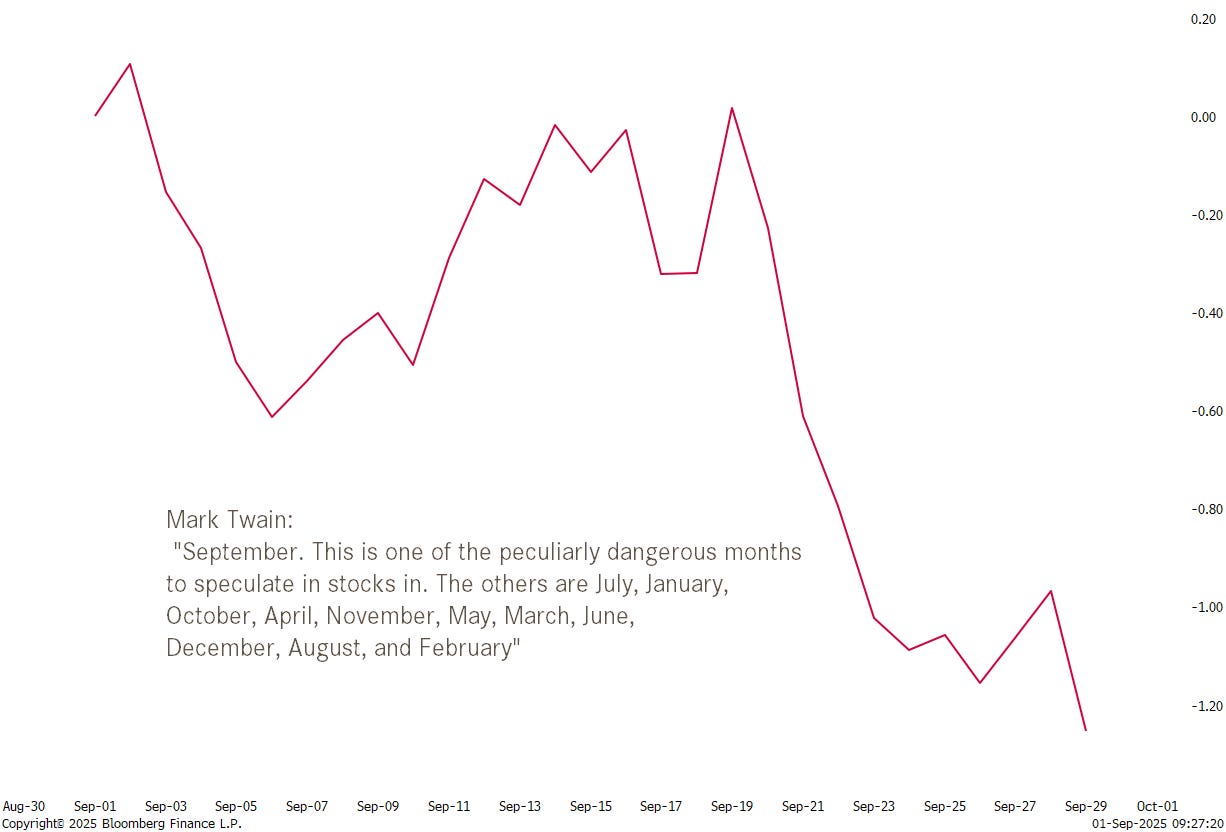
Fasten your seatbelts!


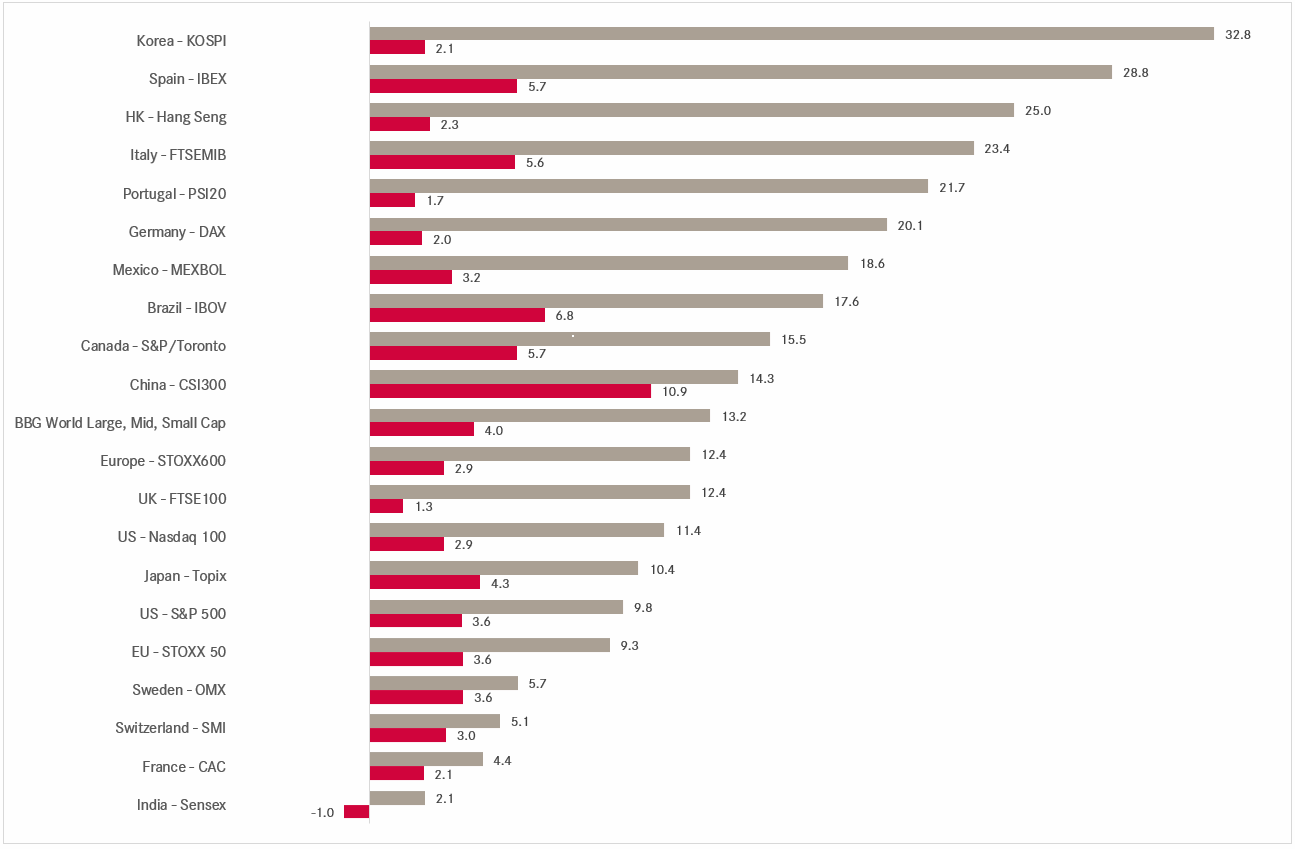
Turning to the (interest) rates market, here are the year-to-date (grey) and August (red) performances of some landmark bond indices:
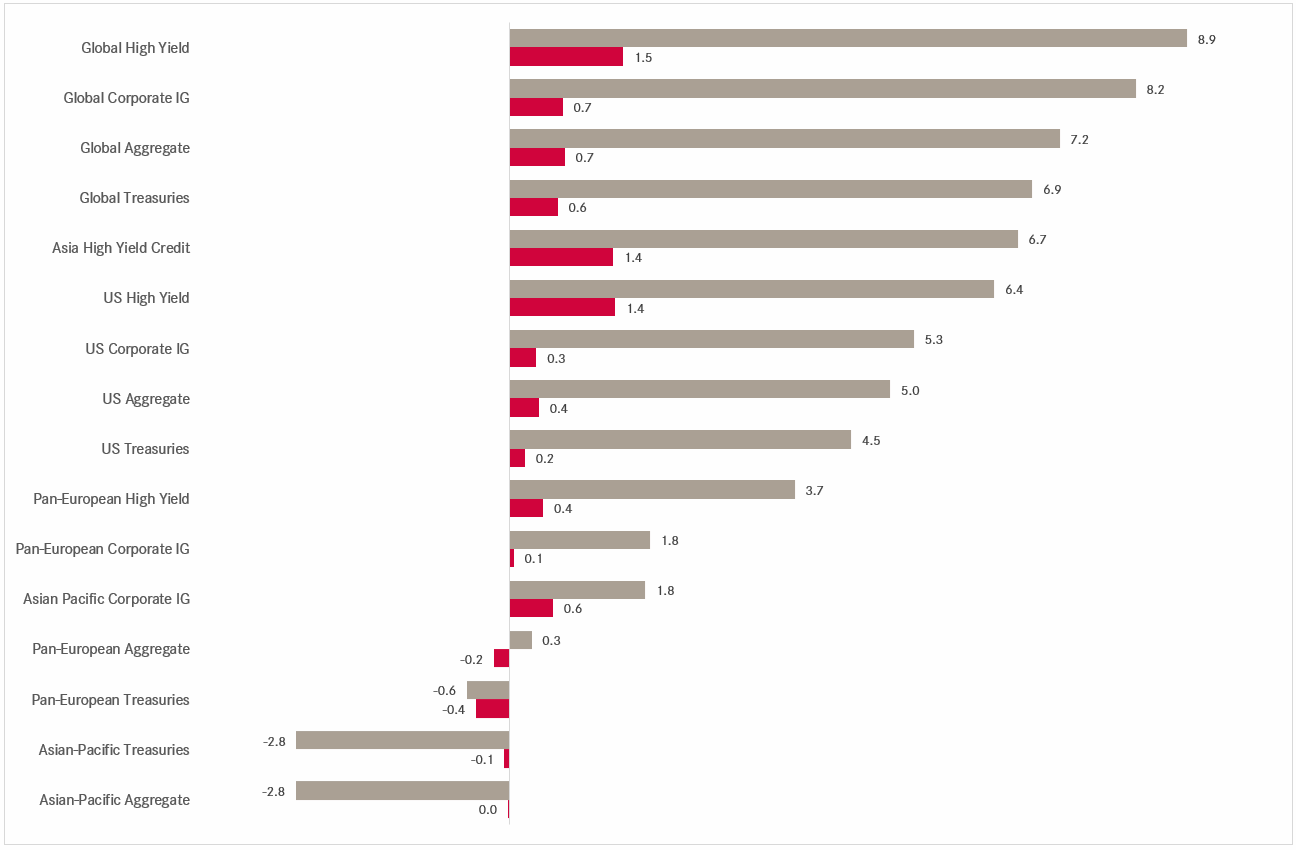
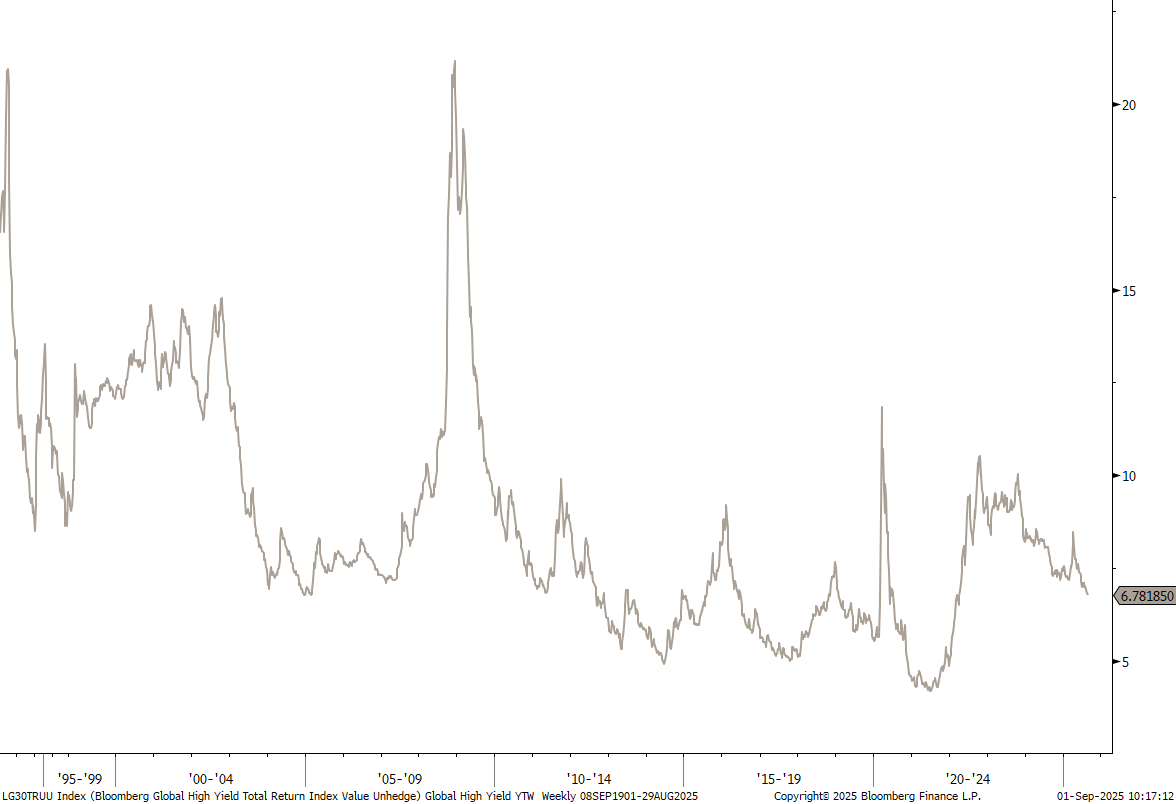
Clearly, with equity markets having bounced strongly off their post-Liberation Day April lows, high yield has been performing very well. This is yield-to-worst (YTW) of the Bloomberg Global High Yield index:
The US High Yield OAS (option-adjusted spread) has fallen to the lowest levels on record:
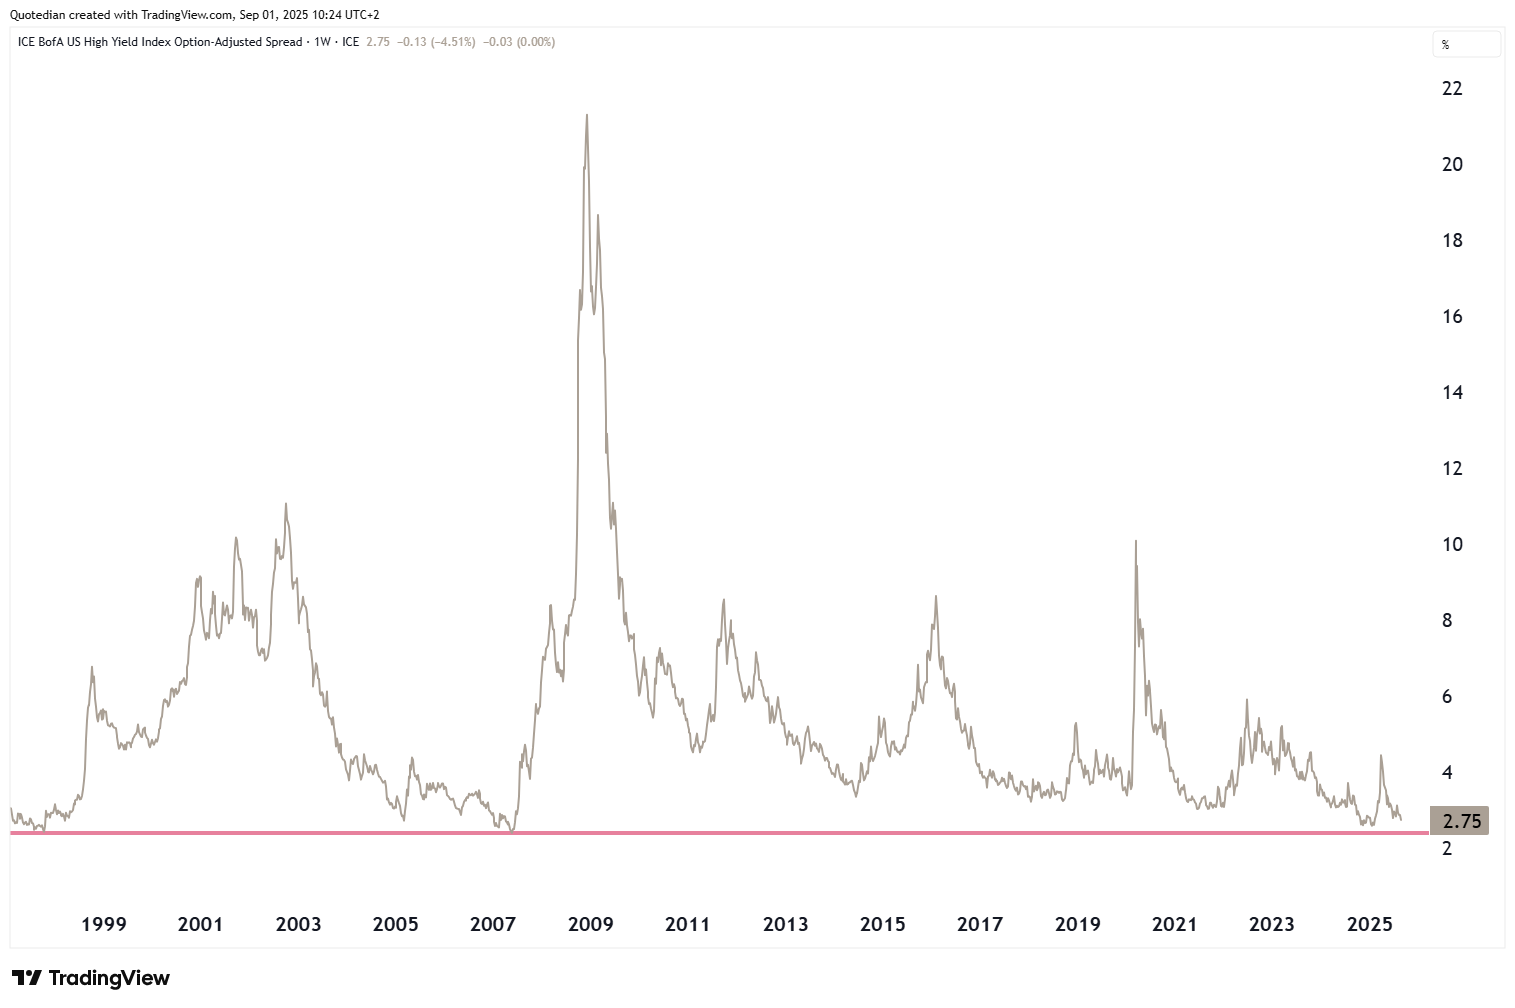
The question is then, how much more can this lemon be squeezed?

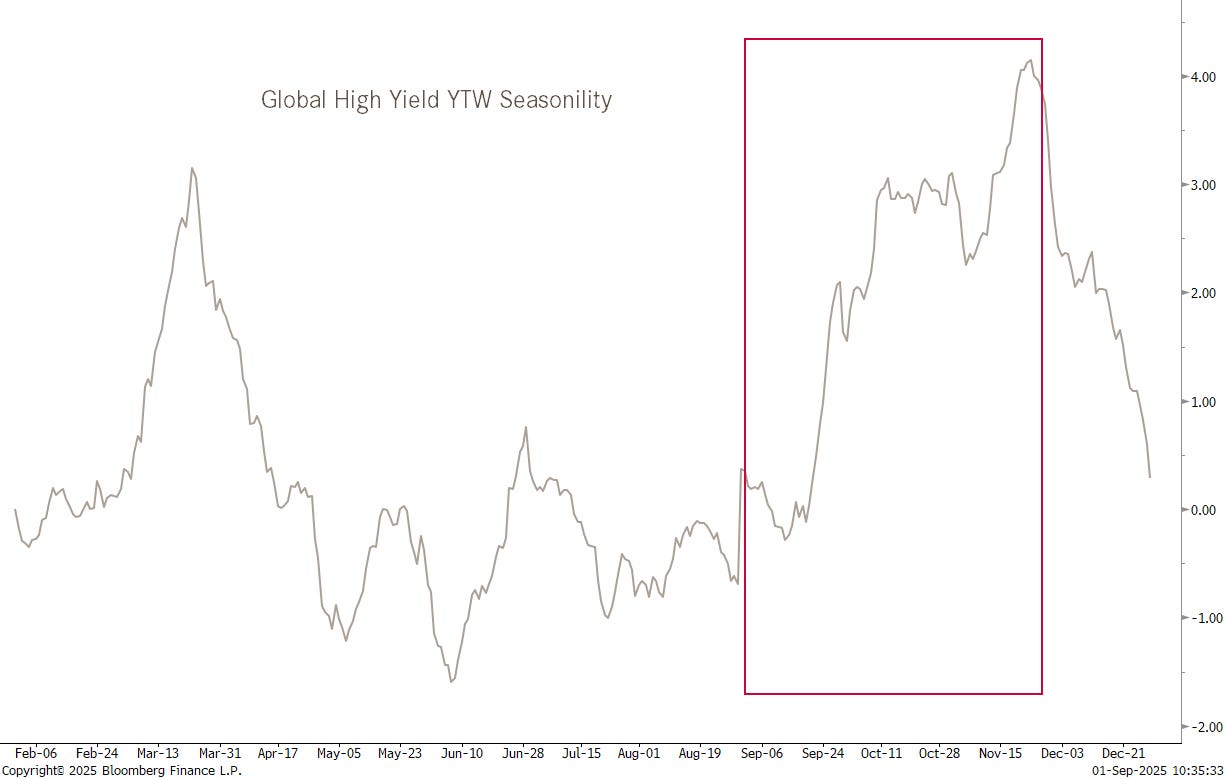
Again, from a seasonality point of view, we are moving into the time of the year where credit spreads have been widening over the past decades:
US treasury yields have been range bound since the early year shockwaves. Here’s the 10-year US Treasury Yield monthly chart:
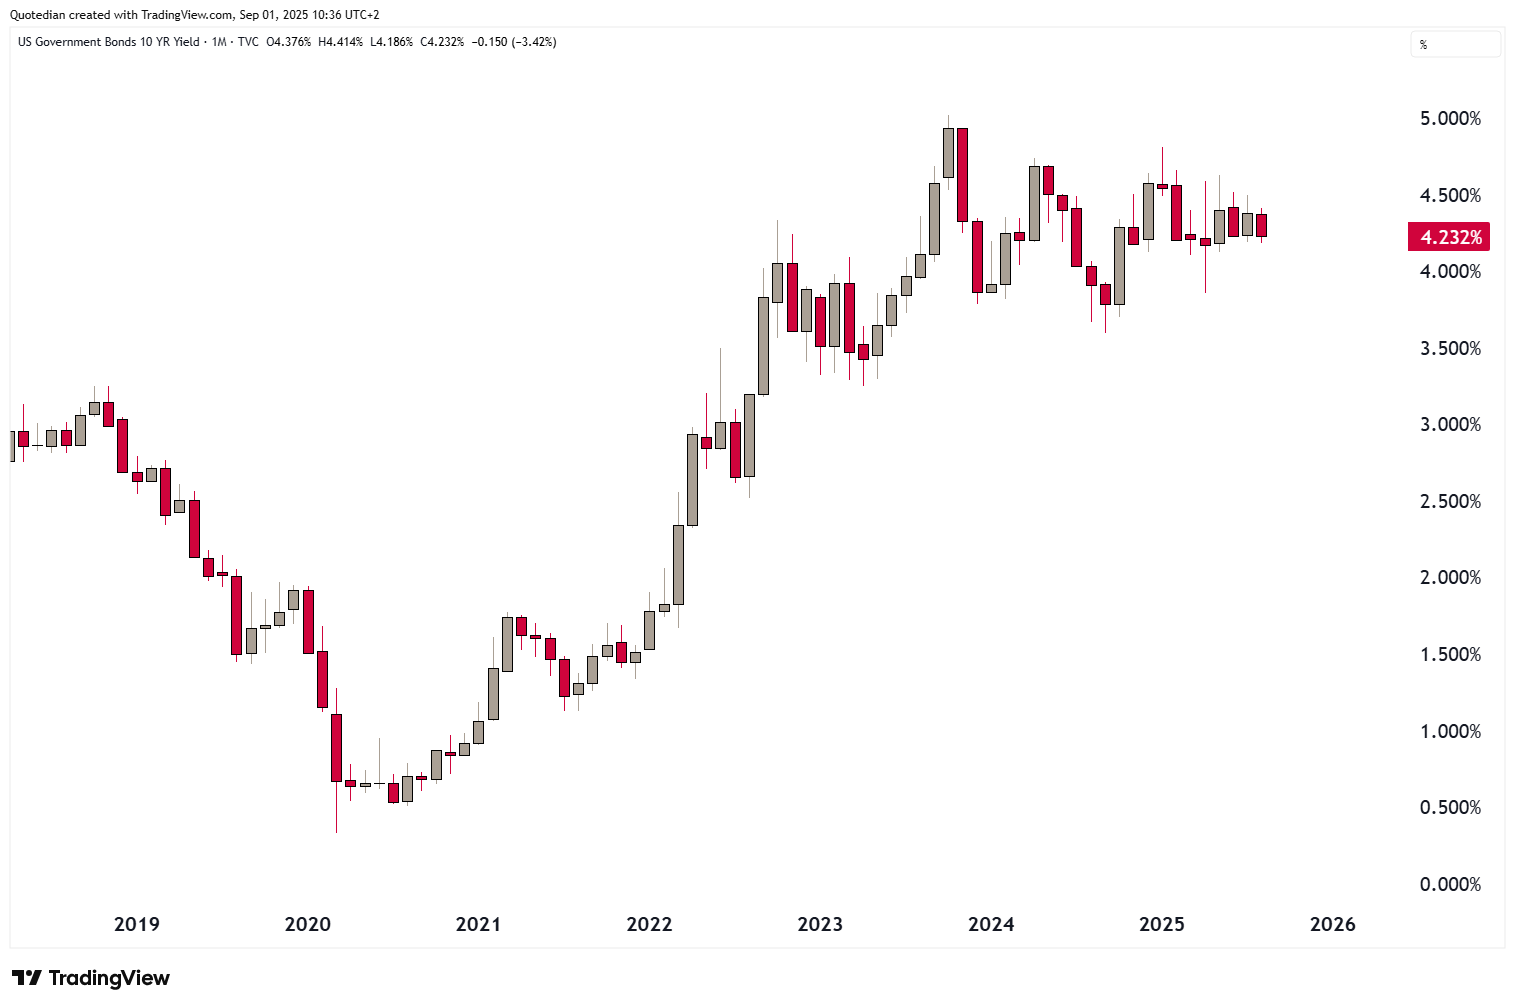
Given that most recent inflation data has surprised to the upside,
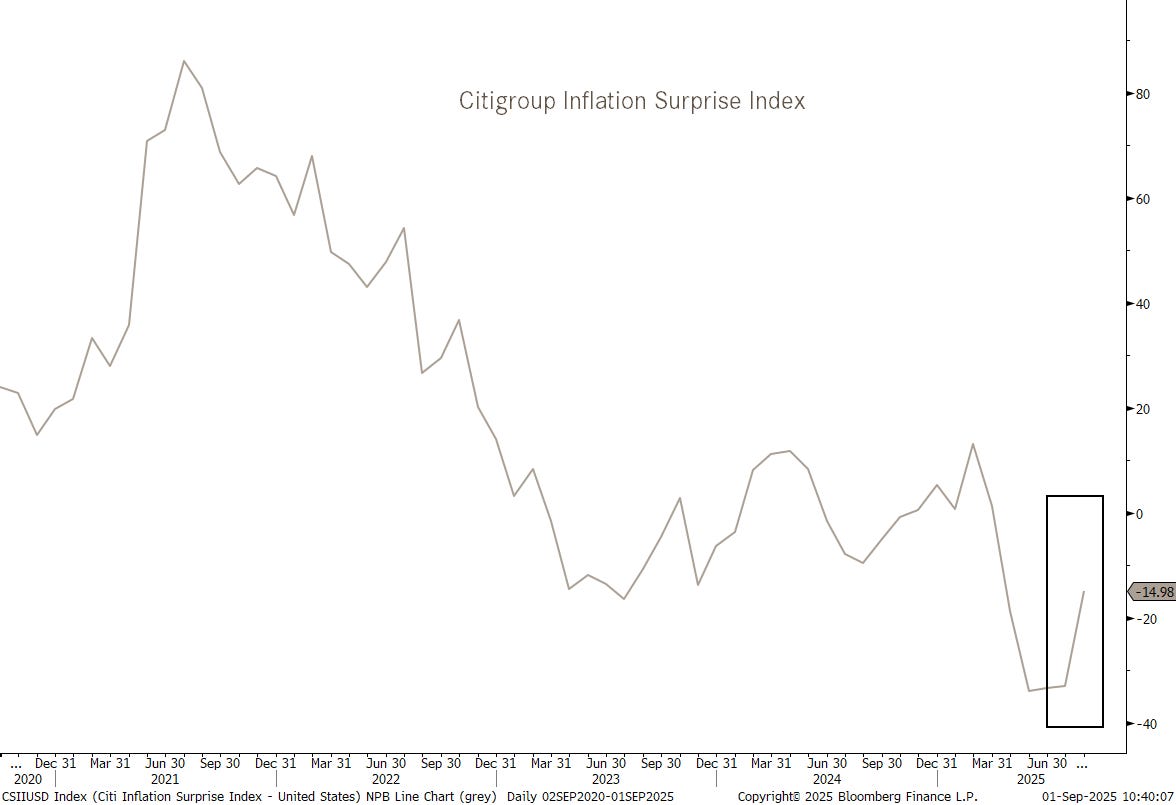
and the Atlanta Fed’s GDPNow model expecting an acceleration of US growth to 3.5% (versus consensus of less than 1%),

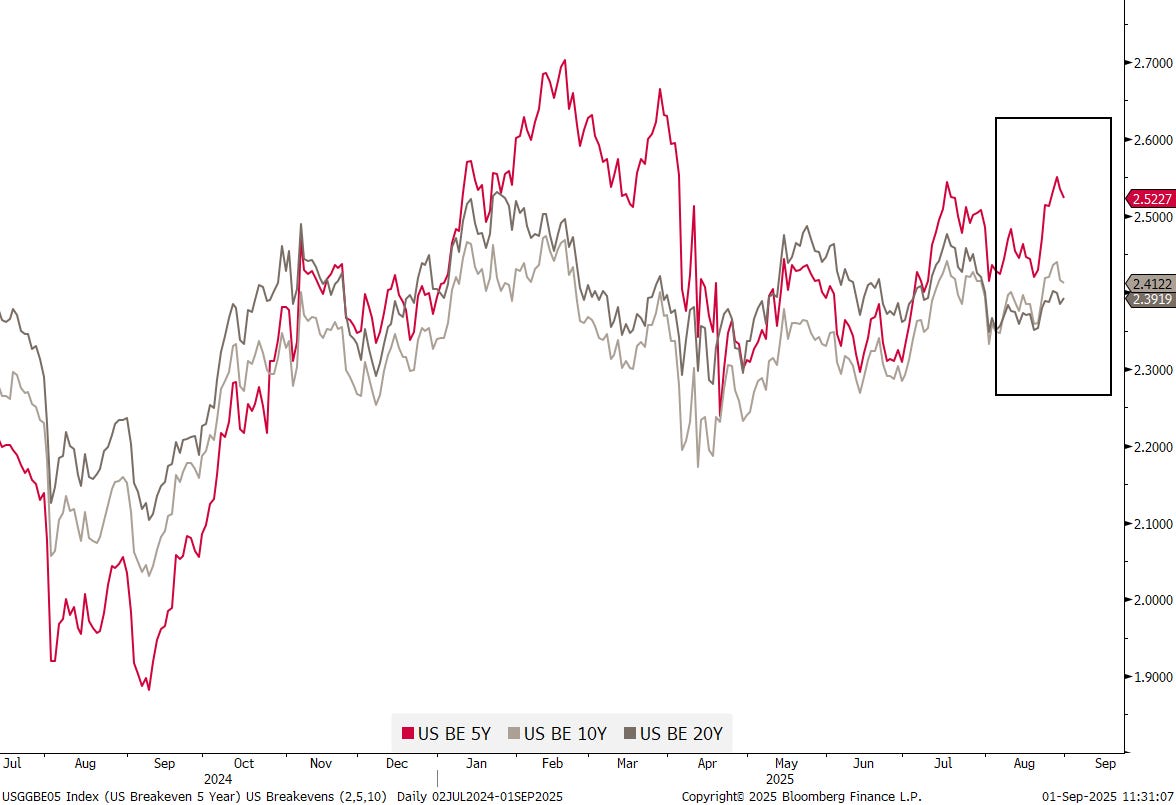
I wonder if that US 10-year yield is not too low at 4.25ish and breakevens seem to be starting to wonder the same:
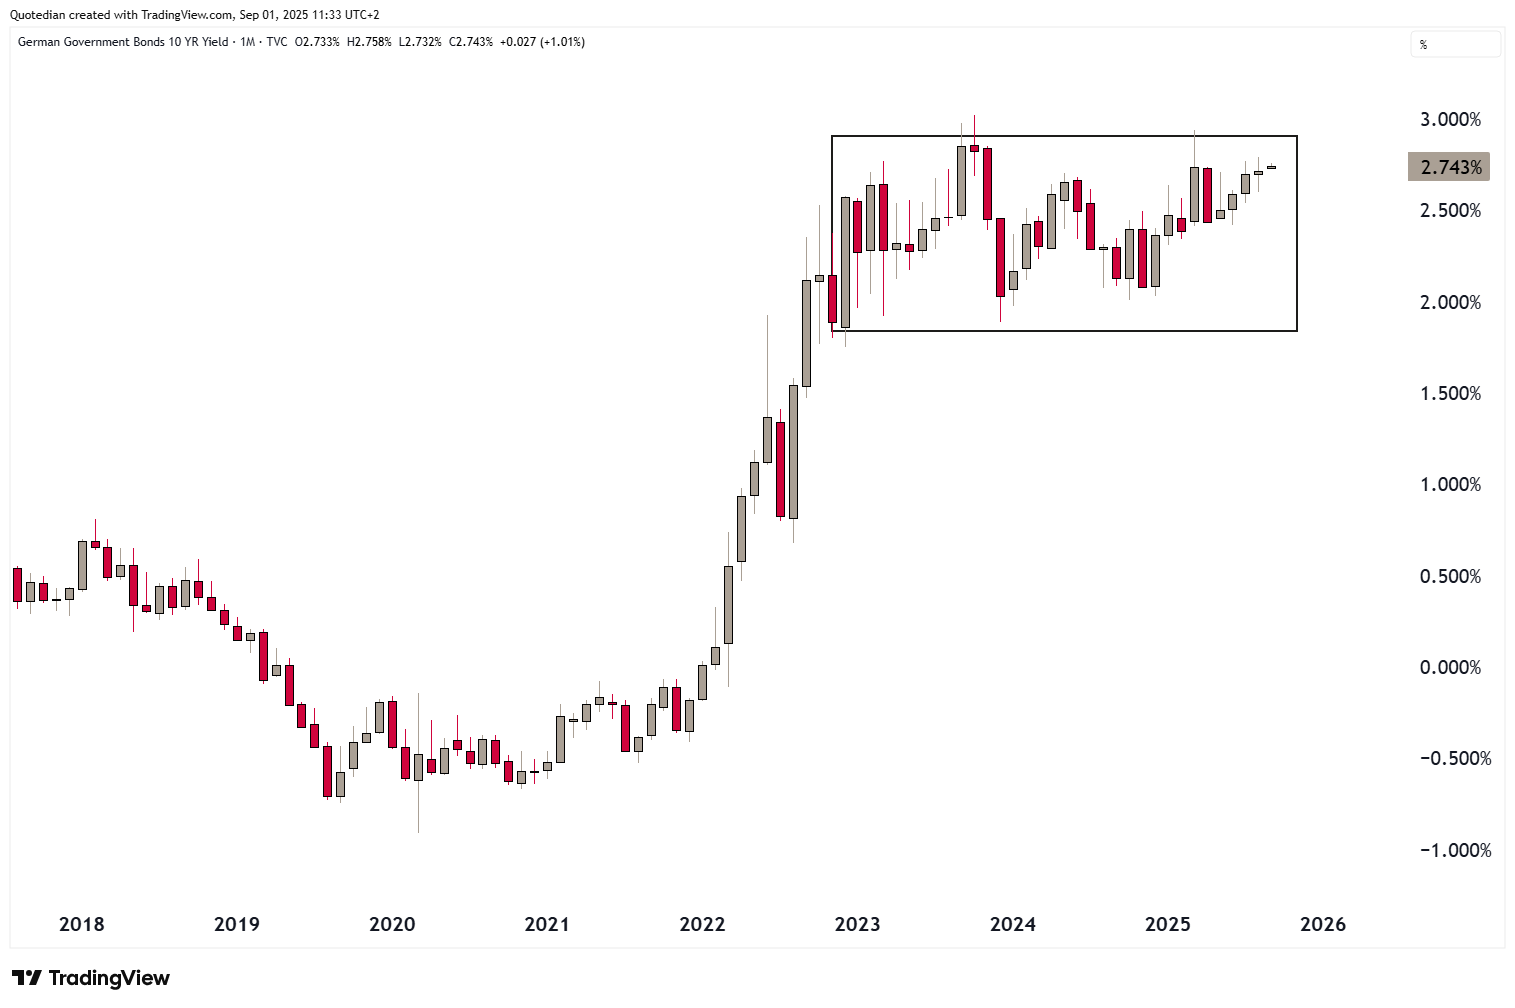
In Europe, rates (German 10Y) are pushing towards the upper end of their three-year old range:
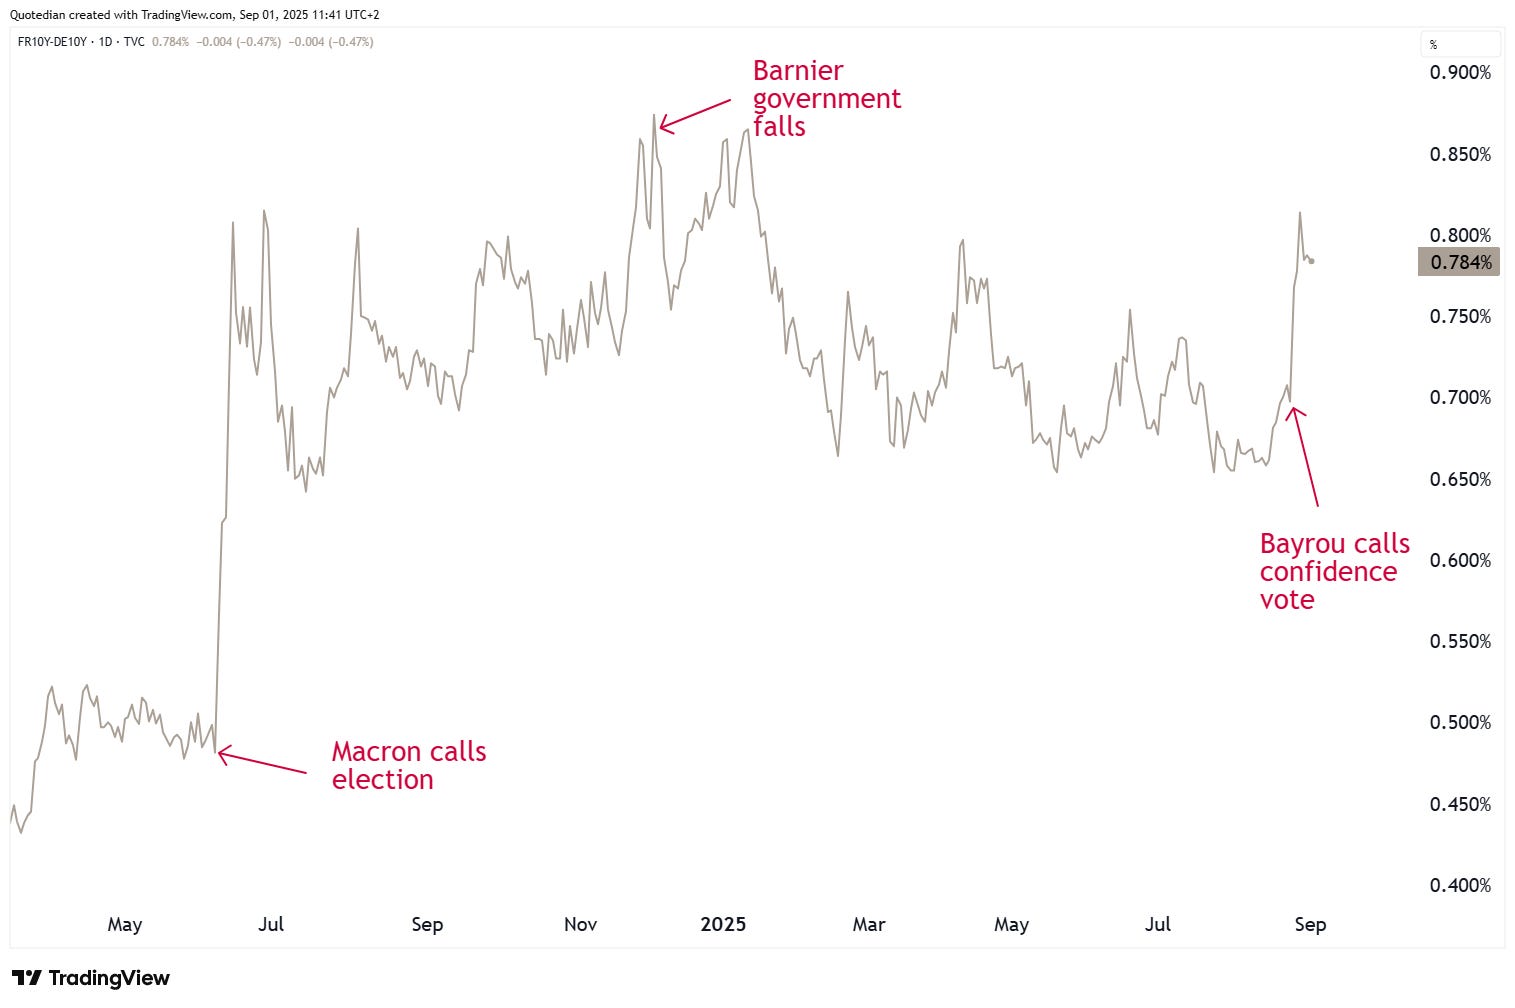
The spread of French 10-year yields over their German equivalents have been abruptly widening again, after the country’s prime minister Francois Bayrou has initiated the next political crises after calling for a confidence vote.
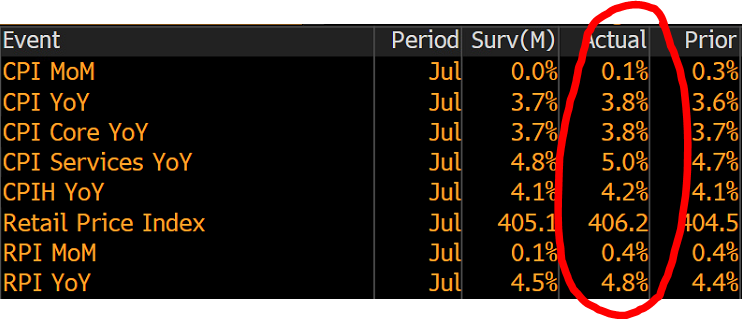
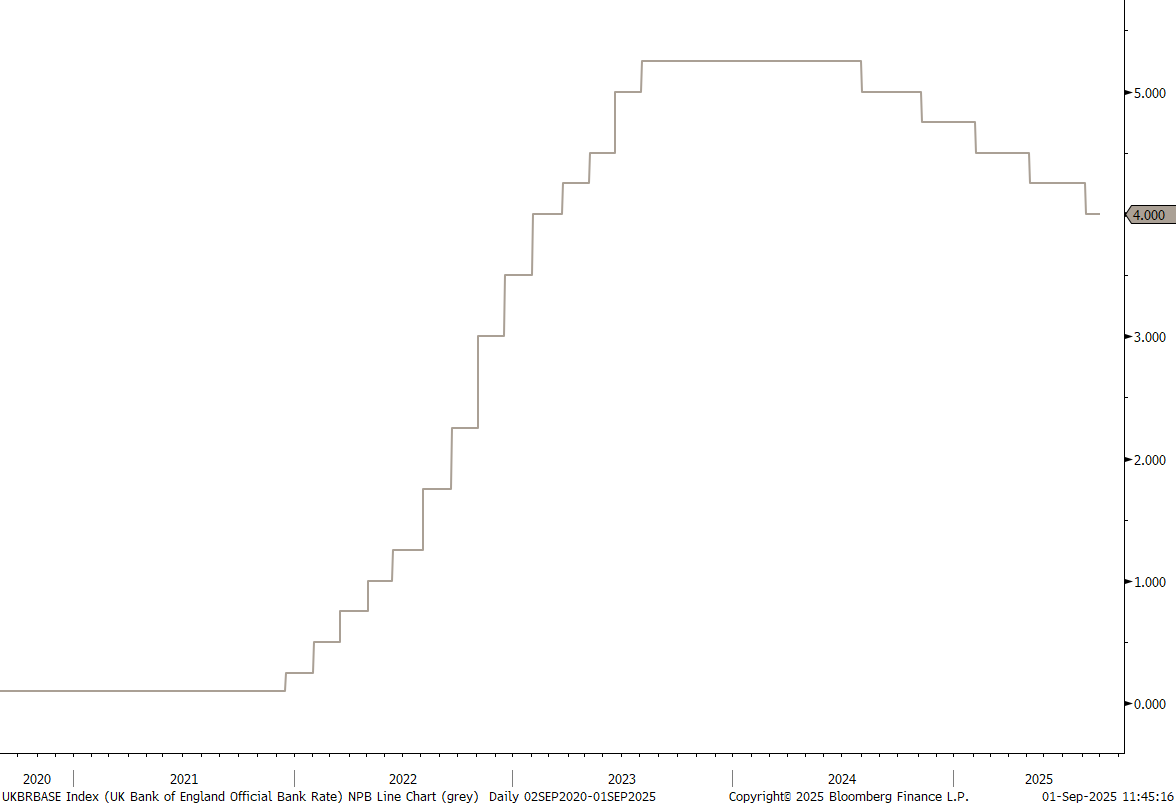
UK inflation surprised to the upside two weeks ago,
shortly after the Bank of England (BoE) had decided to cut the country’s official bank rate for a fifth time this cycle by 25 basis points:
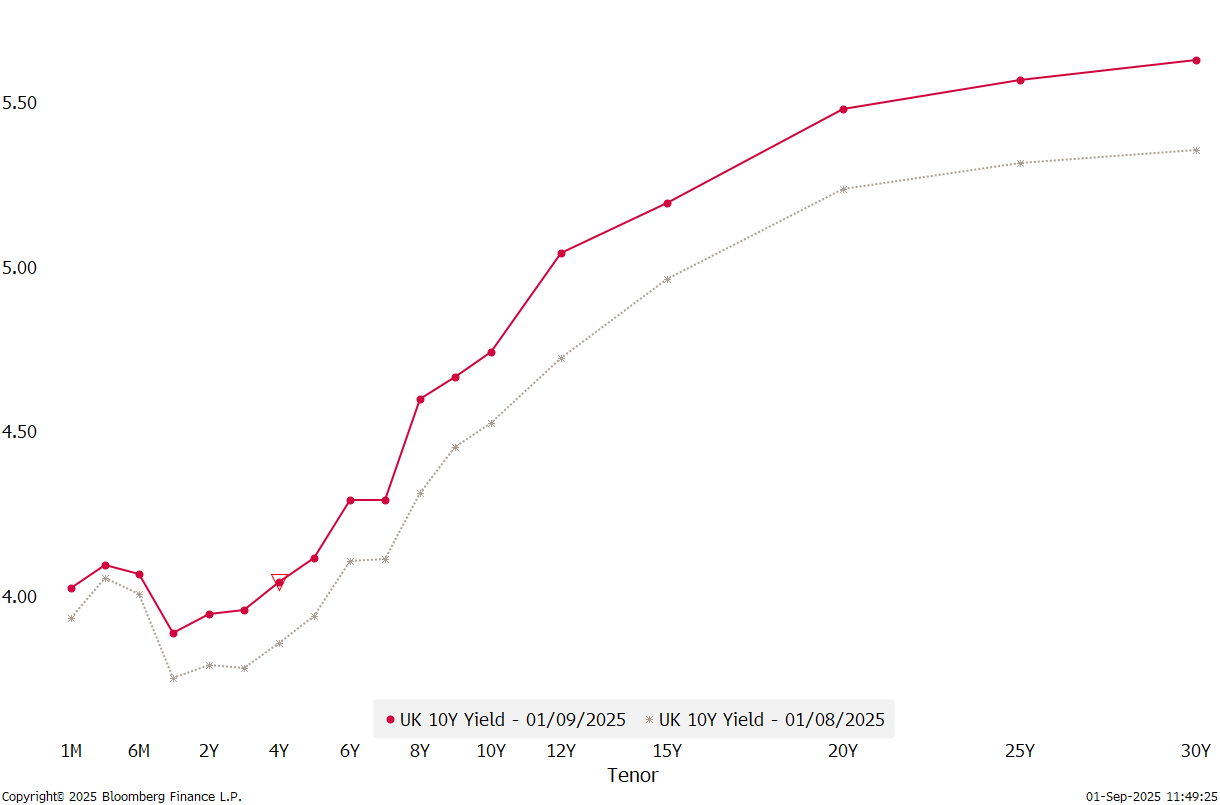
The long-end of the curve, which has steepened noticably over the past month, is obviously not liking it:
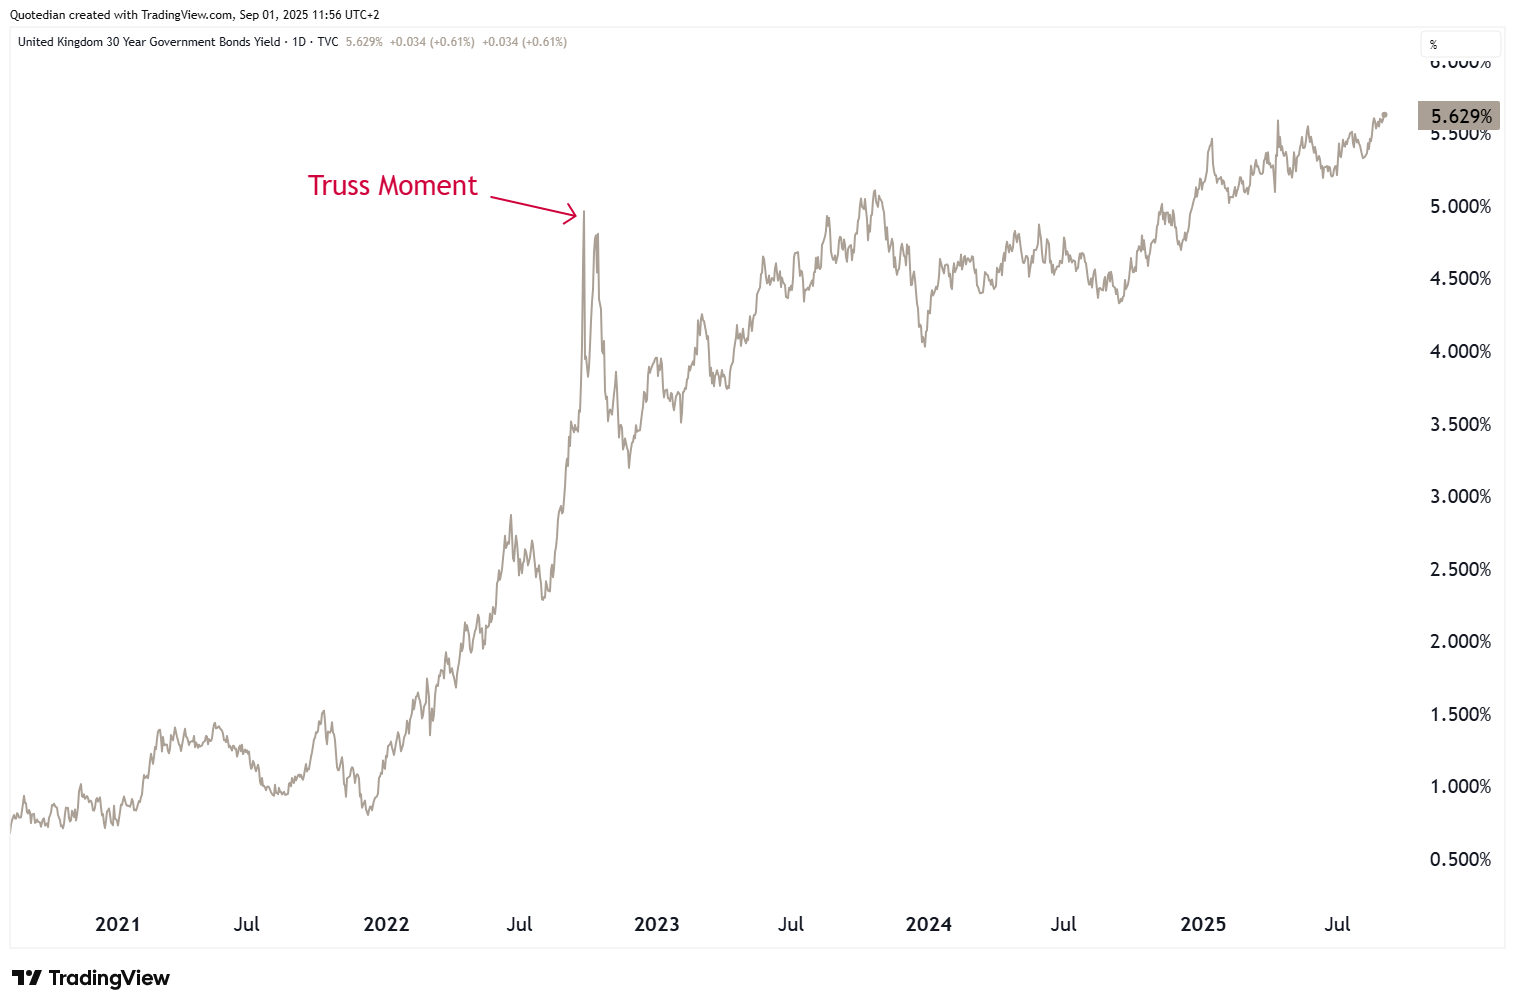
Not only is the 30-year Gilt yield trading at its highest since 1998,
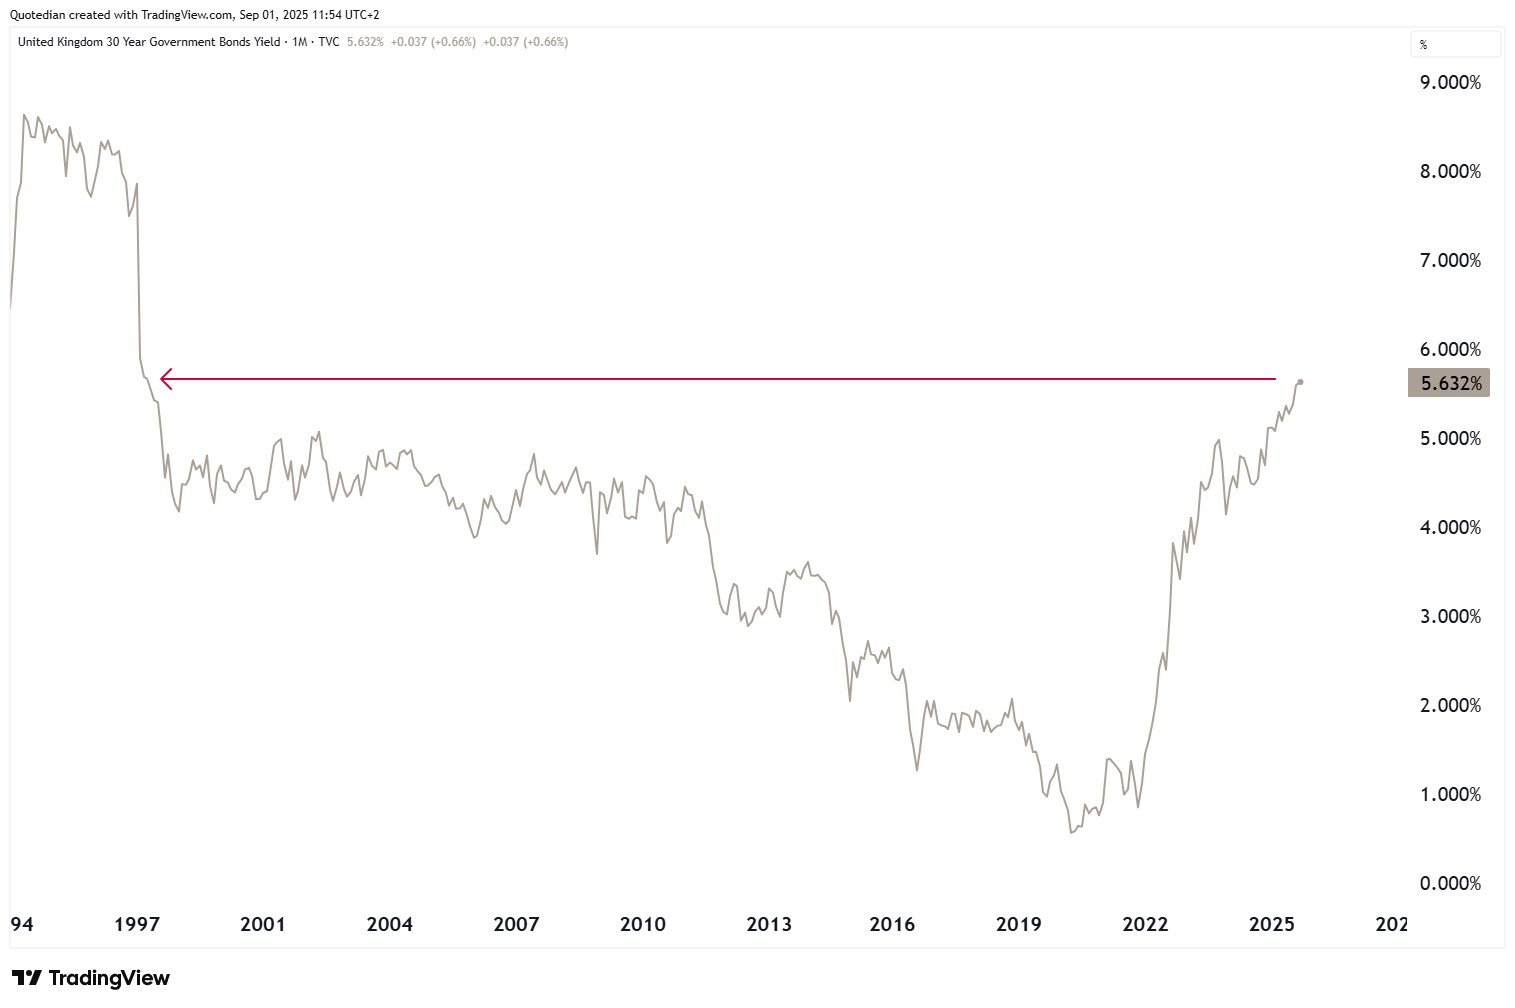
it’s also well above the Truss moment (remember? Truss 0 - Lettuce 1) highs of 2022:
Both of the above facts are also true for the 30-year inflation-linked bond yield:
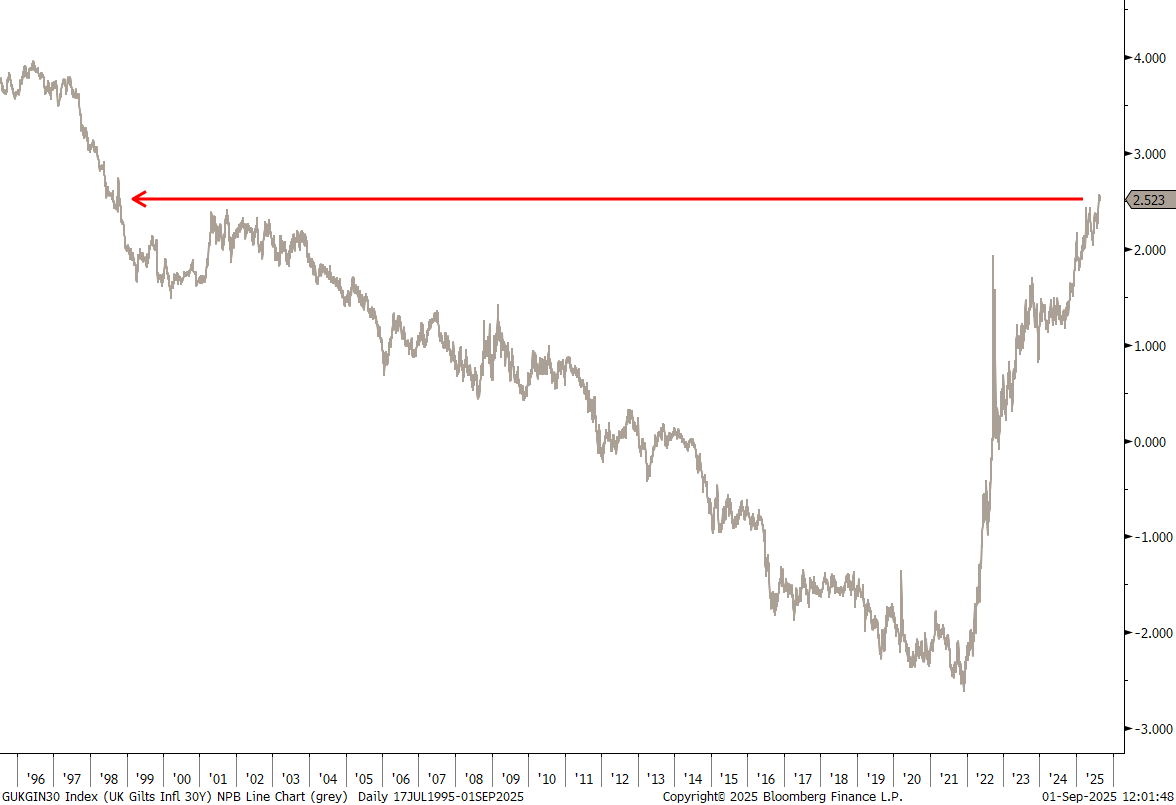
And talking of Liz Truss, she’s currently actively promoting her latest book, ominously titled: “Ten Years to save the West” …


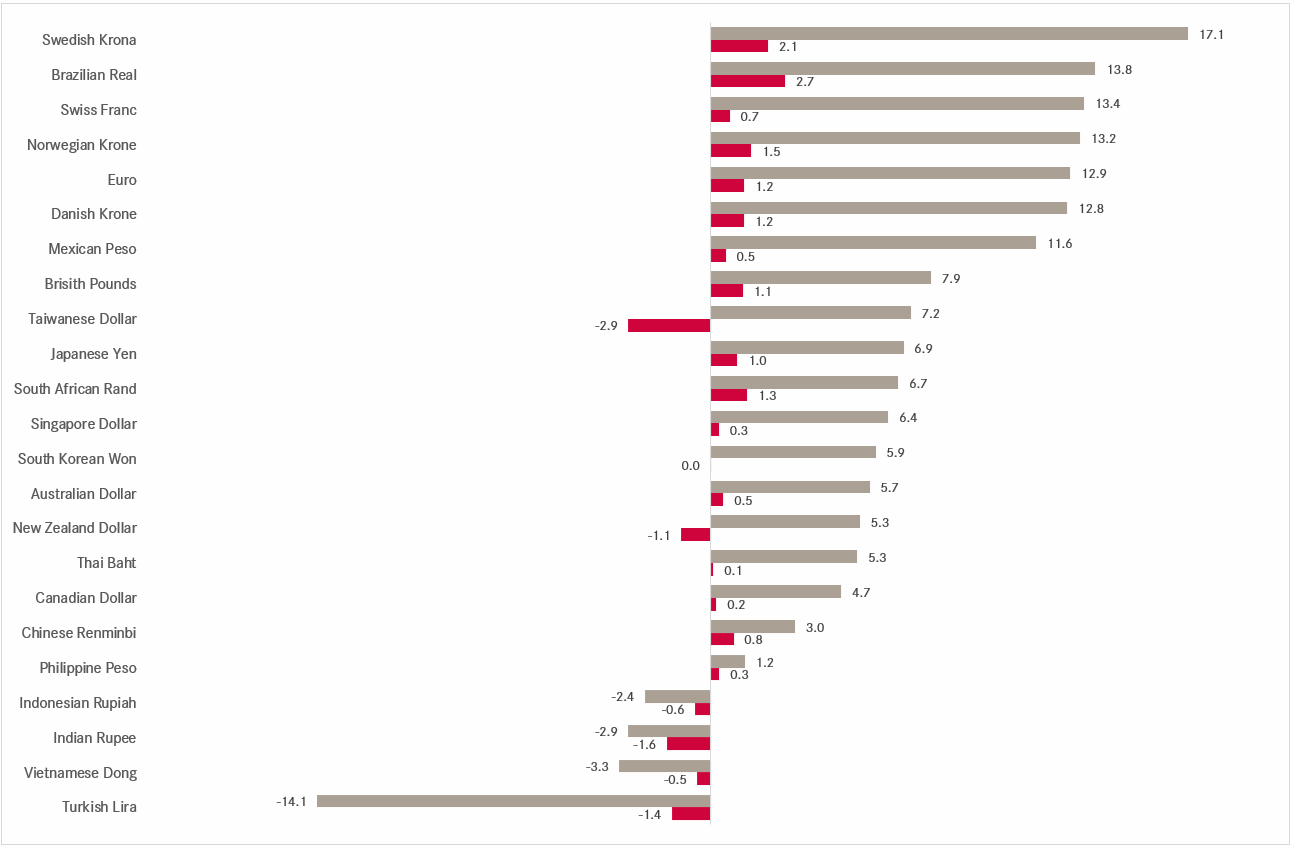
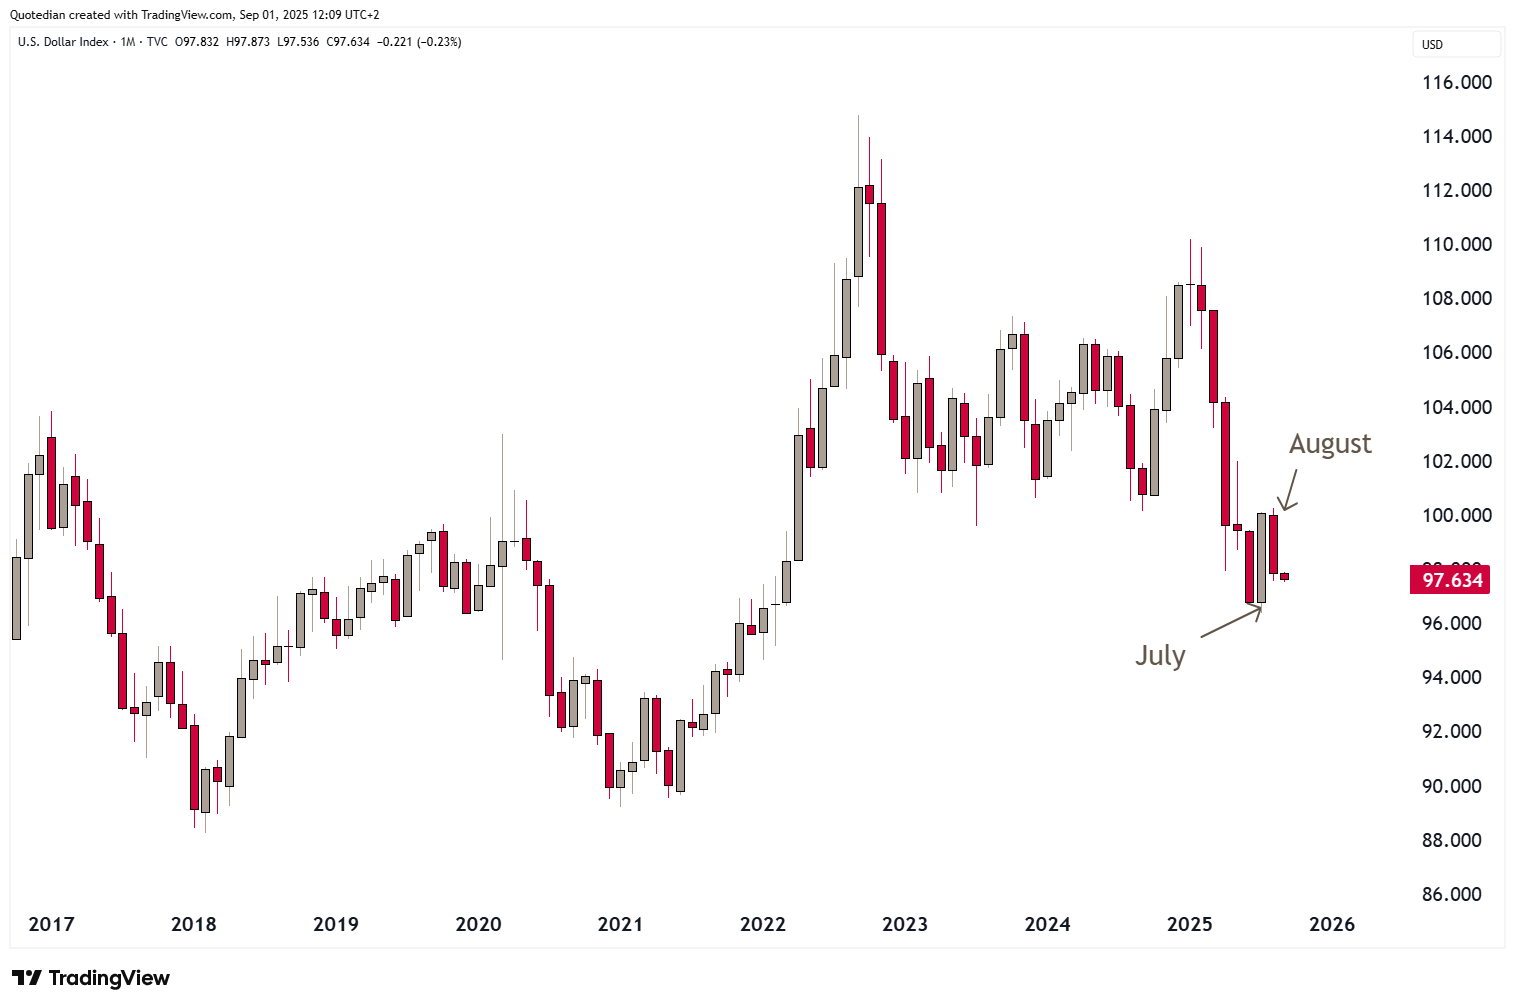
In currency markets, most major currencies have expanded on their already hefty year-to-date gains during August:
The US Dollar Index (DXY) reversed nearly all of its 3.2% July advance:
A similar (reverse) situation can be observed on the EUR/USD monthly chart:
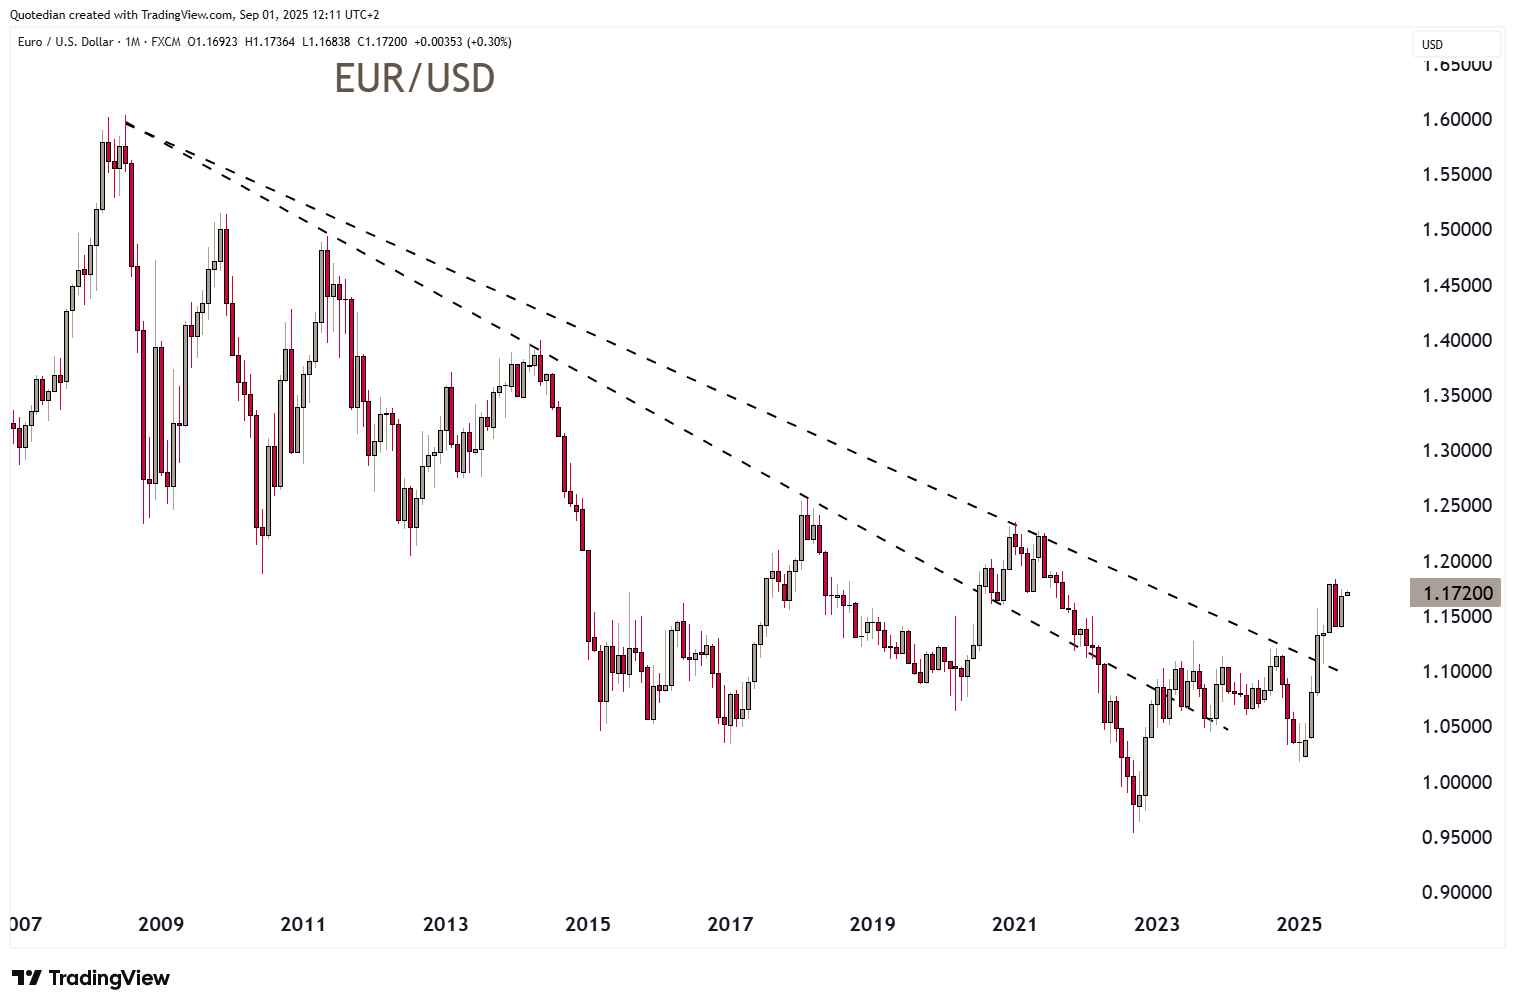
As long as this cross stays above 1.1350 the likelihood for a push well above 1.2000 remains elevated.
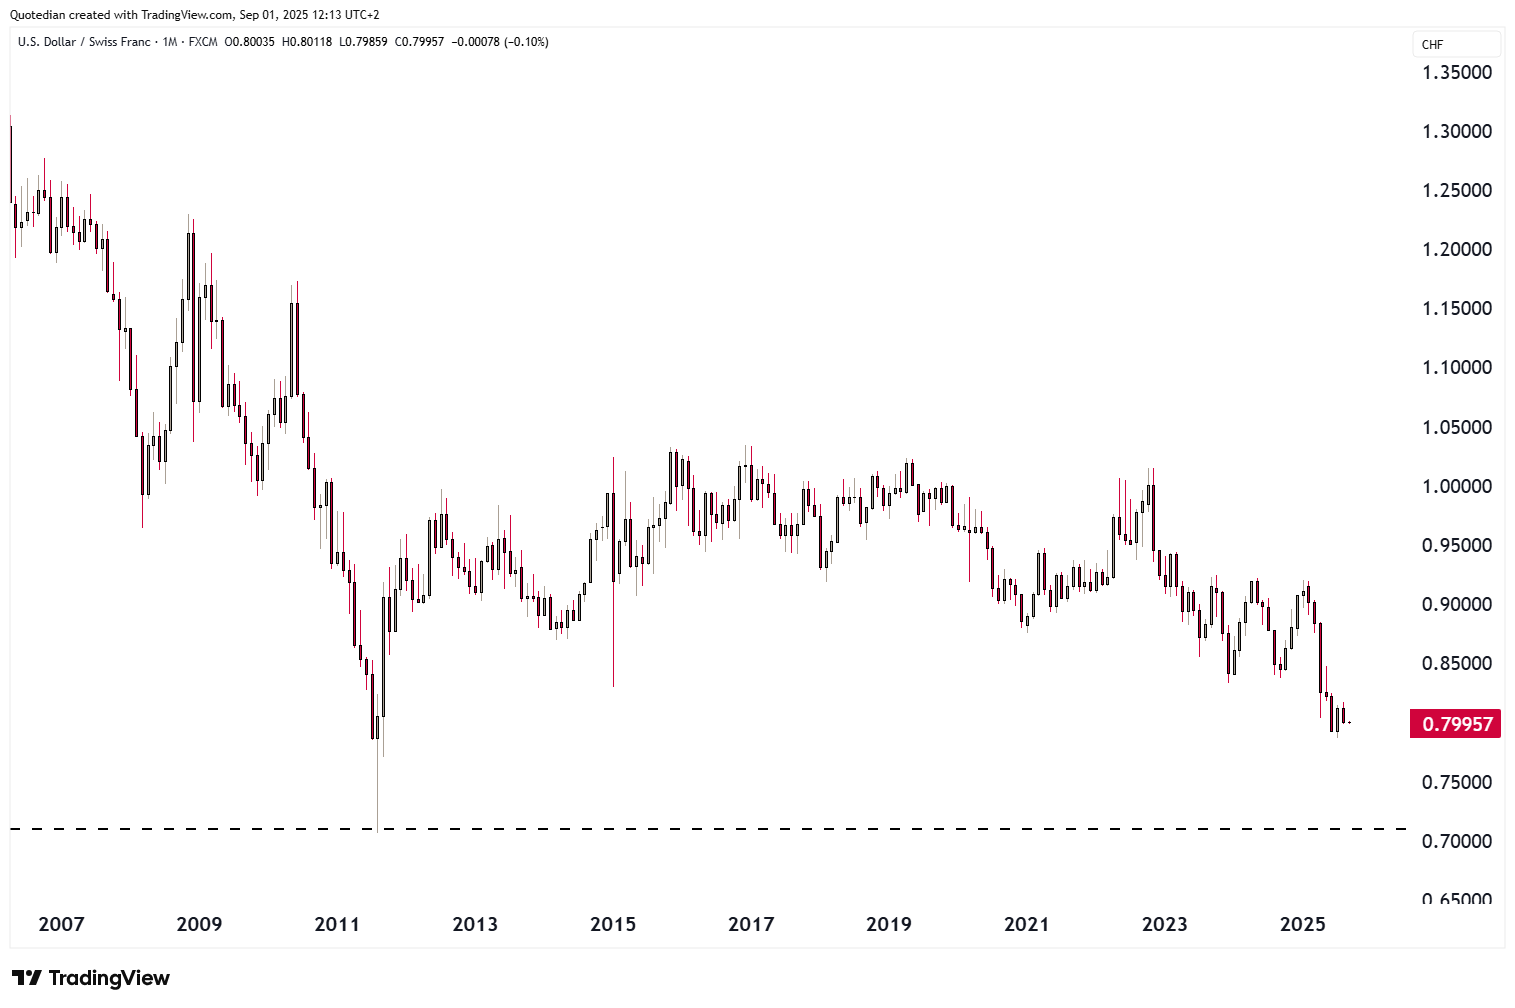
The USD/CHF seems to be on its way to 0.75 and below:
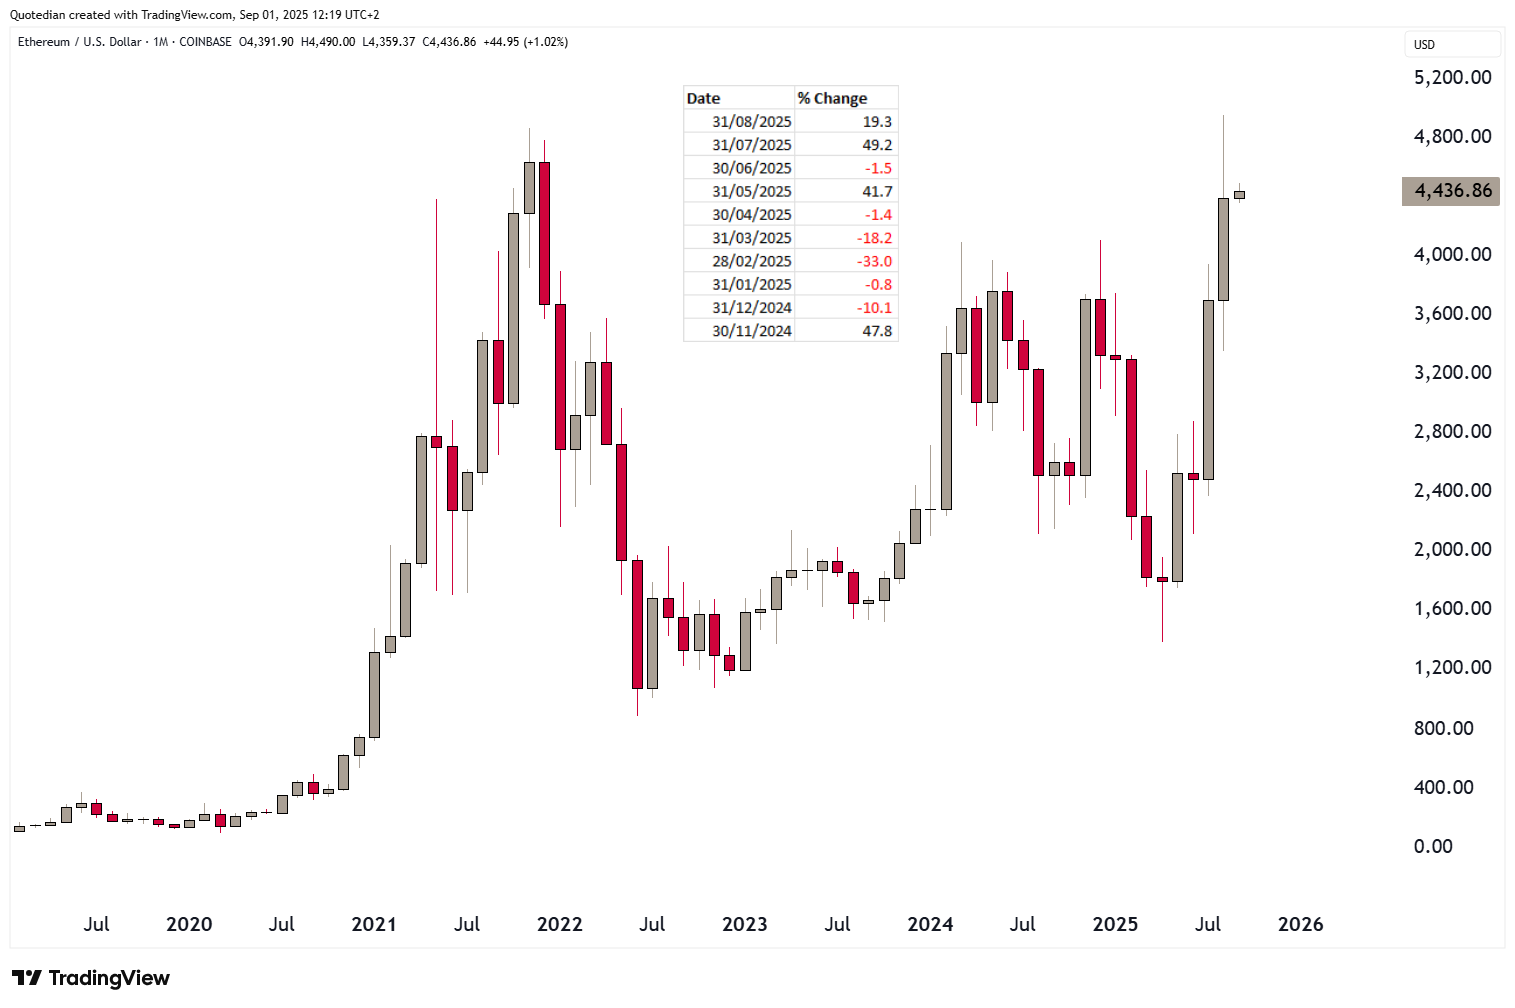
In cryptocurrency markets, Ethereum had a fantastic 20% run in August, becoming the second best performing ‘major’ cryptocurrency just behind XRP:
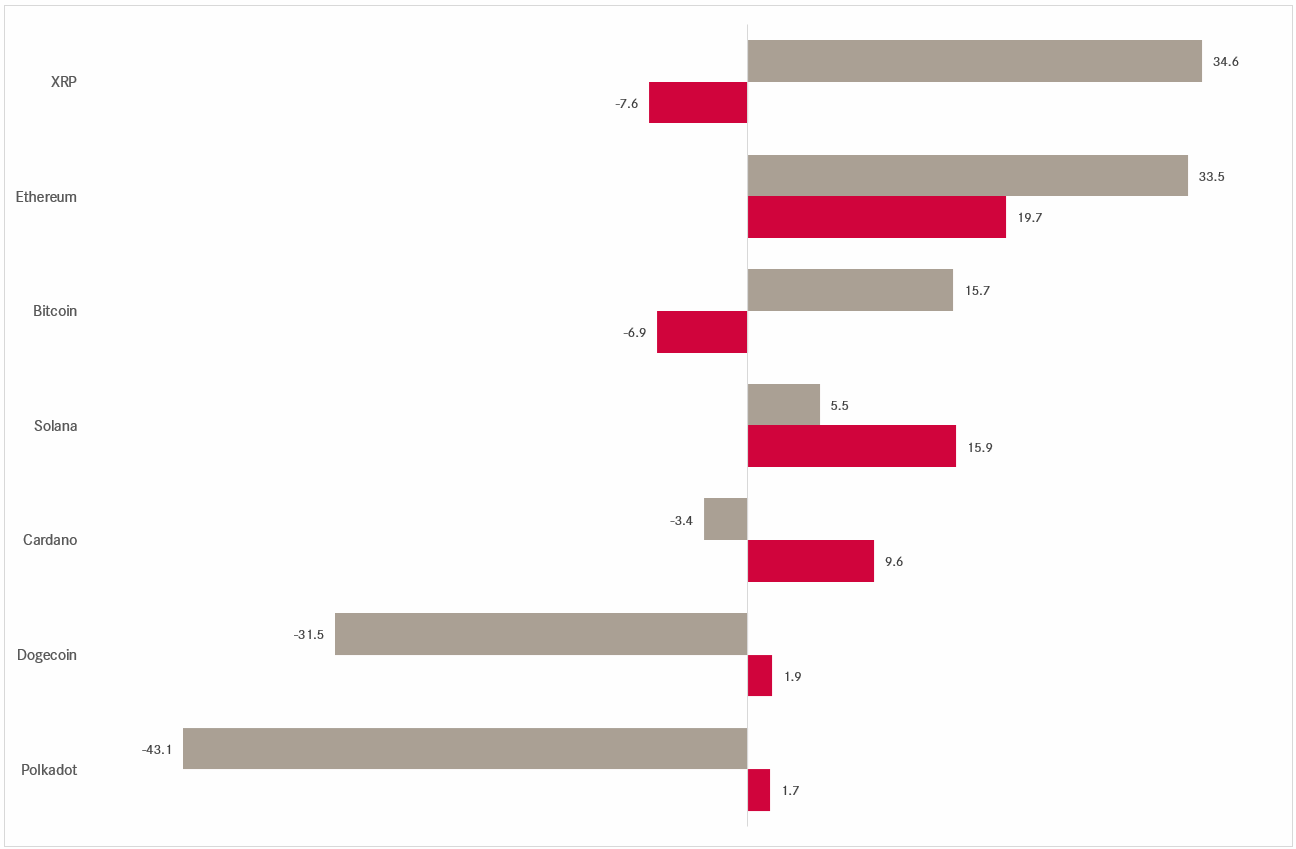
It’s been a wild few months for ETH since last November:
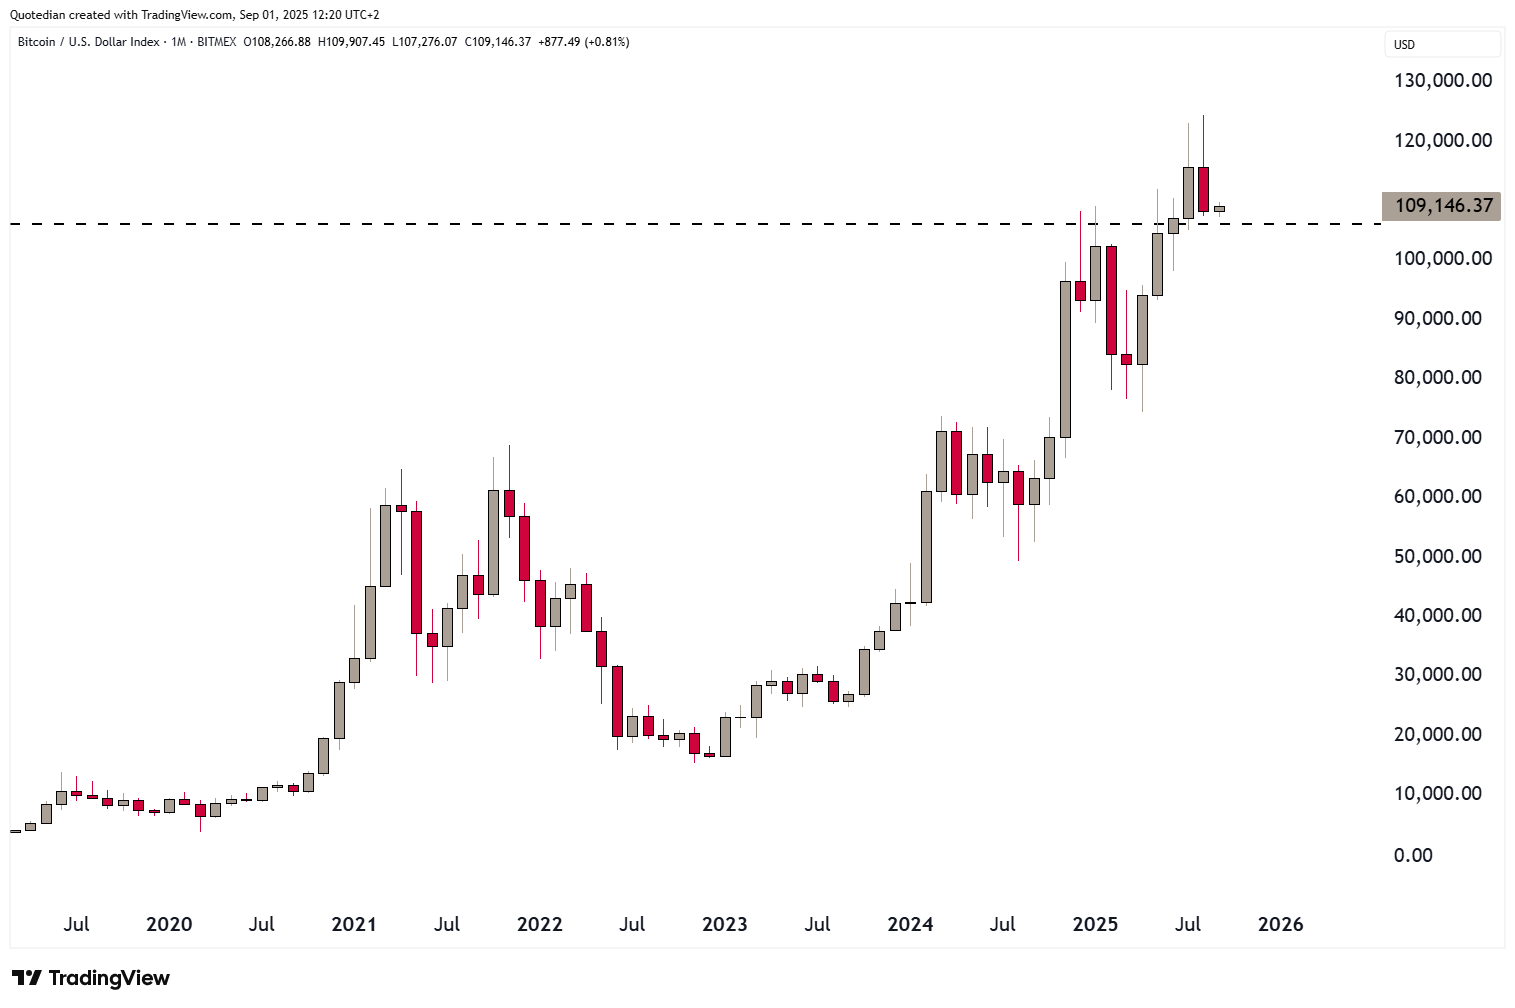
Bitcoin tried to crack the 120k level for a second month in a row and … failed for a second time:
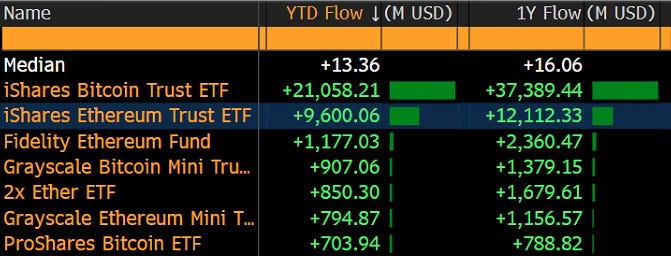
The flows into some of the most important cryptocurrencies has been massive this year and over the past twelve months:

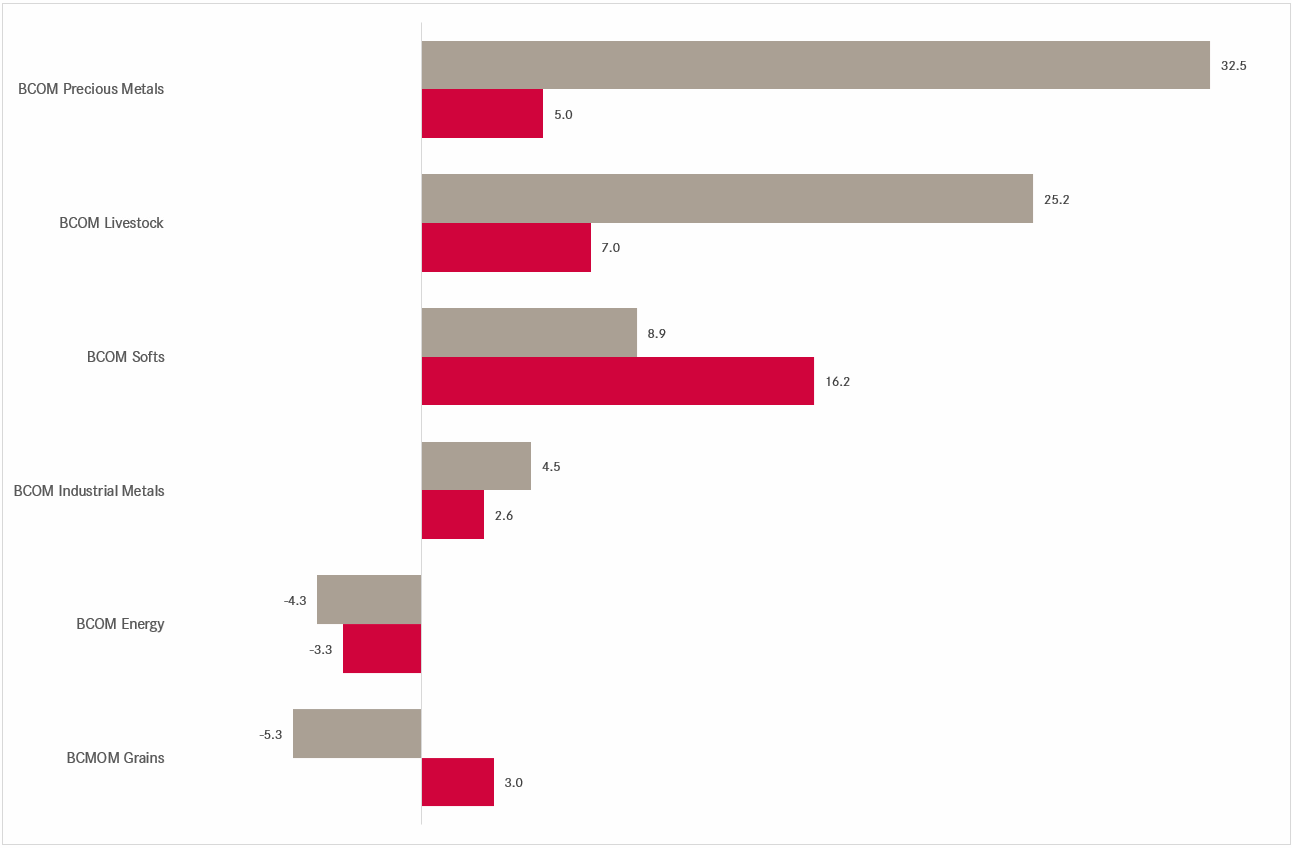
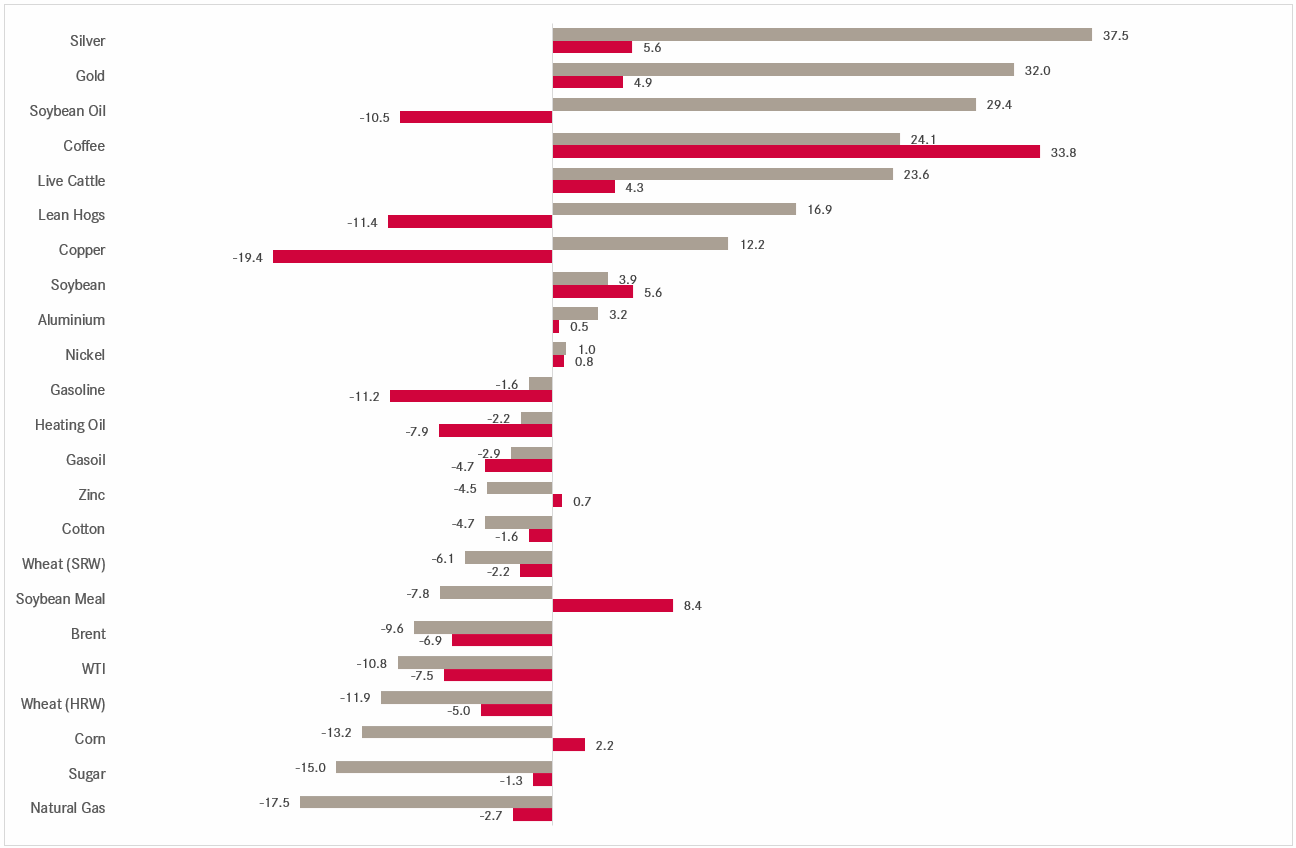
In commodity '‘sectors’, livestock and softs had a brilliant run in August, but year to date precious metals continue to wear the commodity crown:
A glance at some of the most popular commodity futures reveals that Gold and Silver are continuing to attract a lot of investors’ capital:
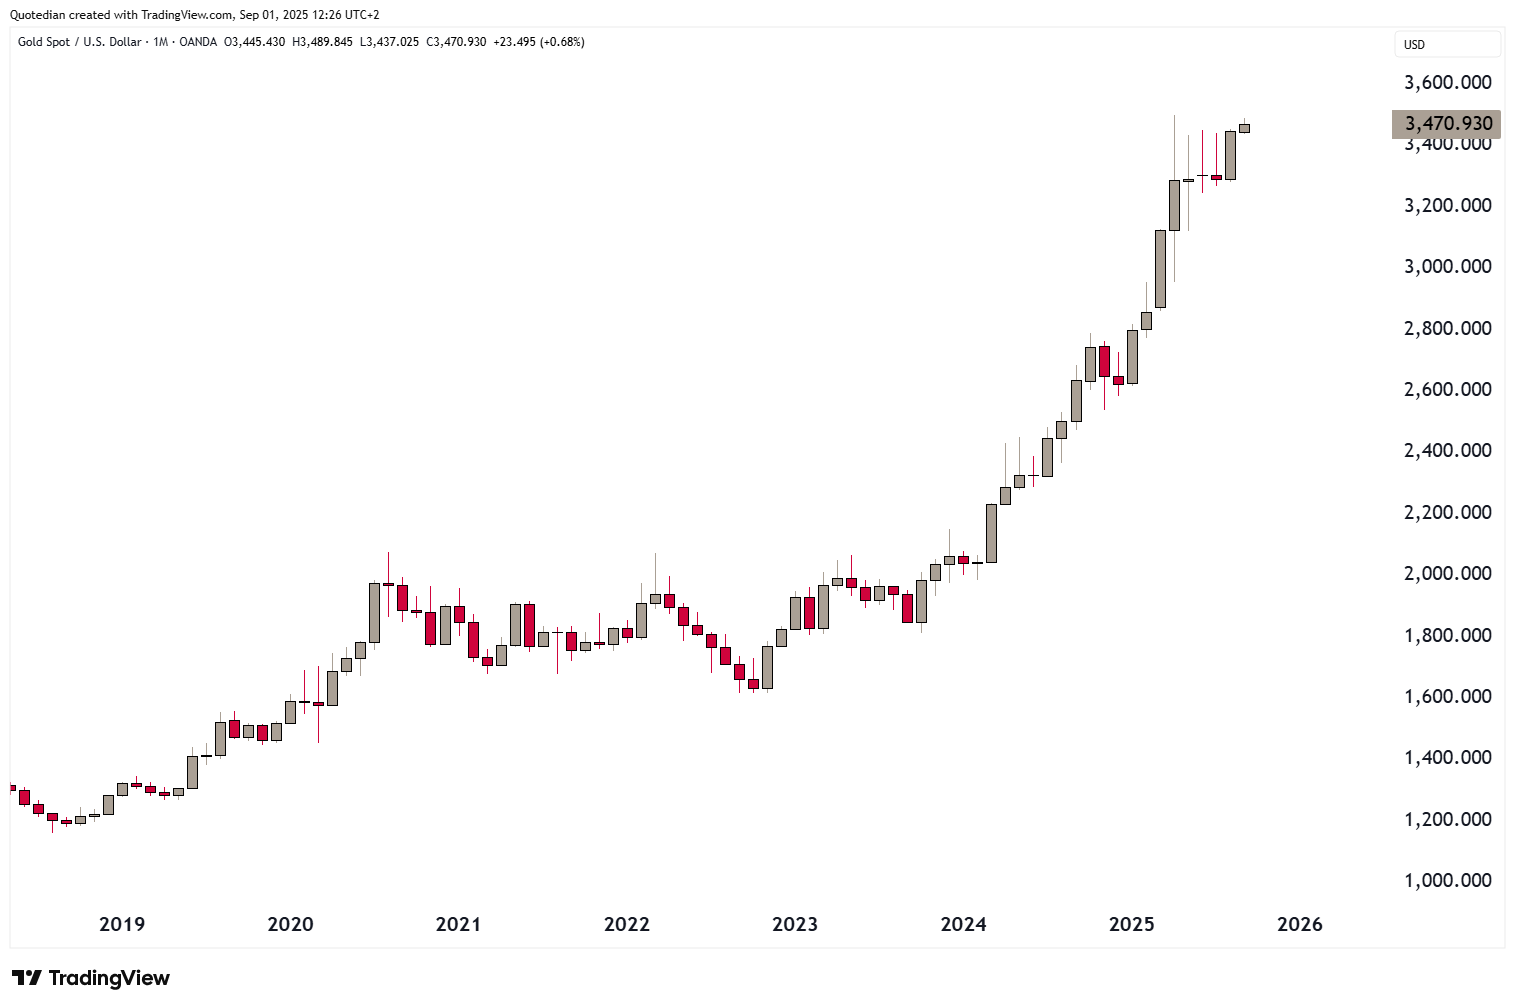
Gold has now clearly broken out of its consolidation triangle and is challinging its intra-month all-time high at $3,500:
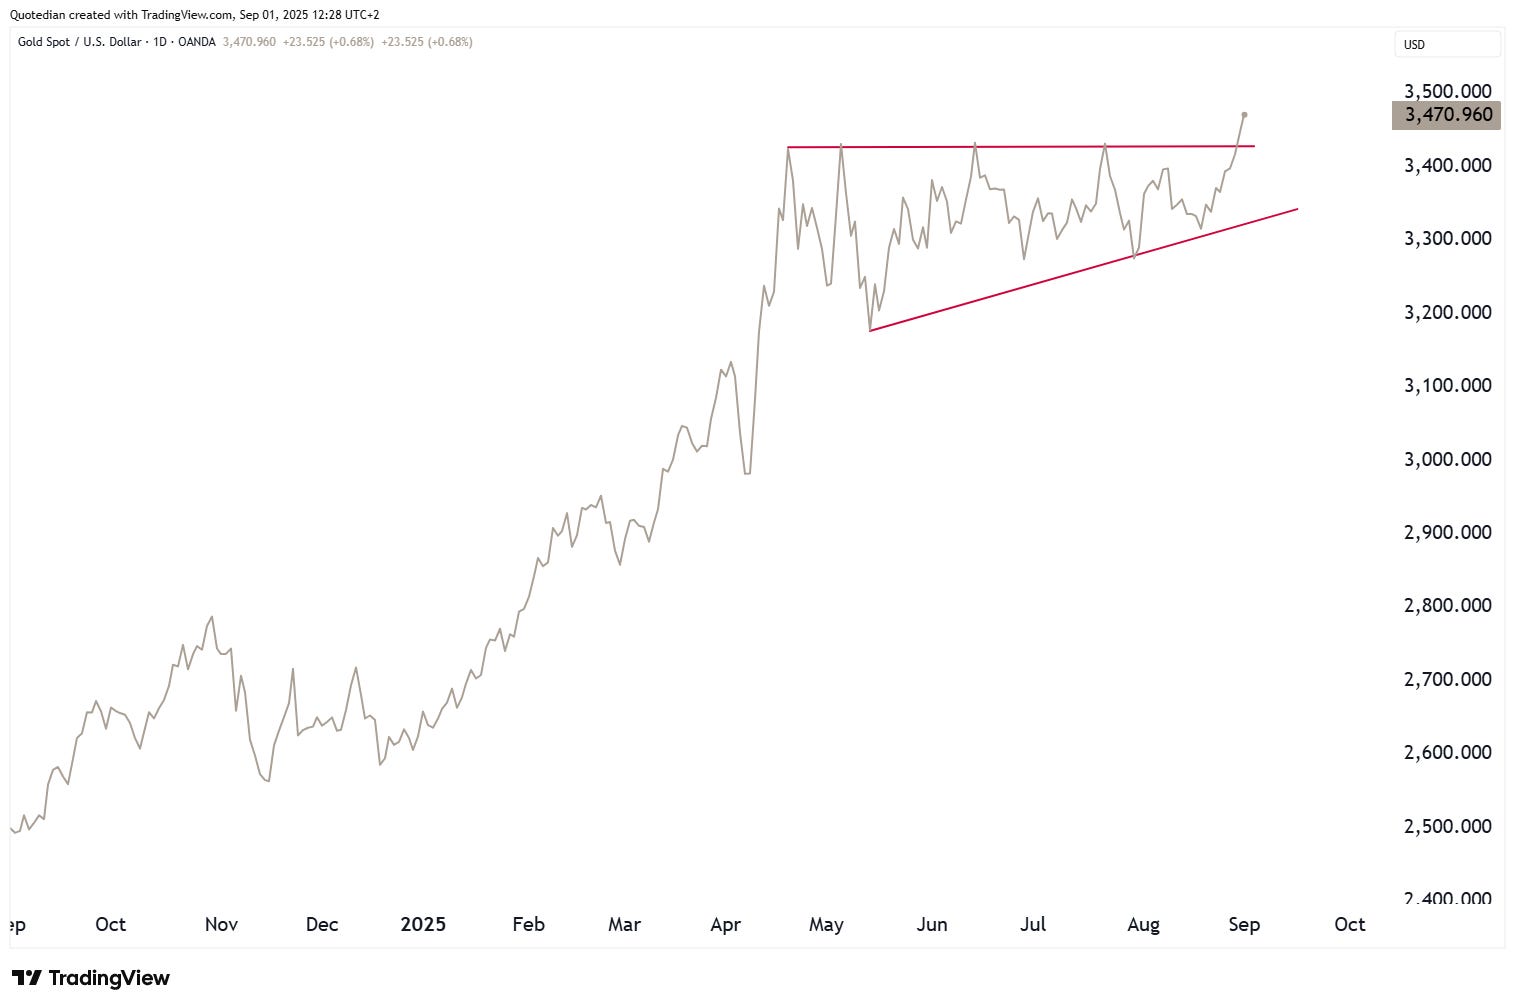
A daily line chart highlights better the importance of this breakout:
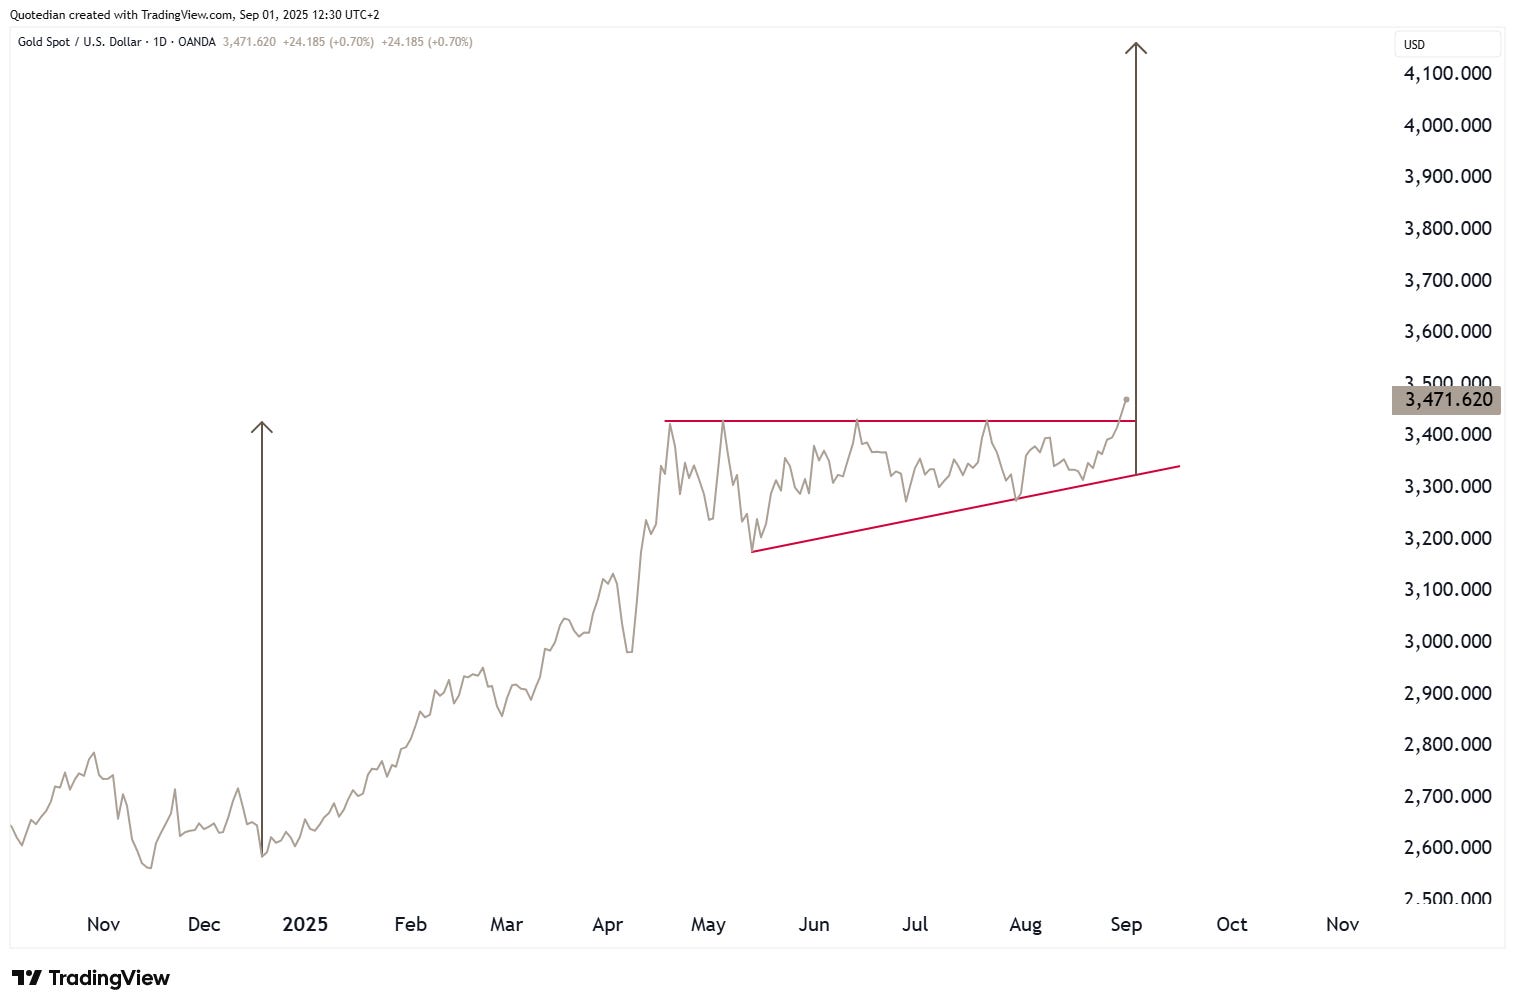
A simple TA rule (pole & flag) has now a calculated price target of 4,160 to 4,280:
And then there Silver, which saw it highest monthly closing since August 2011:
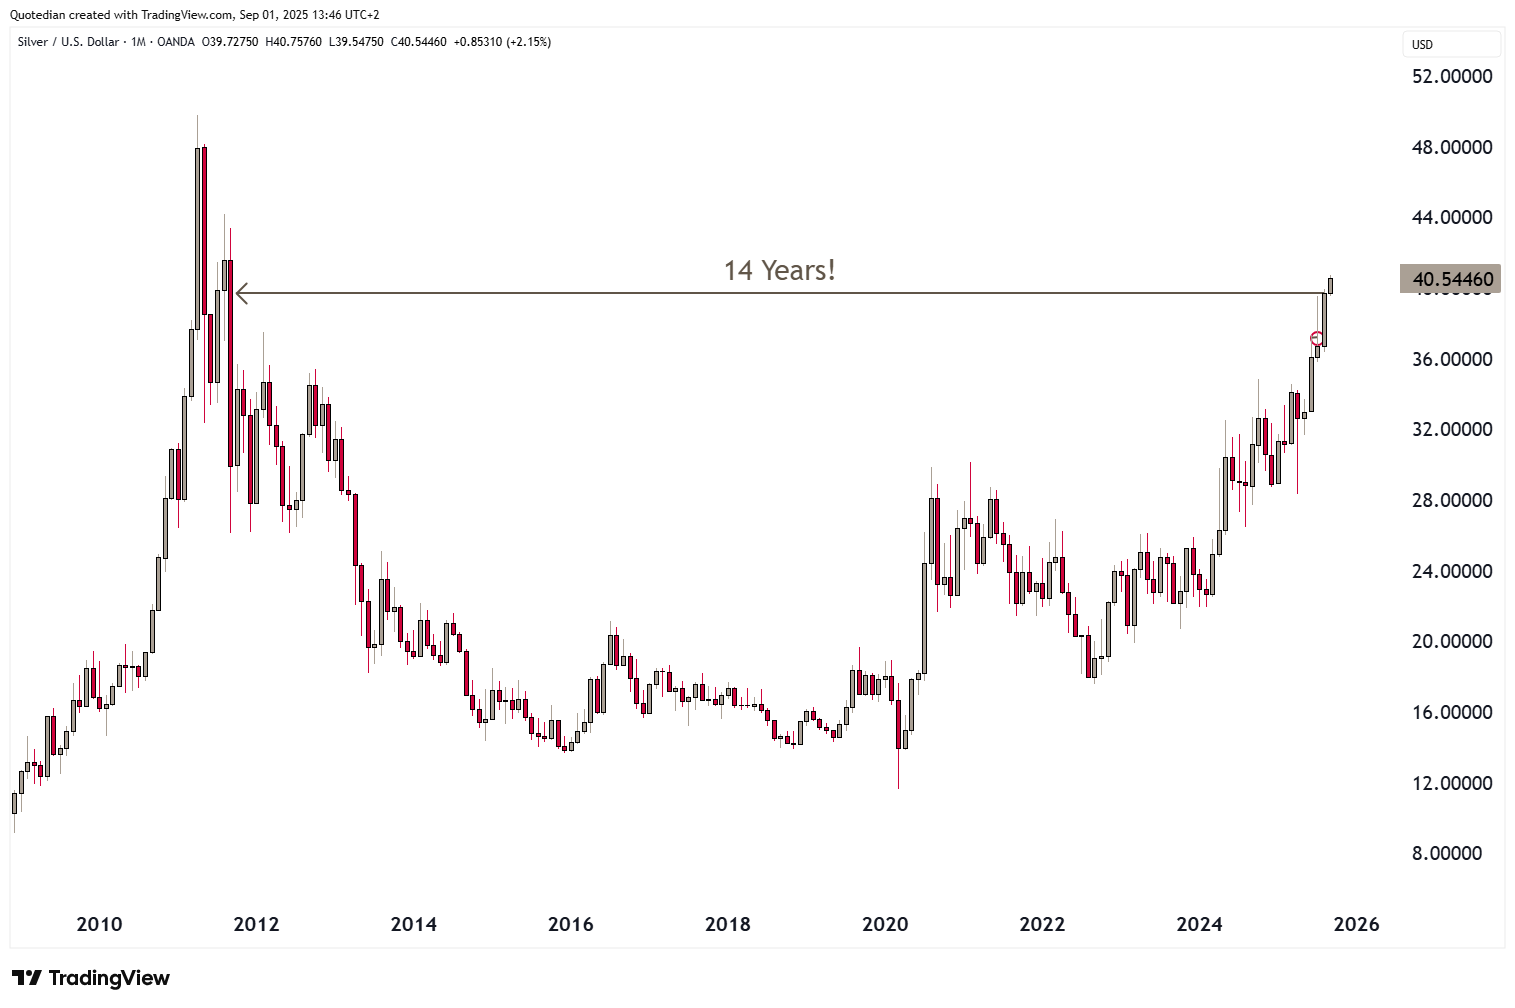
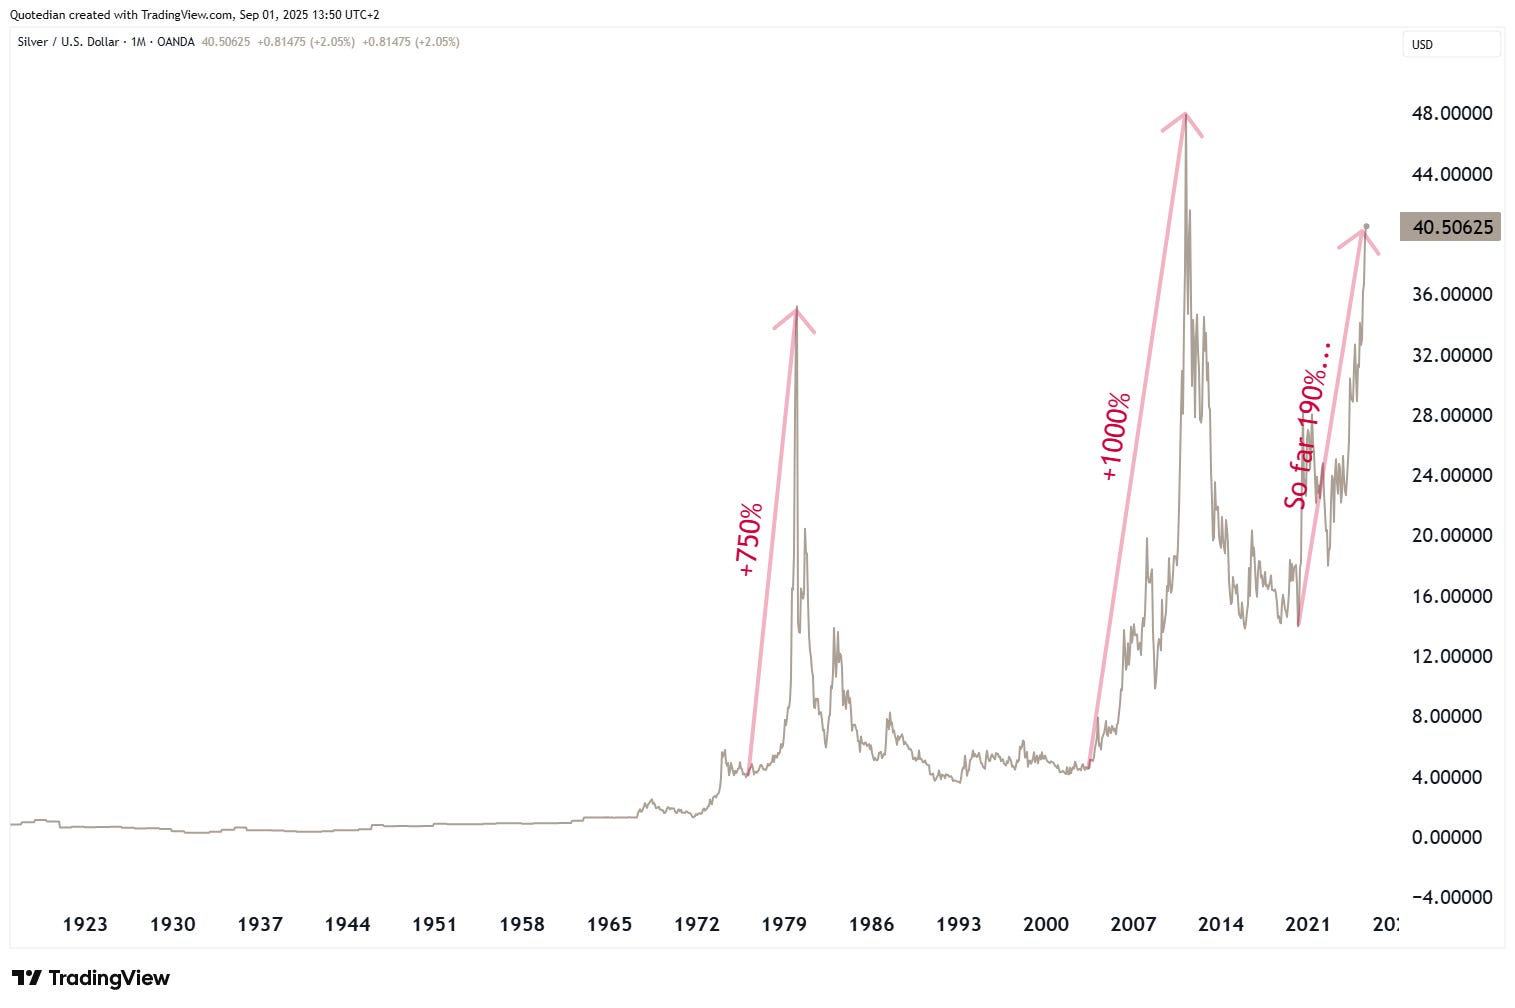
Below an updated version of a Silver long-term chart we showed a few months ago. We had to update the ‘so far 150%’ bit to ‘so far 190%’ …
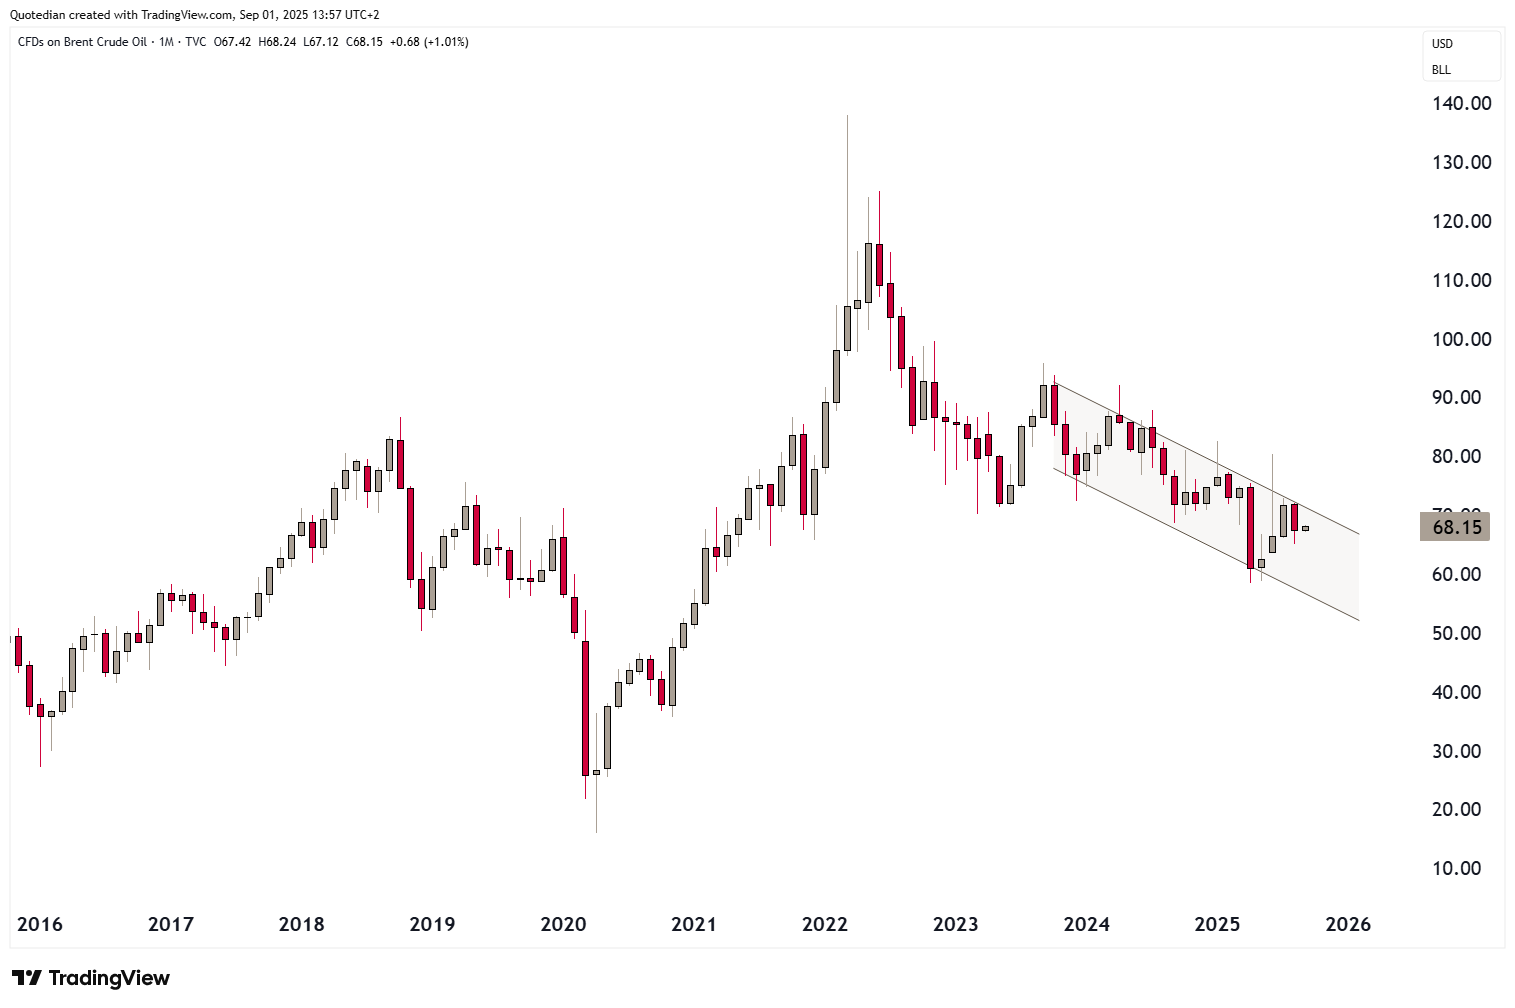
Oil continues in its strange sideways/downwards range:
Which is maybe bad news for the overall commodity complex and investors therein (S&P GSCI Commodity index below),
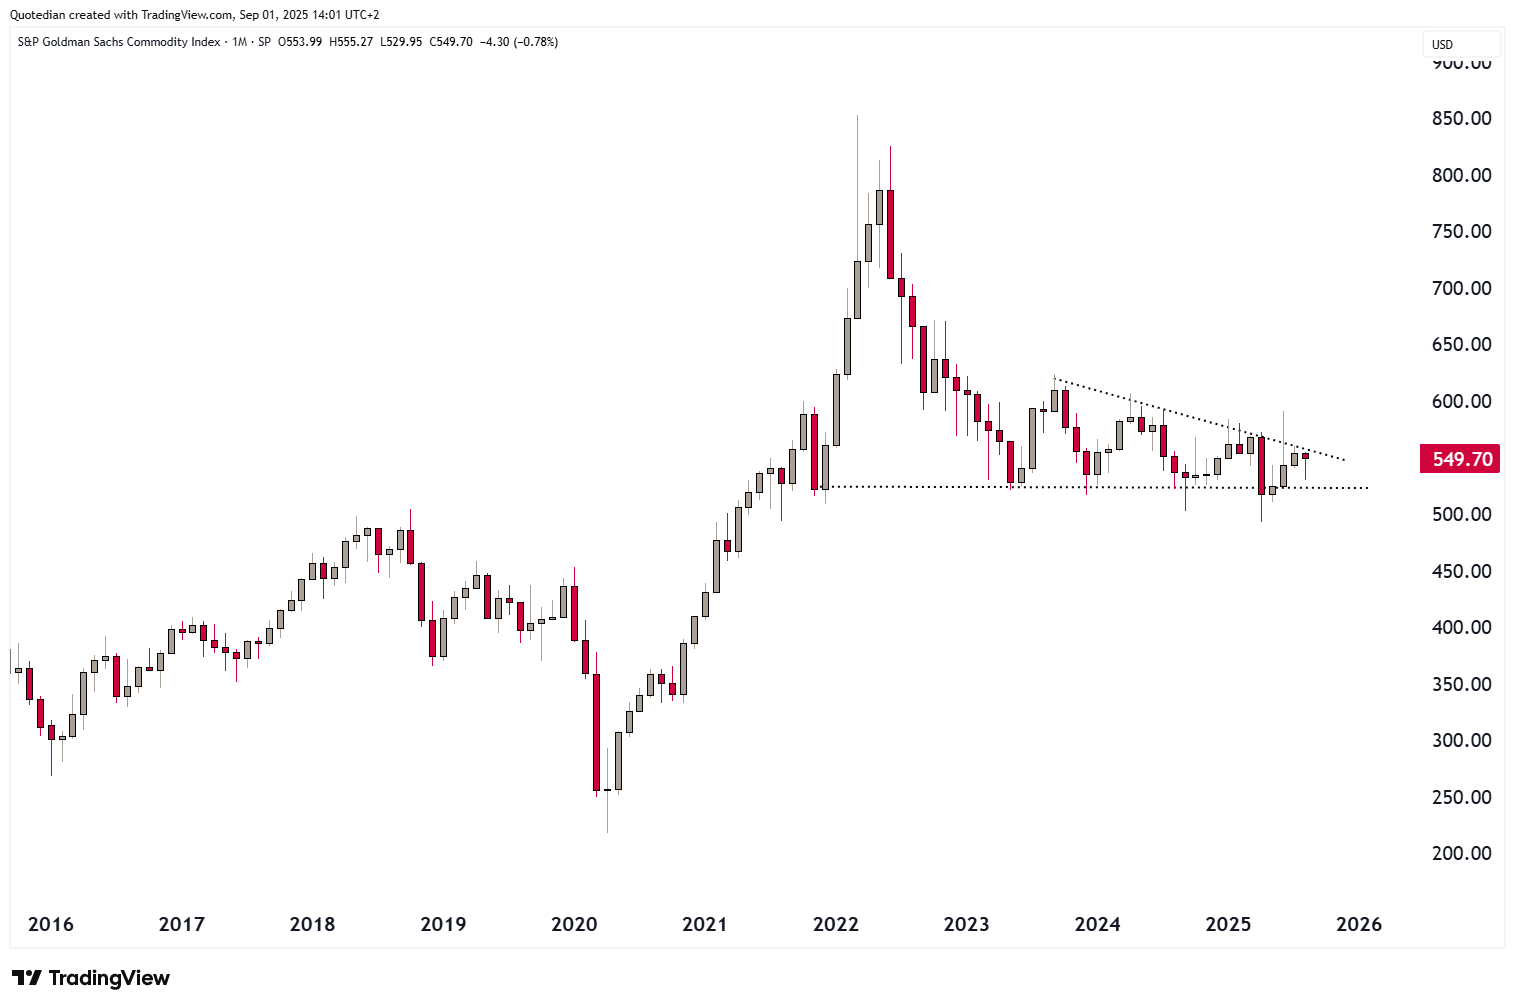
but probably good news for overall inflation expectations….
That’s all for today, make sure to sign up to the QuiCQ (www.quicq.ch) for daily (Tuesday through Friday) updates.
Have a great week!
André

In reality, you need no other Disclaimer than the one above, but just in case:
Everything in this document is for educational purposes only (FEPO)
Nothing in this document should be considered investment advice
Investing real money can be costly; don’t do stupid shit
Leave politics at the door—markets don’t care.
Past performance is hopefully no indication of future performance
The views expressed in this document may differ from the views published by Neue Private Bank AG