

Something's Fishy
The Quotedian - Vol V, Issue 137


"The dollar is our currency, but it's your problem"
— John Connally
DASHBOARD

AGENDA

CROSS-ASSET DELIBERATIONS
That was only a half-hearted attempt at a ‘Turnaround Tuesday’ yesterday, or wasn’t it? Well, on the surface there was not much cuteness to be had. Most European indices closed lower, whilst the US market was pretty mixed with Dow and S&P down, but Nasdaq and Russell 2000 higher.
Under the surface, some improvement was visible, with “only” three stocks falling for every two advancing (that was 9:1 on Monday, remember) and four out of the eleven economic sectors in the S&P 500 also showing some gains on the day:

What is probably truly interesting on the performance chart above (and remember, one day does not make a trend), is that defensive sectors (staples, utilities, RE) underperformed, whilst more cyclical sectors (Energy, consumer, materials) outperformed.
We got an accordingly messy market carpet too:

Please do not mis-interpret the following series of charts as a bullish argument, as I continue to lean that we are in a secular bear market. But looking for the cyclical or at least tactical countermove, or maybe better said, what could go wrong with the bearish scenario, let’s have a look at a couple of pretty, colourful pictures. First of all, many equity indices charts show a similar pattern of prices right at key support:
Here’s the S&P 500:

Or here are US small cap stocks:

A little more leeway for the Nasdaq, but basically more of the same:

European stocks (SXXP) have already broken their June support, however, are holding at the ‘Last Chance’ level we discusses yesterday:

The CNN Fear and Greed index is getting closer to capitulation area:

And the CBOE Volatility index (VIX) is not at extremes, but also not extremely far away from extremes (ha!):
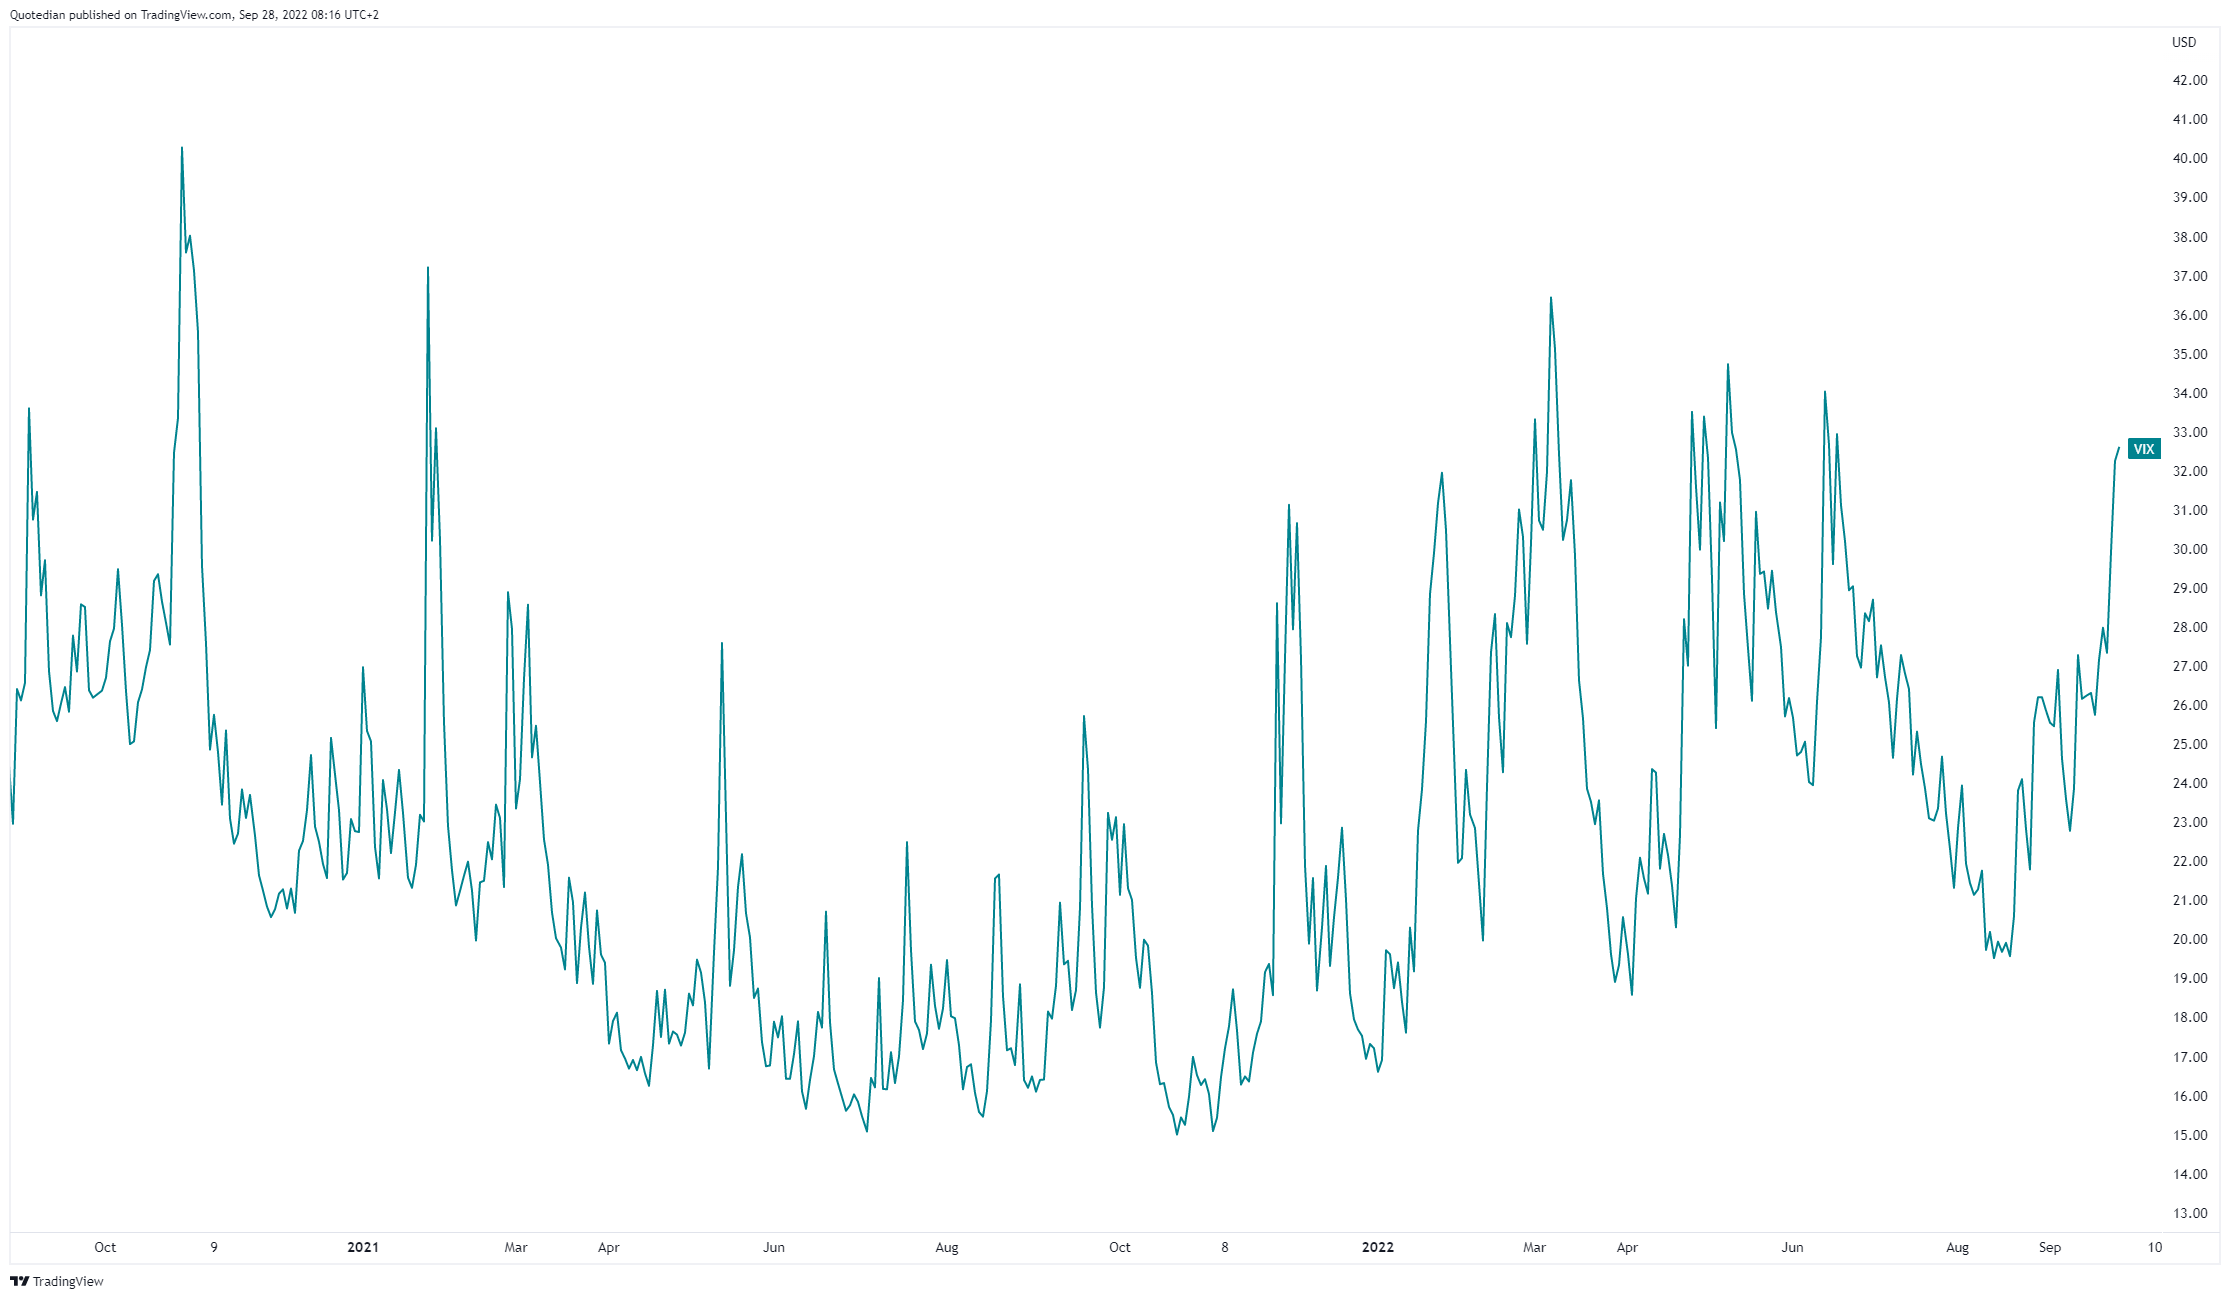
Now, I put up these series of charts above as stocks are falling pretty hard this early Wednesday morning. Most Asian markets are down in excess of one percent and European and US index futures do not look much sympathetic. This is probably on the back of a much stronger US Dollar (see FX paragraph below), after a White House Official (Brian Deese) said there won’t likely be another Plaza Accord-like pact to counter the Dollar strength. Many were expecting just that at the next G20 retreat in Bali in mid-November. So, be careful before you buy your SPXL OTM call options…
On to fixed income markets…
The last chart we looked at in the equity segment was that of the VIX, so let’s start the bond section, with the VIX’s fixed income equivalent, the MOVE:
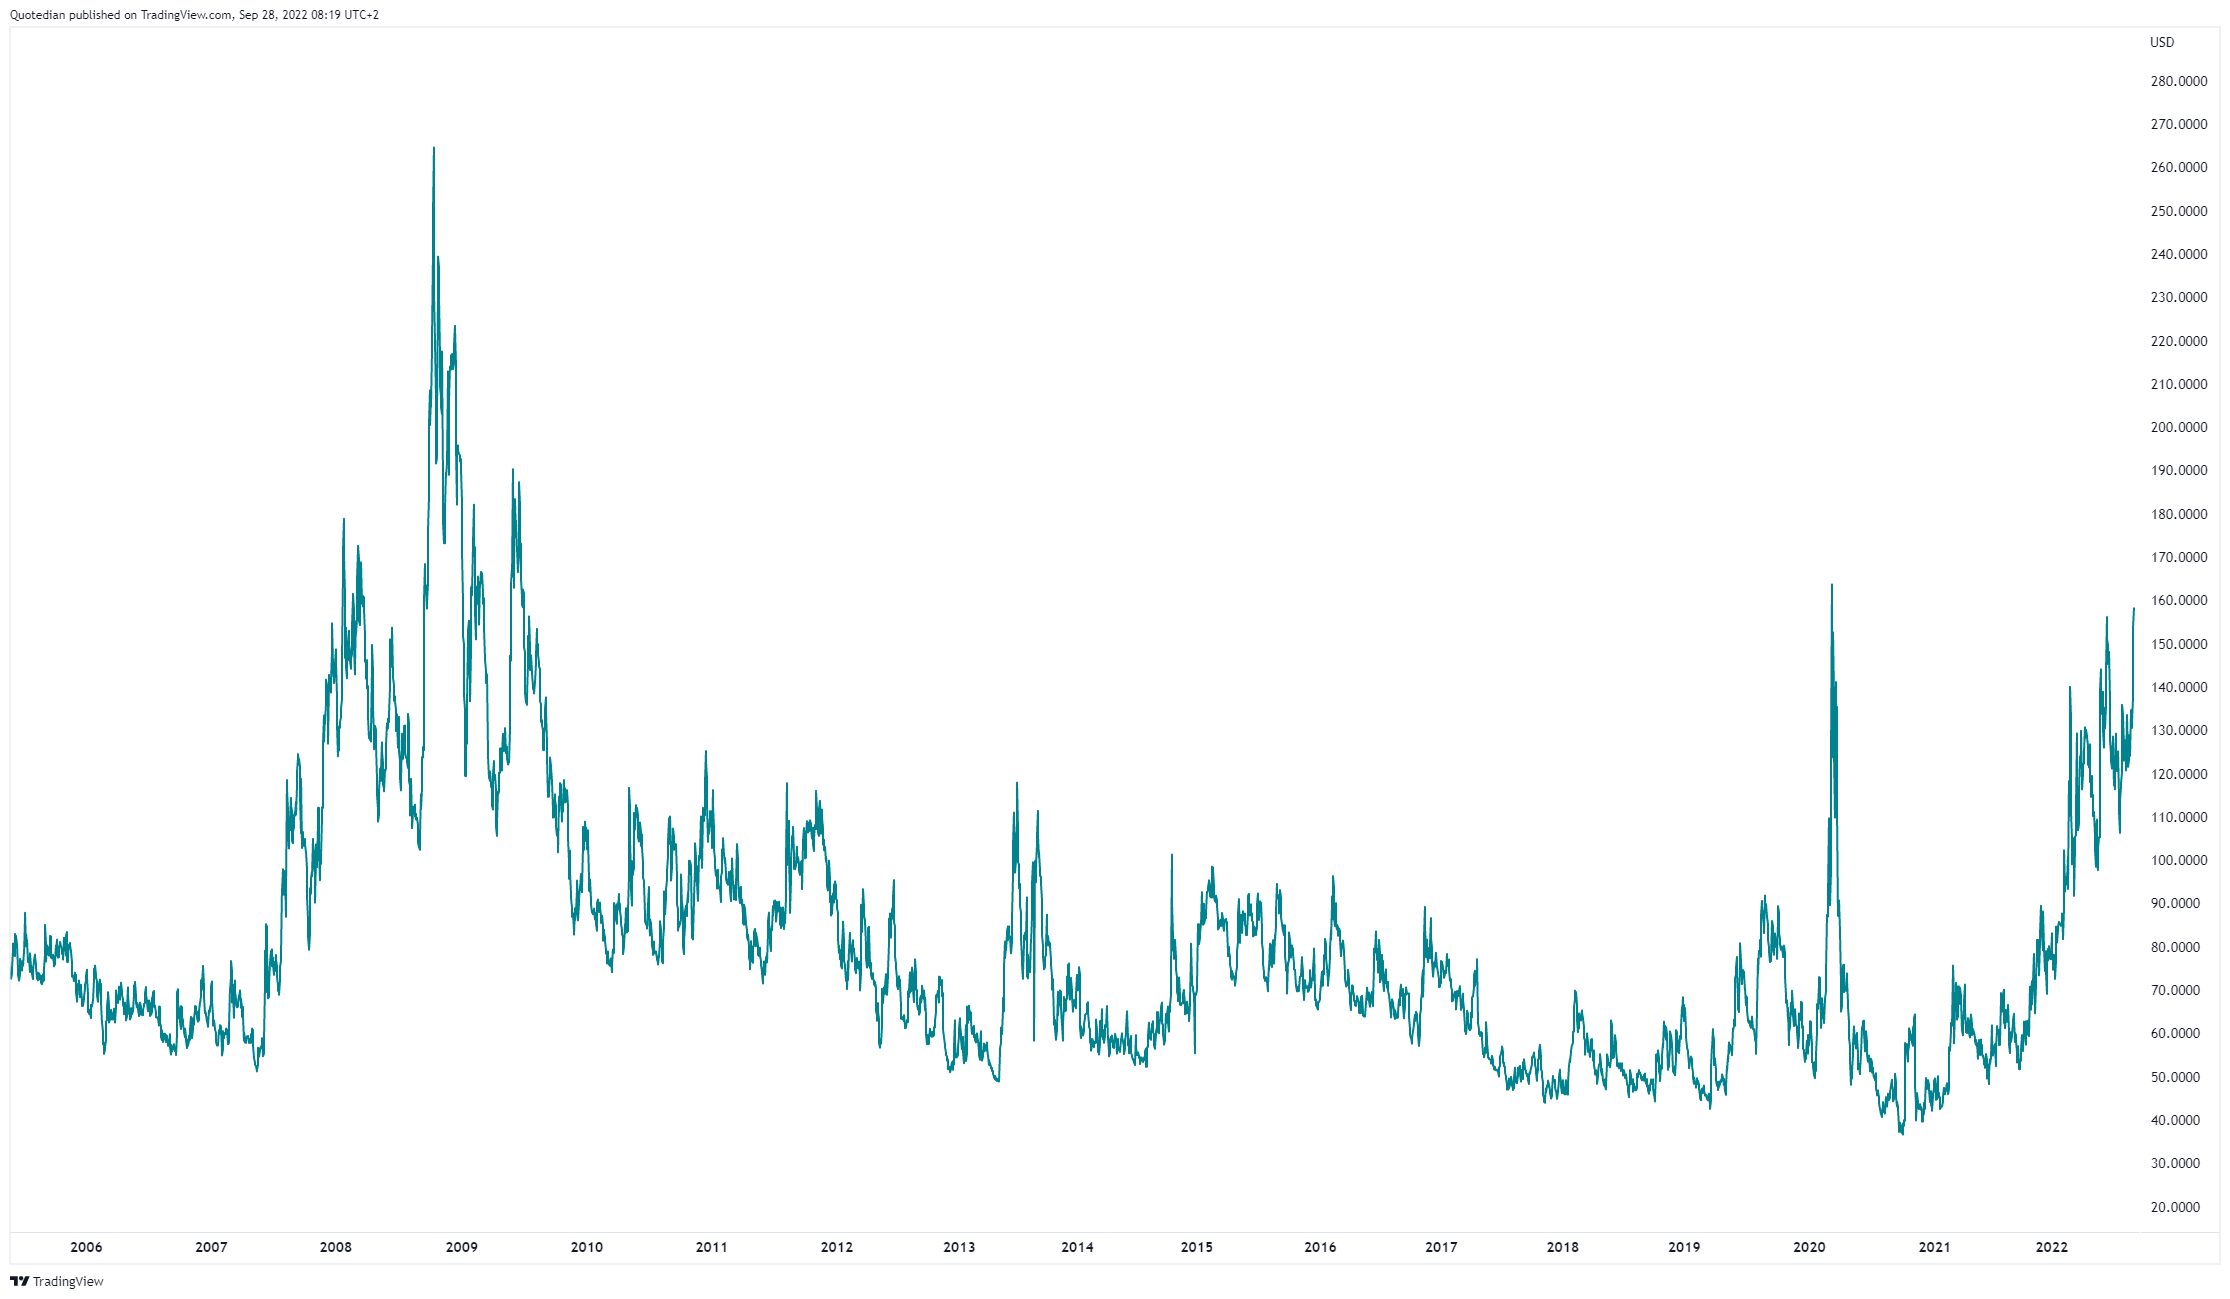
This chart is encouraging to those looking for a short-term bottom (top) in bond prices (yields). Those yield graphs clearly have a blow-off top feel to them. Here’s the US-10 year:

And here it’s German equivalent:

Want me to make my point-in-case regarding parabolic and possible blow-off top? Here’s the 10-year UK Gilt yield chart for you:

Here’s your typical Gilt trader this past few days:

Whilst I believe that it is usually the bond-dog that wags the equity-tail, there is no doubt that currently, the focus is on “one currency to rule them all”. The latest episode of denial by an important White House representative (as described above) that the $-strength is a problem and the subsequent reaction speaks for itself. Here’s the US Dollar Index (DXY):

Does the pattern ring any bell?
The EUR/USD is approaching our (temporary) 0.95 target and I for my part have started closing my EUR shorts. Whilst “the trend is your friend” is especially true for currency pairs once they get in motion, the Euro has lost now nearly a quarter of its value versus the US Dollar and is reaching the lower bound of its year-long trend channel:

Volatility, two both sides, can only increase from here and become too stomach-churning.
Ok, let’s hope quickly to commodities, where the Nordstream incident has been giving some talk (and volatility) in the energy sector. This was observed yesterday:

Apparently, parts of Nordstream I + II are suddenly leaking and the finger-pointing of sabotage has begun:
Was it the Russians? Perhaps, but probably not. Already cut off gas supply anyway
Was it the Americans to prevent the Europeans from crawling back to an abusive gas supplier? Perhaps, probably not. Russian switching off the gas (see previous bullet) is the better PR point for the US
The Ukrainians? Perhaps, but probably not, as they could have blown up the pipes which still run through their own territory and save some deep-sea diving hassle
The Germans? Probably not.
Some of the Baltic states? Perhaps.
In any case, somethin’ fishy and oil and gas (including energy-related stocks) found some timid support.
Time to hit the send button, have a great Wednesday!
André
CHART OF THE DAY
A tweet earlier yesterday from the visionaries at ARK Invest. Now, THIS is hilarious:

This is the announcement of their apparently highly anticipated VC (venture capital) fund for retail investors. The fund, available from $500 onwards, will sport a 2.75% management fee plus a distribution fee, resulting in a TER (total expense ratio) of 4.22%
Nobody said promoting democracy comes cheap.
Thanks for reading The Quotedian! Subscribe for free to receive new posts and support my work.
DISCLAIMER
Everything in this document is for educational purposes only (FEPO)
Nothing in this document should be considered investment advice
Past performance is hopefully no indication of future performance