


Still Going!
Vol VII, Issue 37 | Powered by NPB Neue Privat Bank AG

“Markets can remain irrational longer than you can remain solvent.”
— John Maynard Keynes


Indeed, the appropriate name for the ongoing (US) equity rally might be:
“The Duracell Rally”
But of course we will not call it that in order to get into a legal battle over copyright and/or trademark infringements. But still, the current advance in the S&P 500 is now officially the best rally so far this millennia:

So, without further ado, let’s dive right in to our Sunday (for me)/ Monday (for you) review of recent market happenings.

Exhibit A of the current risk-on rally is of course the almighty S&P 500:

The following is probably going into the gallery of FAMOUS LAST WORDS (BTW, great song by My Chemical Romance), but there is very little bearish to say about this chart. Even drawing some lines and trend channels doesn’t give a meaningful reason to sell:

At the most, zooming out onto a weekly chart, we could argue that we just got a TD Sequential sell signal (the 9 on the price chart) and we can also observe a divergence between momentum indicator (RSI - bottom clip) and price:

But even the previous 9s were rather short-term correction signal, sometimes not exceeding a week …
So, please allow to completely jinx it now, but, Ladies and Gentlemen … 6,000 here we come!

By all means, for those of you who already have read NPB’s Q4 outlook will be in the know that we decided to reduce our equity exposure back to Neutral after having nailed the ongoing rally nearly a year ago by going overweight in early November 2023. But risk reduction just recommended is very much event driven (US election), focusing on a very specific tail-risk. But please, read it for yourself by clicking on the NPB logo below,

or, listen to the executive summary presented by this handsome fellow:
NPB CIO Office Outlook Q4_2024

Again, and this is important, we are NOT bearish on equity markets, but rather take some chips off the table after a very decent run. Also note that we reemploy the capital via a convexity trade (convertible bonds).
OK, with that out of the way, let’s continue our journey of stock market celebration.
Additionally bullish can be interpreted the S&P’s bullish price behaviour, in a period that seasonally should be weak:

And then there is Papa Dow (DJ Industrial index), which is on its march to 50k and beyond. The real good news here, especially for Dow Theorists, is that the DJ Transport index (lower clip) is less than 1% away from reaching a new recovery high and now less than five percent from a new ATH:

This has been one of the missing elements of the rally and should be considered super-bullish.
Switching to technology stocks, which have been lagging since July, here’s the chart of the Nasdaq 100, about to producing a bullish break, which then would needed to be confirmed by reaching a new ATH above 20,675:

The development of tech stocks from here will be important to watch, as much on a absolute basis (see above) as well as from a relative point of view. As we discussed in The QuiCQ last Friday (click here), tech stocks stopped their outperformance a few months ago, at a spot that makes sense:

However, and zooming in on the same chart as above, technology stocks have either a) resumed their outperformance or b) are creating the ultimate confirmation of a multi-year underperformance period by putting a shoulder-head-shoulder top into place:

Looking at same underlying segments of the tech sector, a) would seem the more plausible outcome for now. For example, check the software segment via the iShares Expand Tech-Software Sector ETF - IGV. After a consolidation period starting at the beginning of the year, the breakout is now very clear (and tradable):

Or, as a subsegment to this subsegment, have a look at the Amplify Cybersecurity ETF (HACK):

Same, same.
Ok, time to turn to European equity markets. The STOXX 600 Europe index is still working on breaking above that 525 level:

Sixth time lucky?
The Euro STOXX 50 equivalent is 5,100, albeit a tad further away still:

The DAX, whose home is in Germany, the apparent sick man of the European economy, is continue to be one of the driving forces for the equity market on the old continent:

Talking of sick men, here is France’s CAC-40:

But the Italian,

and the Spanish

equity markets are the true drivers of European equity strength (however fragile it may be).
Turning to Asia, Japan’s Nikkei index is a messy story, but looks like it is on track for new highs:

The sideways, with admittably stomach-churning and turning volatility is interesting to observe, as it has, as so many times in the past, got rid of the overextension of price over the long-term trend, the 200-day moving average in this case (lower clip):

Trees don’t grow into the sky, OR, trees grow into the sky slowly?
In India, some sort of consolidation has set in:

And talking India, the country’s “Henry Ford”, Ratan Tata passed away earlier last week.
")
Turning to China, we mentioned a few weeks ago that participation in a possible equity market bounce (two days before the stimulus bazooka!) was only for the not faint at heart:


Confirmed! This has truly little to do with investing…
Ok, time to update our tables on the best performing stocks year-to-date and how they have fared over the past five sessions. To start, here’s the US table:

And here the European one:

I truly thing there is a lot, lot value to these tables. What do you think? Should we create a fund (AMC) around this?
Ok, enough of “risky” stocks, over to bond markets!

The Bond Vigilantes, prematurely declared dead nearly as many times, as Morgan Freeman,

are sending a message:

Since the 50 basis point rate cut, the US 10-year treasury yield trades nearly a half a percent higher. Strong economic data over the past month, topped by a stubbornly high CPI last week, have put price pressure on bonds. The Citi US Economic Surprise Index speaks for itself:

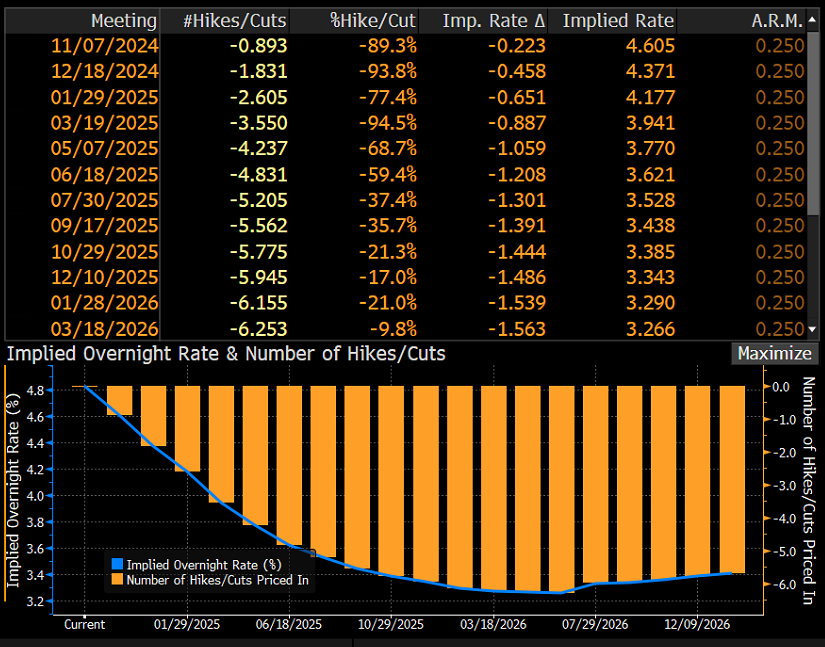
Accordingly, expectations for rate cuts in two meetings until the end of the year have dropped below two, but even that seems still a bit steep to me given latest economic data:
European yields, proxied by the German 10-year Bund, have backed up about half the distance of that of its US cousin:

Probably also worth highlighted the 10-Year UK Gilt chart, where the close to 50 basis points increase in yield, suddenly makes this chart like a bullish (bond price bearish) breakout chart:


On the currency side of (investment) matters, the US Dollar had another strong week against all other majors:

The rally of the greenback started right at the beginning of the month, and is probably most impressive versus the Japanese Yen:

The chart of the EUR/USD cross is clearly unclear:

Bitcoin has moved above its 200-day moving average gain,

but continues to be within a consolidation pattern:

Is the leveraged Bitcoin play, MicroStrategy Inc. (MSTR) showing the way out of the above-mentioned consolidation pattern?


Finally, in the commodity space, Gold dipped and recovered in the blink of an eye:


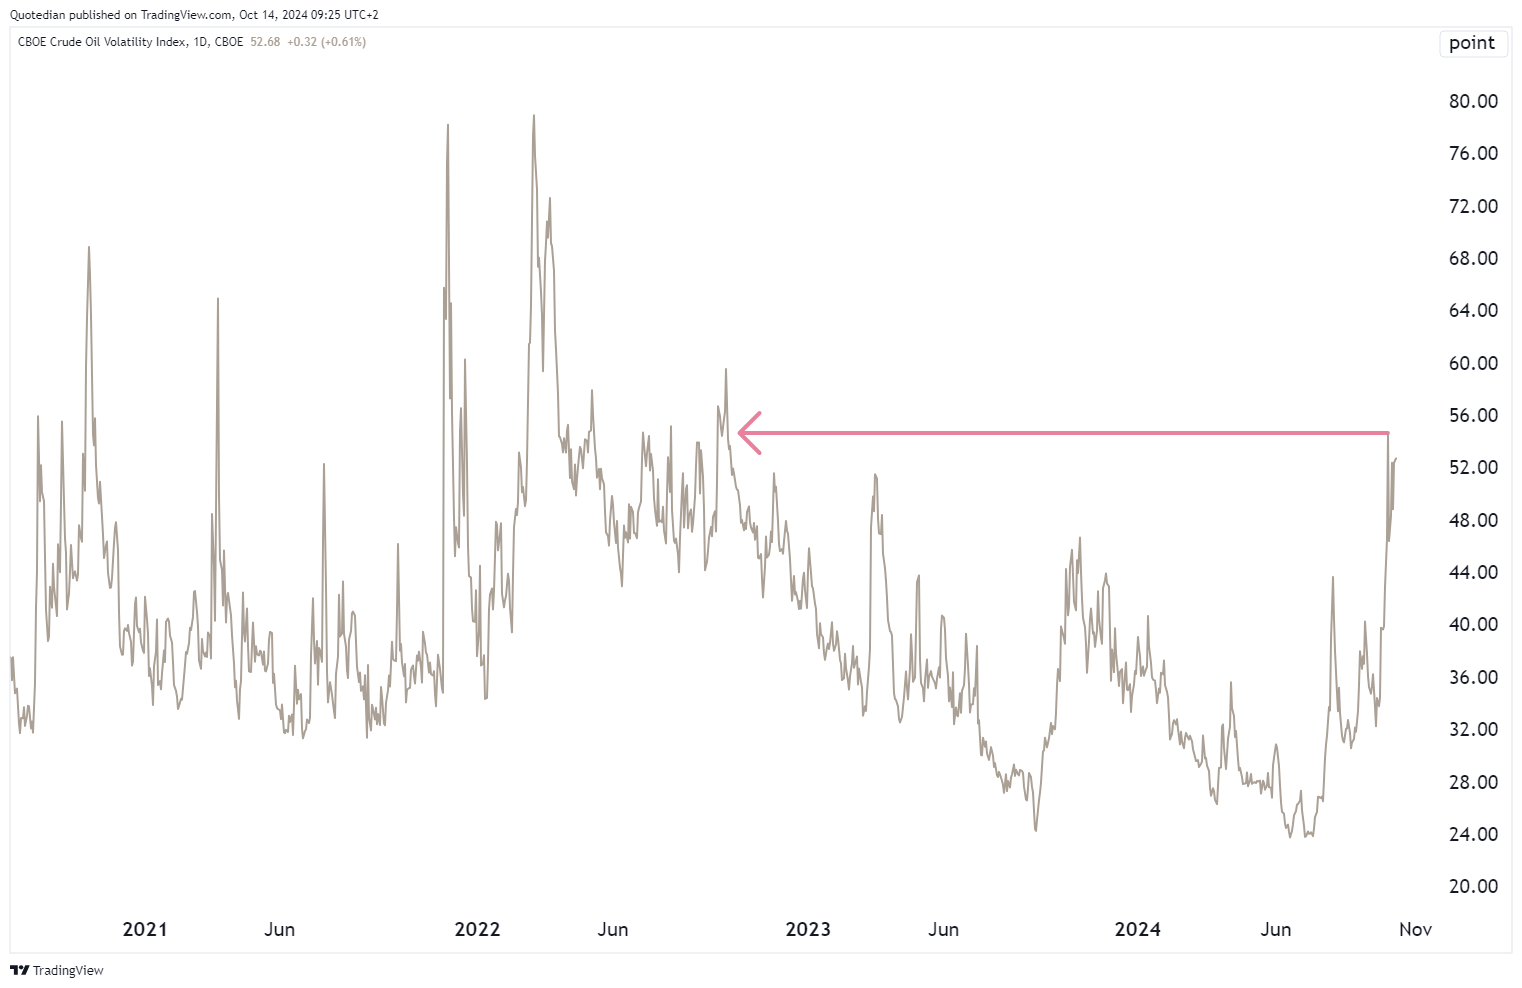
Crude oil is having a stunningly volatile month, torn between OPEC supply issue, the conflict in the middle east and Chinese stimulus:

As a matter of fact, the price of oil is at its highest volatility level in two years:
Lastly, the breakout attempt of Natural Gas seems to have failed yet once again:


For the first time in a while (22 years), bond yields are higher than the earnings yield of the S&P 500, a few brief moments over the past two years excepted:

Big gaps between the two measures are unusual. When in stocks’ favor, they signalled historic buying opportunities (as in early 2009 when the worst phase of the GFC was coming to an end, and again during the 2020 pandemic lockdowns). The last big gap in Treasuries’ favor, in early 2000, signalled correctly that it was time to get the heck out of stocks.
Should bond yields rise from here, maybe due to further unsustainable government spending, then the bull case for stocks may become more difficult to make.
Stay tuned …

Everything in this document is for educational purposes only (FEPO)
Nothing in this document should be considered investment advice
Investing real money can be costly; don’t do stupid shit
The views expressed in this document may differ from the views published by Neue Private Bank AG
Past performance is hopefully no indication of future performance