

Stocktoberfest
Vol VIII, Issue 31 | Powered by NPB Neue Privat Bank AG

“Milk is for babies. When you grow up you have to drink beer.”
— Arnold Schwarzenegger
Enjoying The Quotedian but not yet signed up for The QuiCQ? What are you waiting for?!!

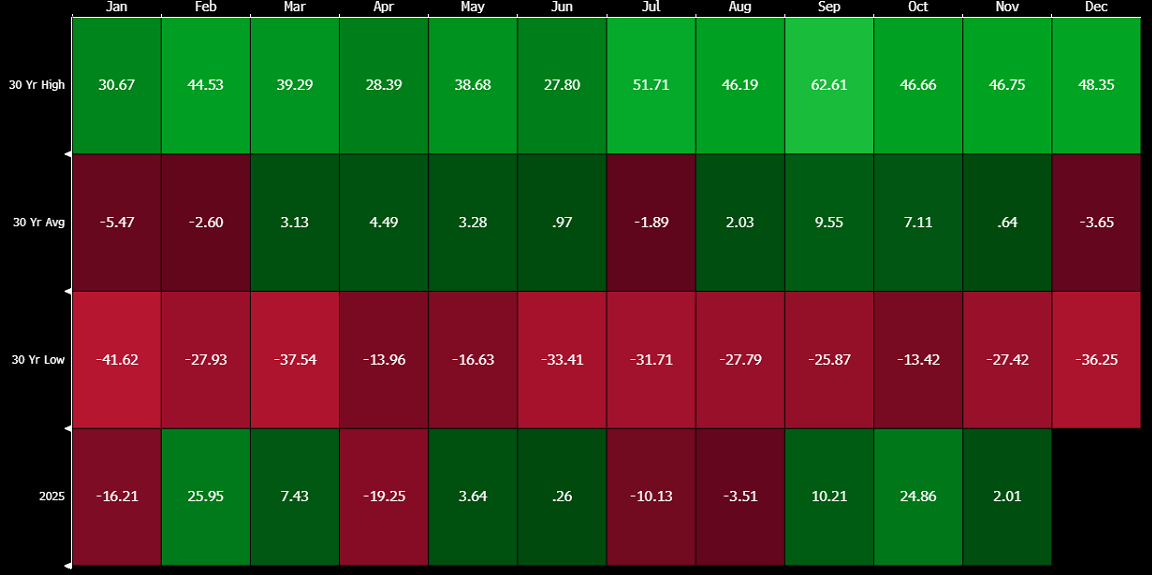
Well October, one of the notoriously more volatile months of the year,
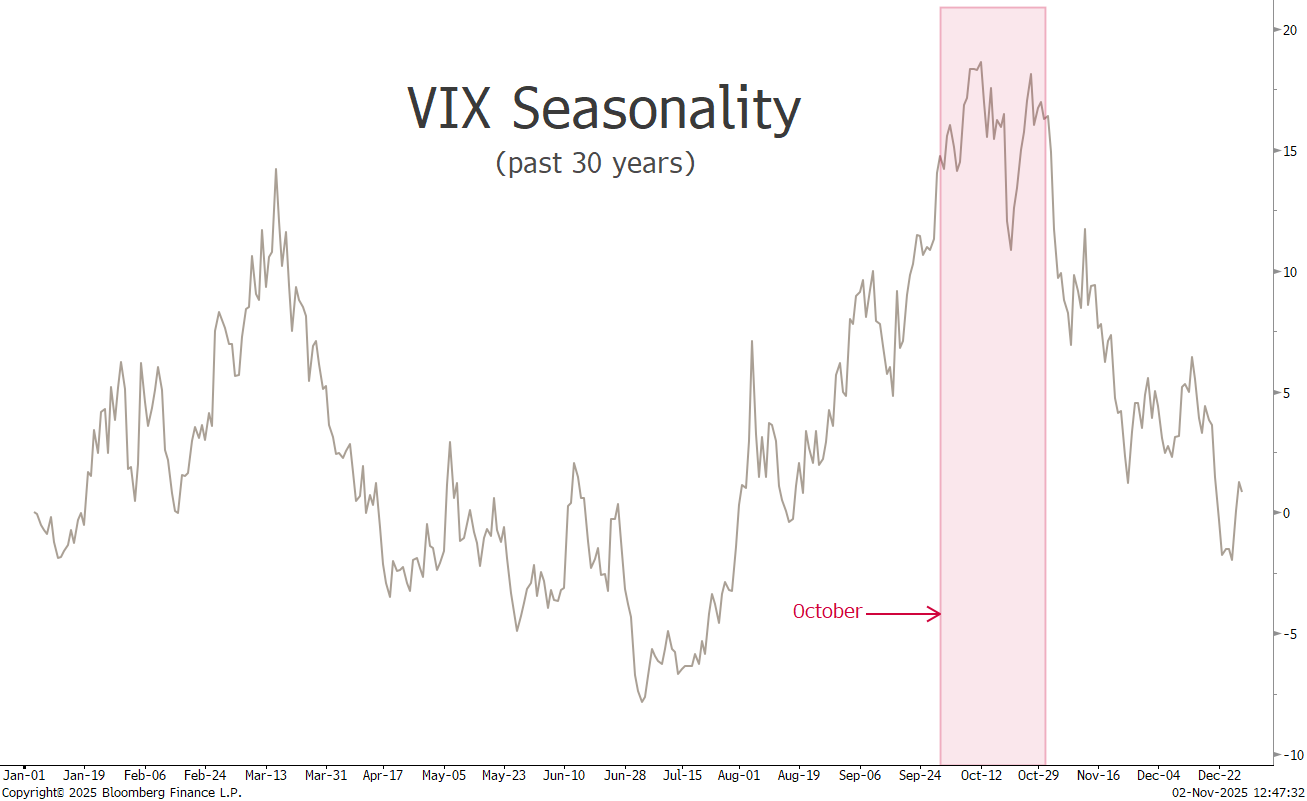
has come and gone with the usual volatility spike,
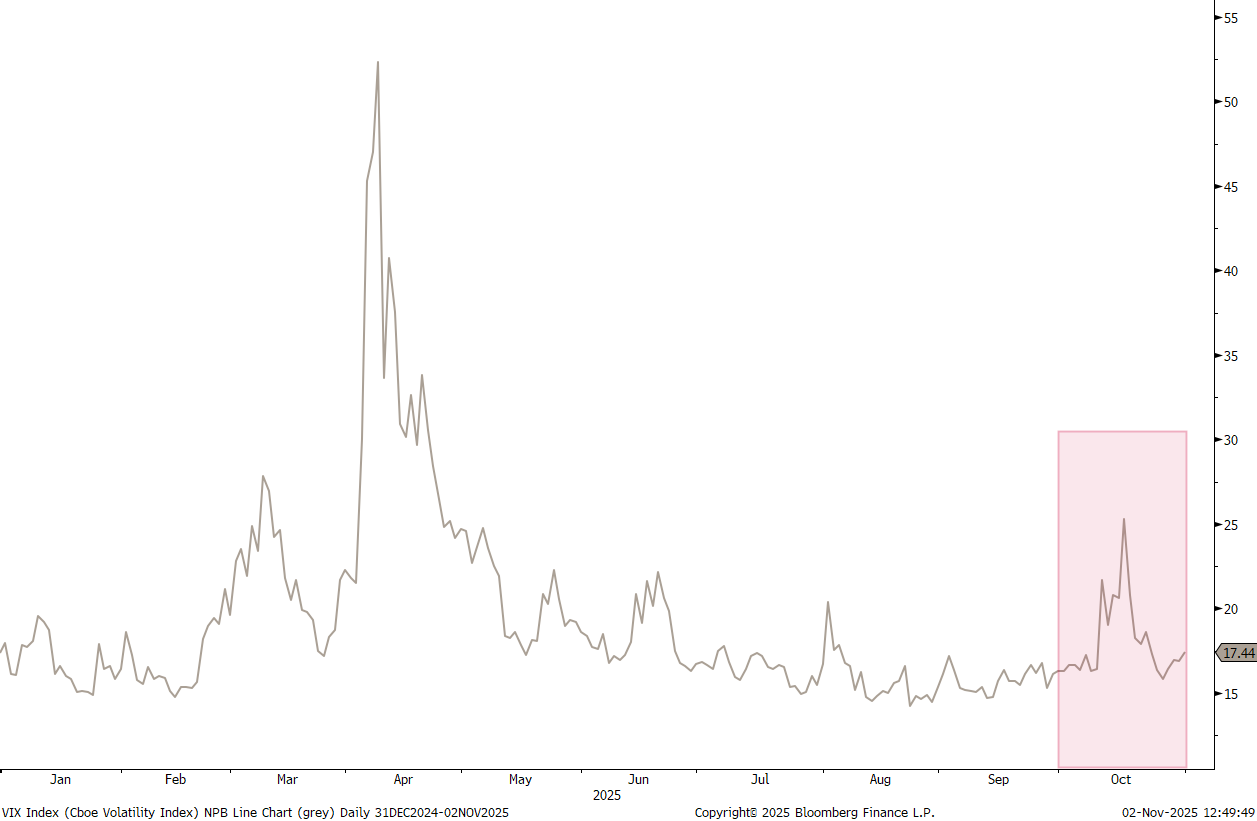
but no real negative impact for any of the major asset classes.
Quite “au contraire”:
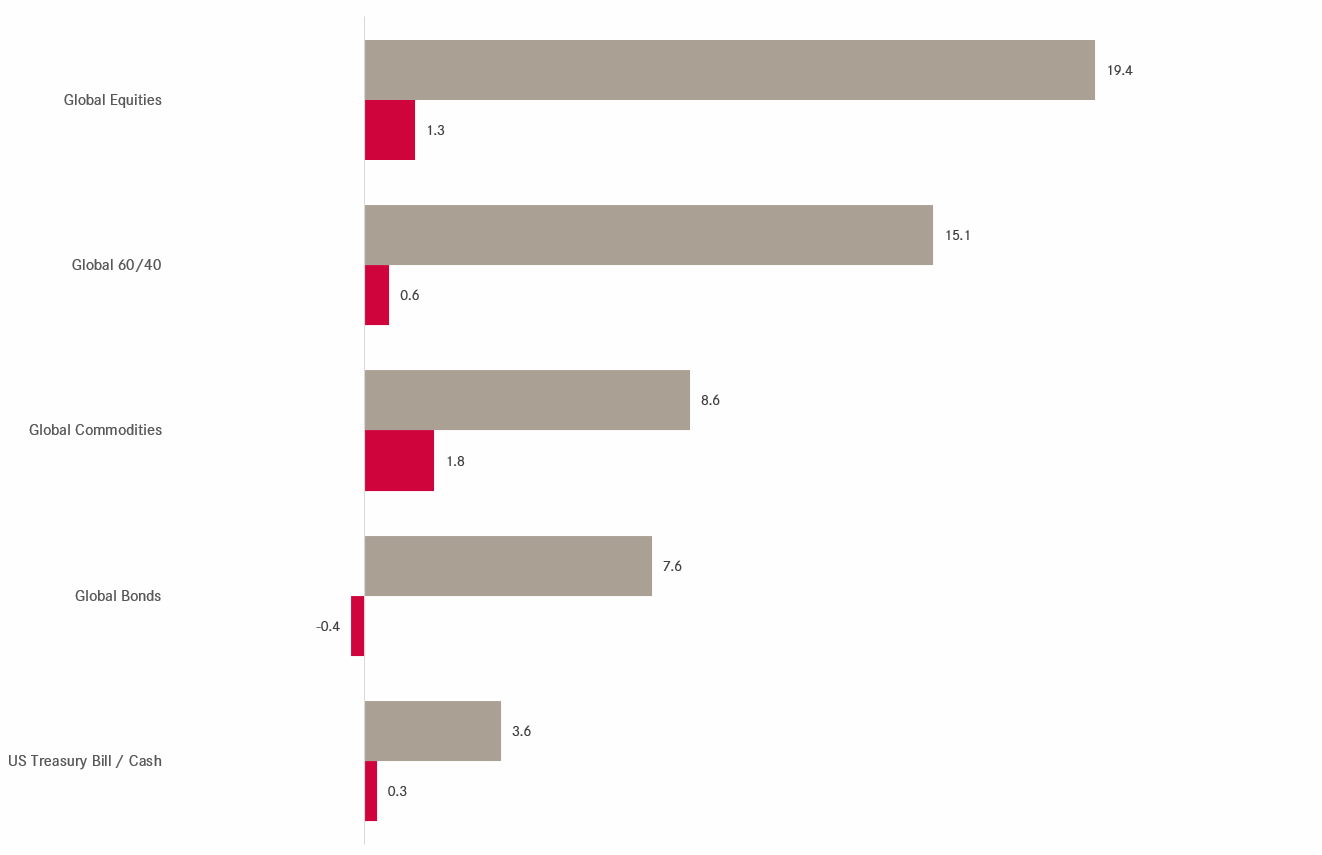
Only global bonds saw a small retreat in October, but gains in equities were strong enough to offset those and yield a positive return for the classical 60/40 portfolio.
As a matter of fact, as we have shown in this fine publication two weeks ago (Raw Earths - click here), even for the worst investors it has been difficult to lose money this year:
Hence, with Halloween out of the way now, and as we are slowly sliding into one of the more festive periods of the year, let’s have a look at how much of a Stockoberfest it was. And we’ll also take our usual look at the longer-term, monthly charts to try and see what could lie ahead.

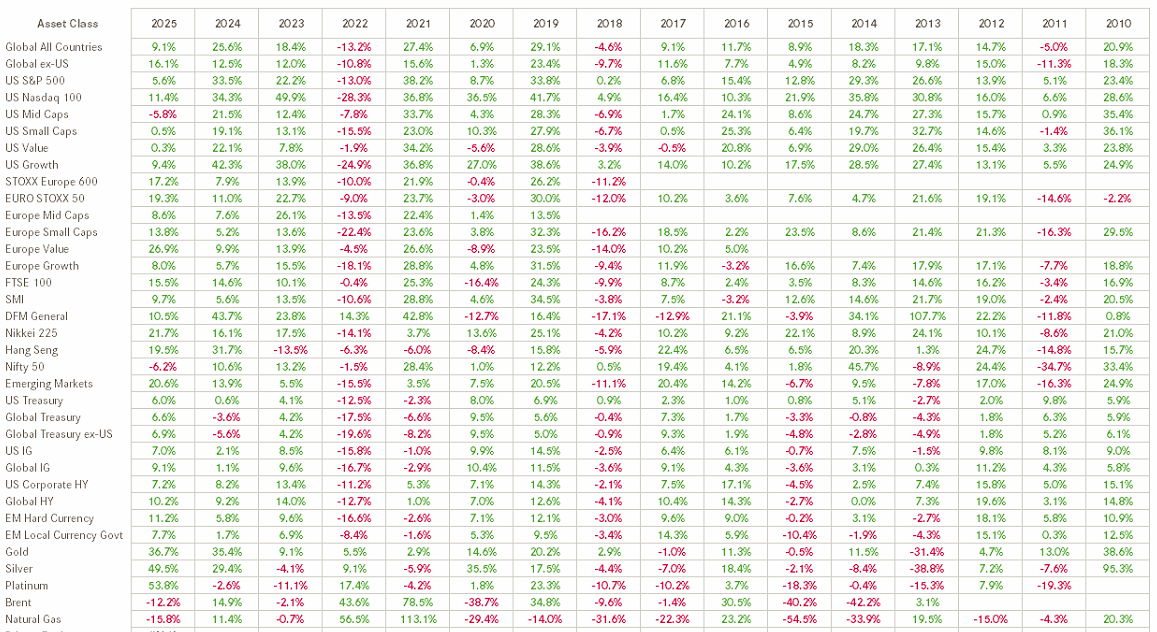
First, here a look at some of the major benchmark indices around the globe, always in local currency. Remember that the grey bars represent percentage year-to-date returns, whilst the red bars indicate the October percent performance:
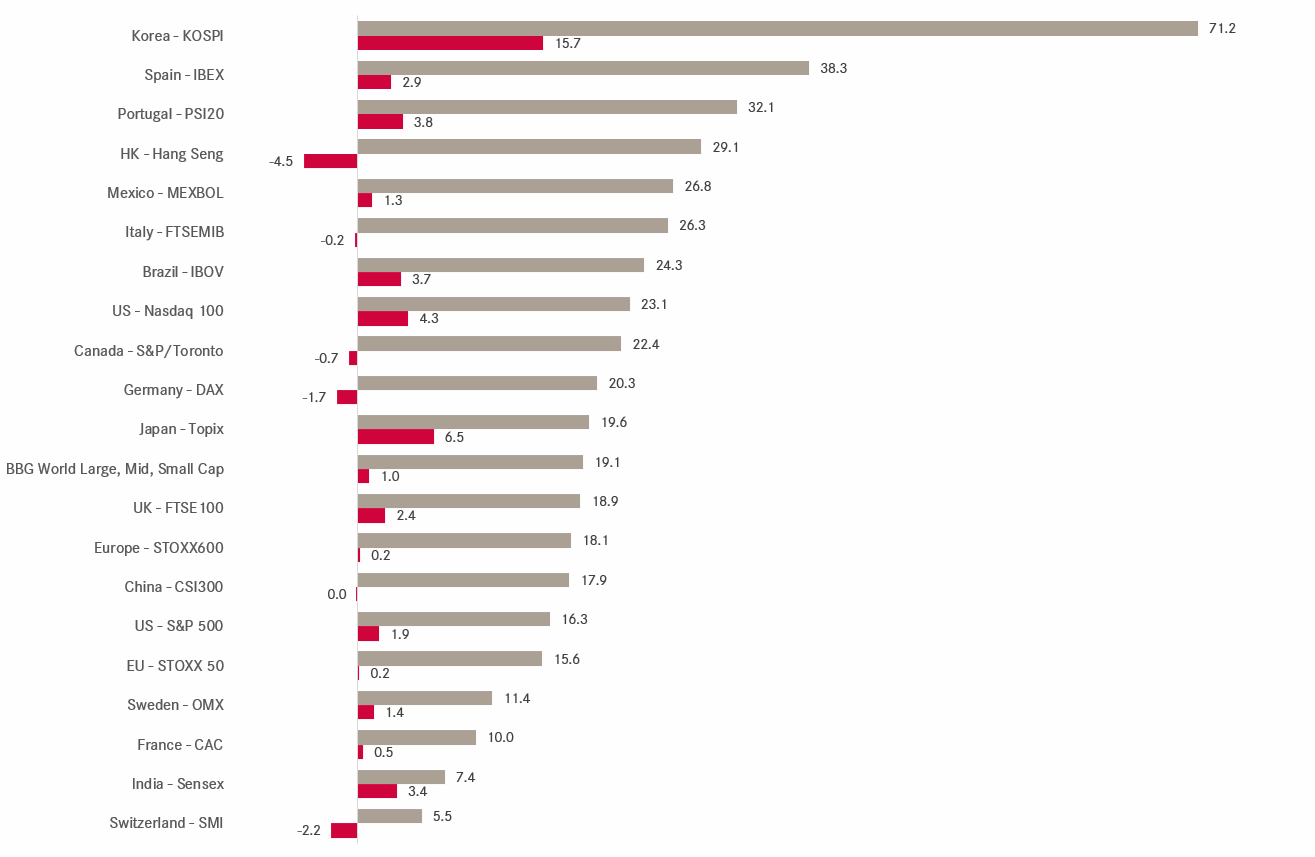
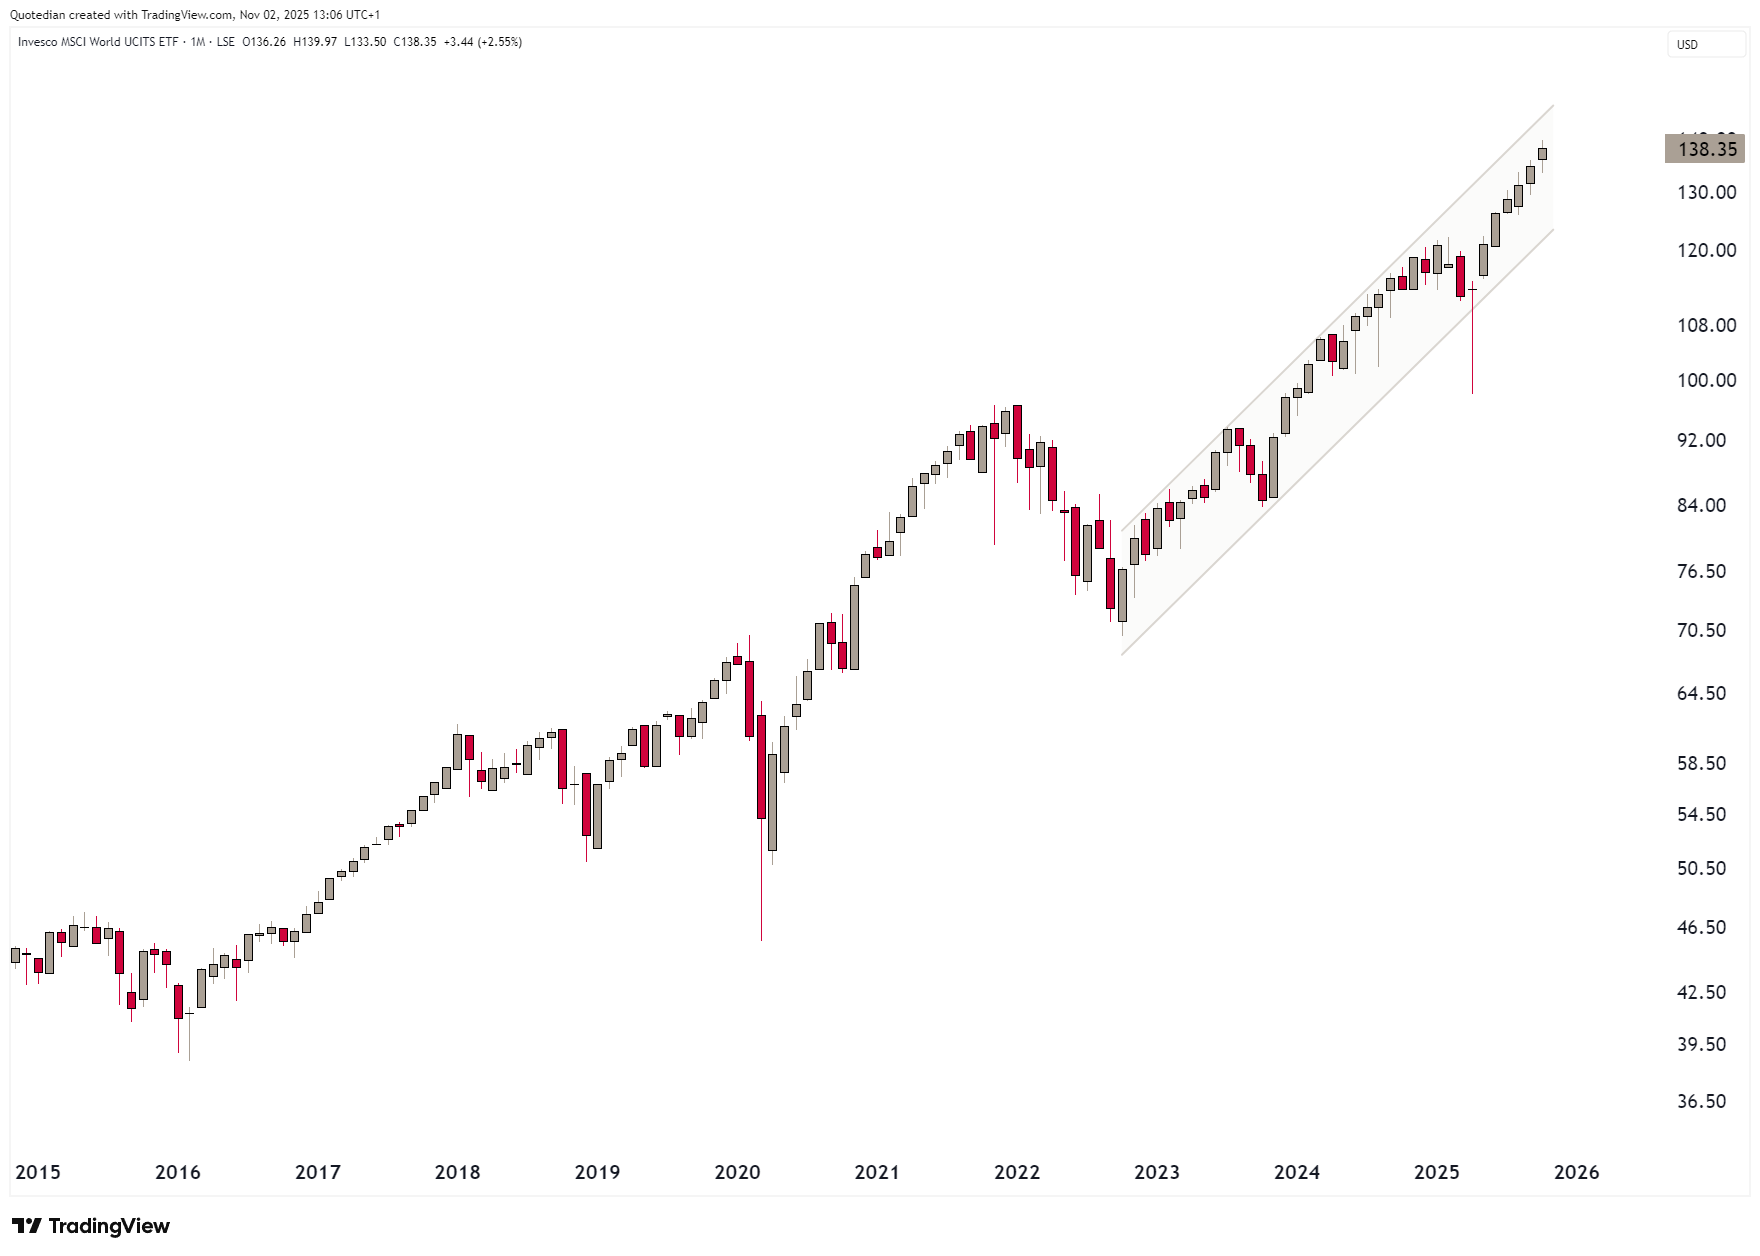
Global stocks (BBG World Large, Mid, Small cap index - roughly middle of the table above) advanced by one percentage point. Here’s the monthly chart of an MSCI World ETF (MXWO), showing that still perfect channeled ascent since the end of the bear market in late 2022:
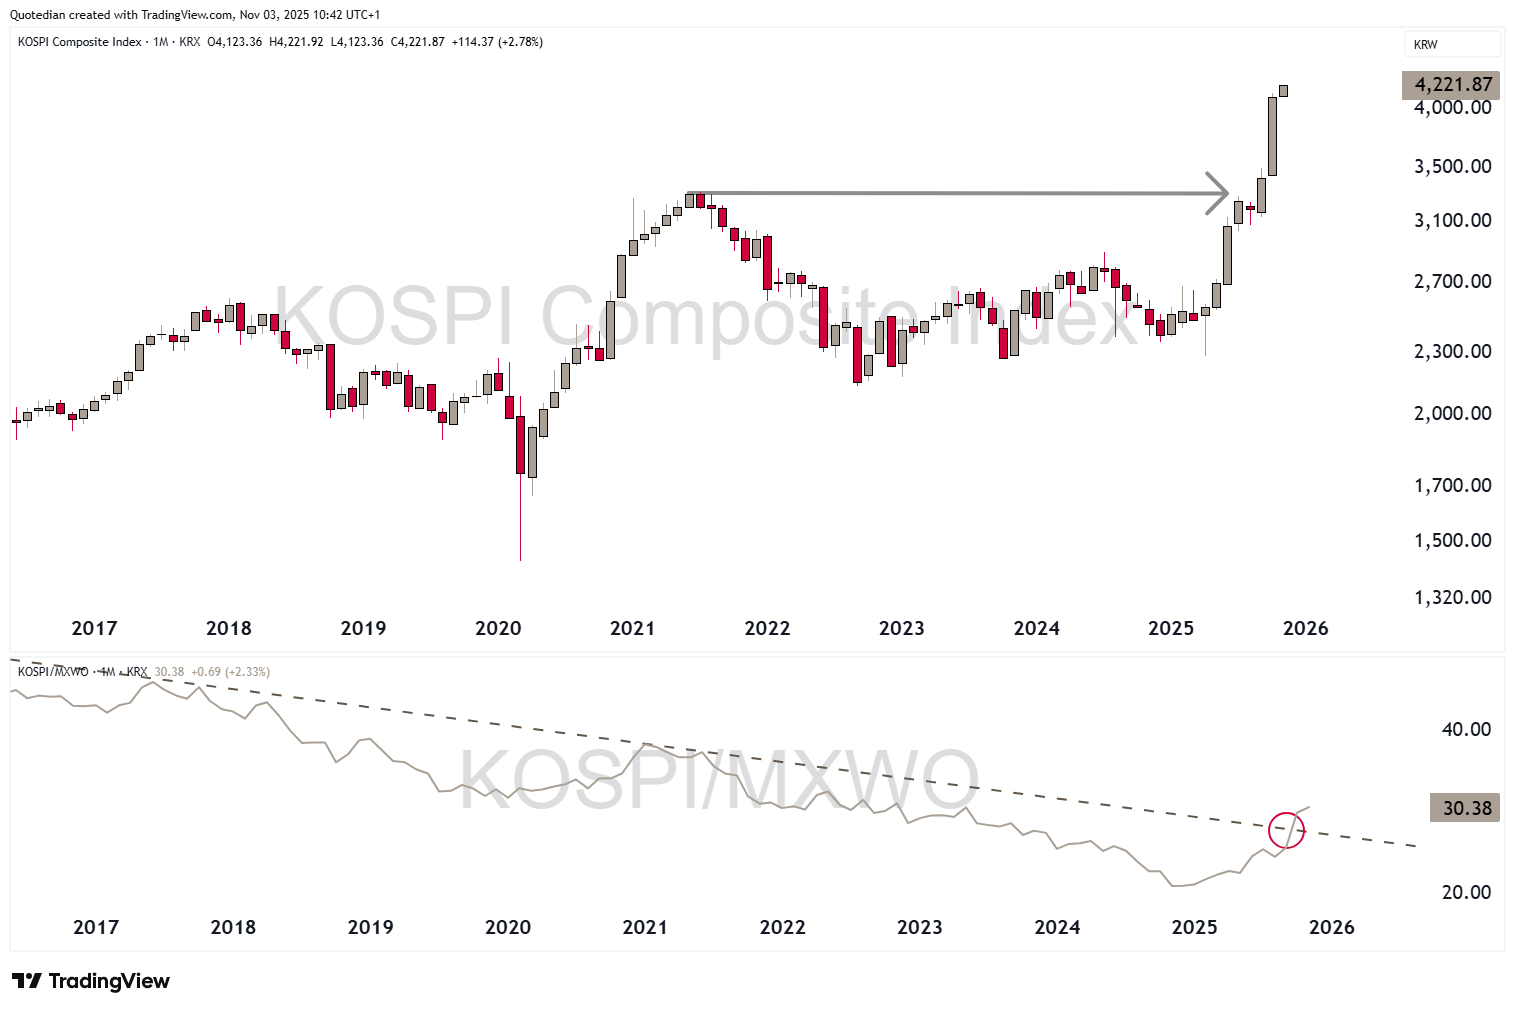
The top performing market over the past month AND year-to-date from the selected list above was South Korea’s KOSPI index, which is having a massive comeback after decade-long chronic underperformance:
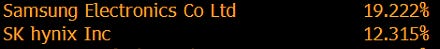
Definitely helping the index is its heavy exposure to two highflying members:
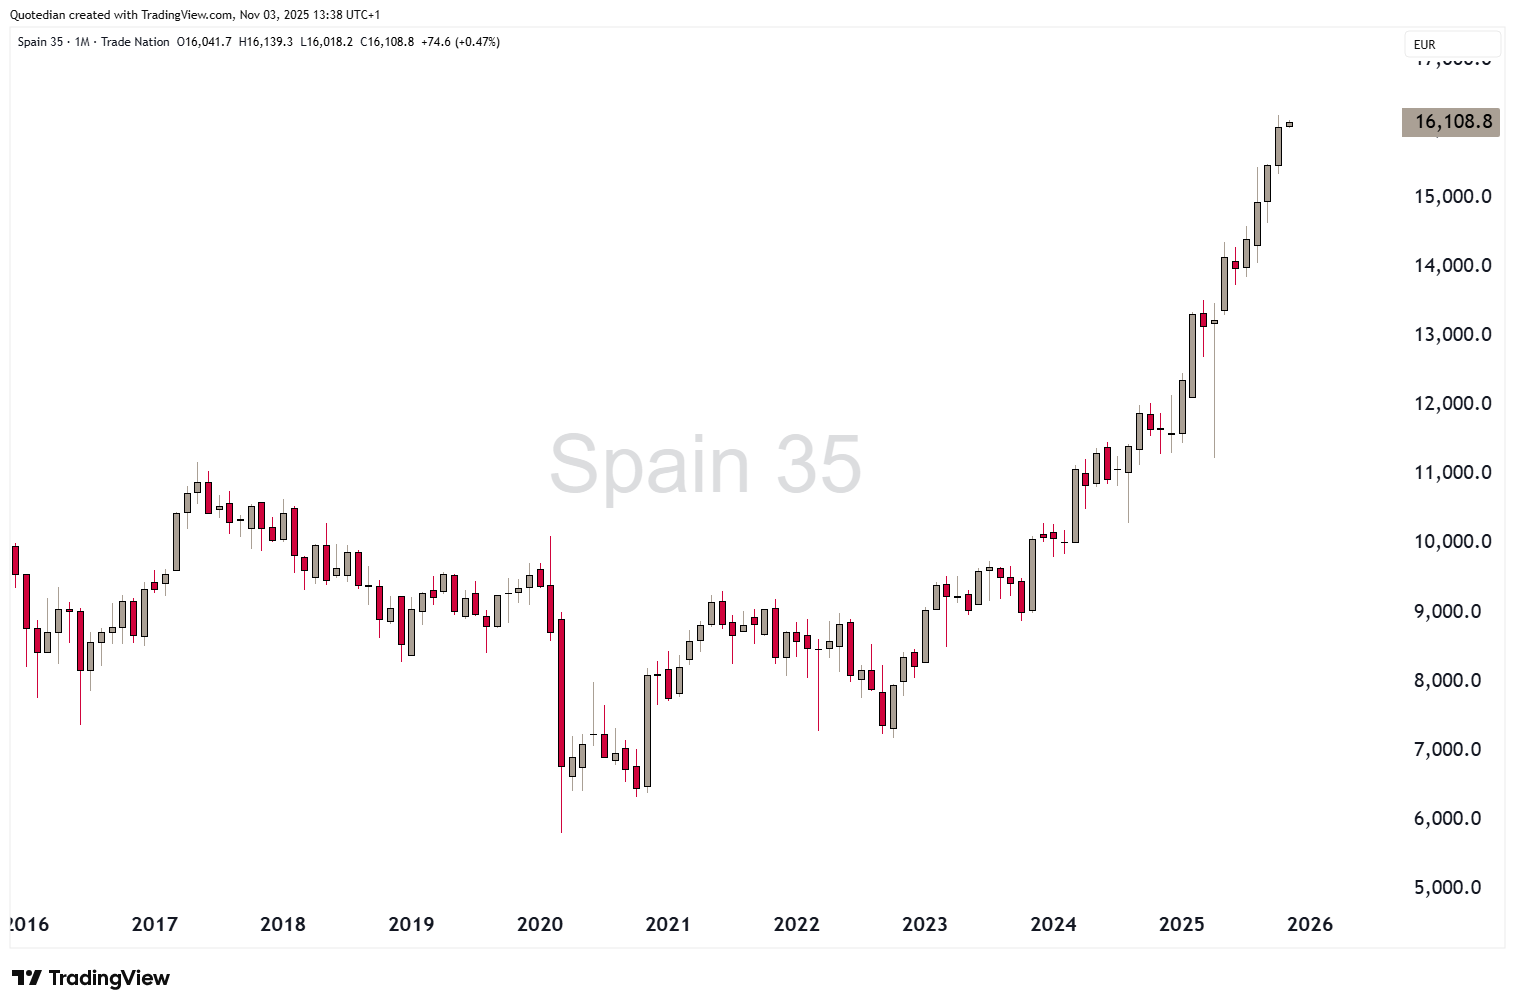
In Europe, the South continues to shoot out the lights, with stellar performance in Spain, Portugal, Italy and Greece (+38%, not shown in table above).
Spain’s IBEX-35 has now nearly tripled since its 2020 COVID panic lows:
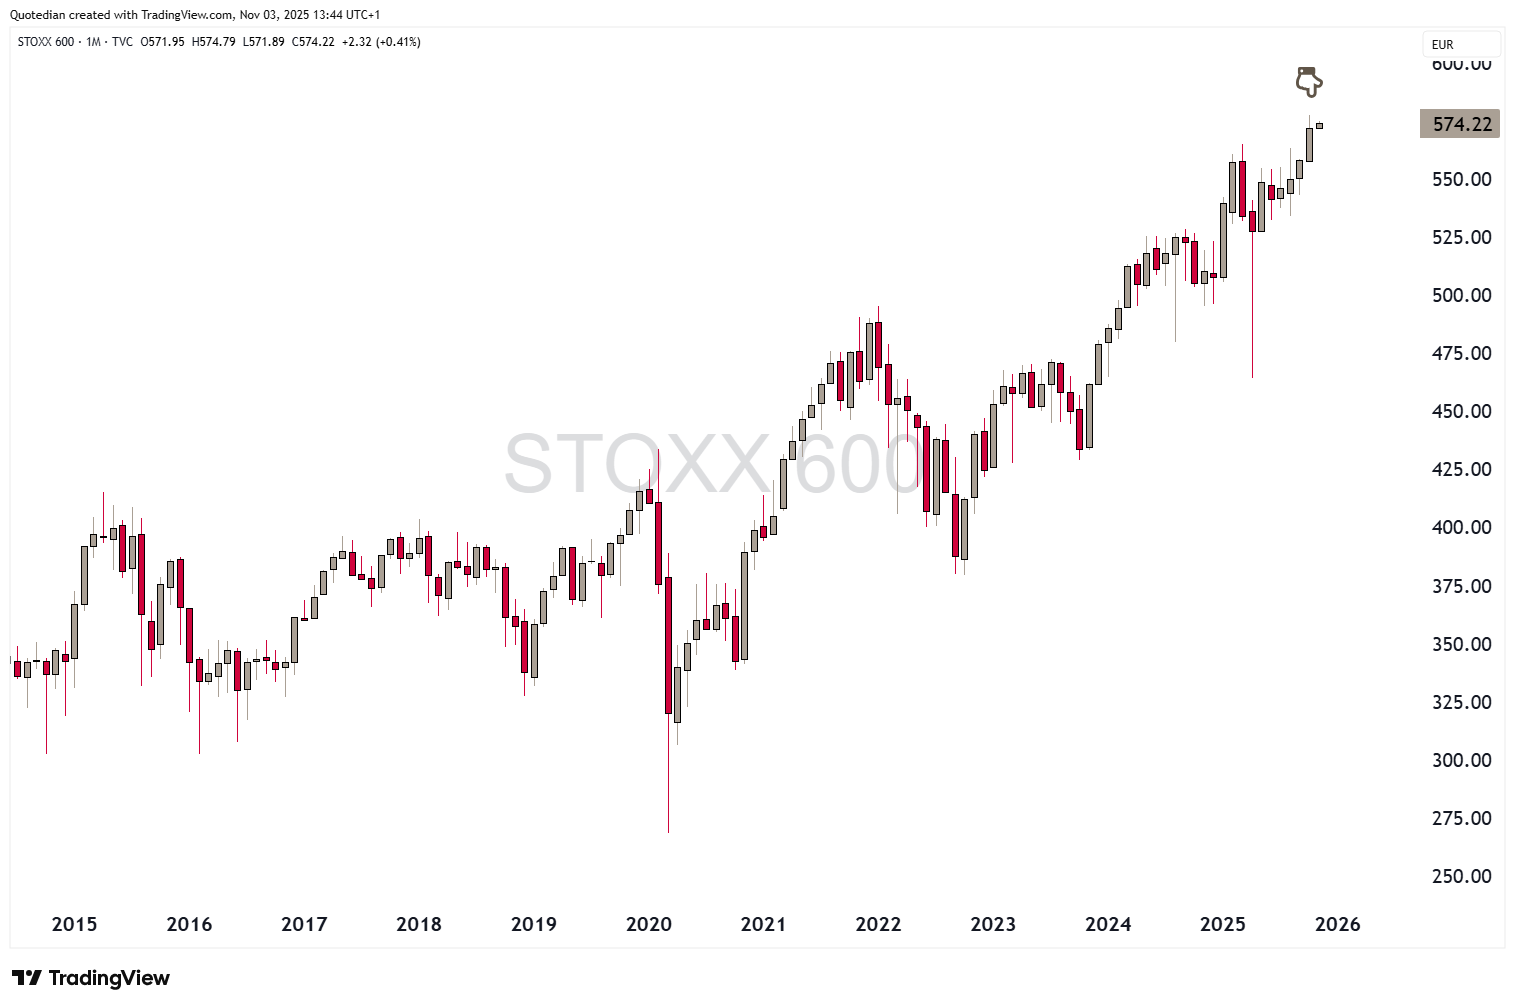
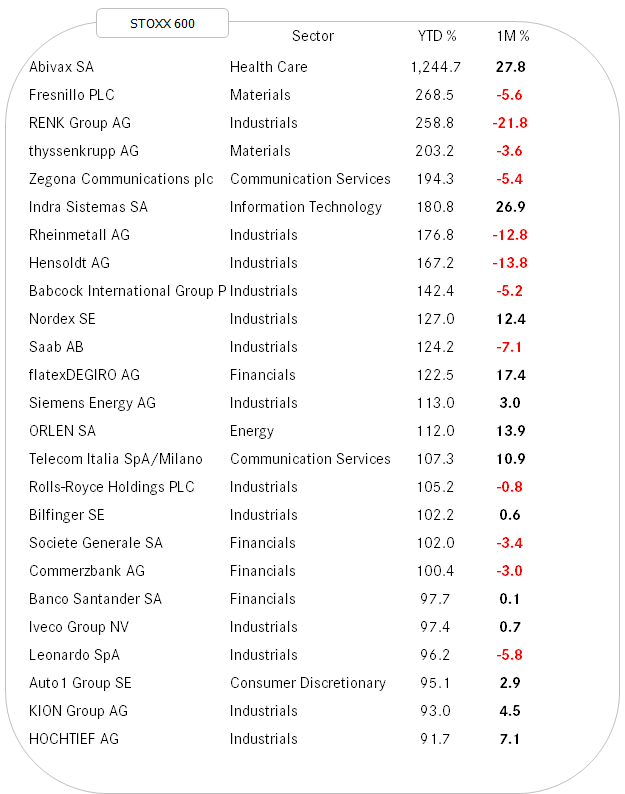
The broad STOXX 600 Europe index has made a new ATH in October:
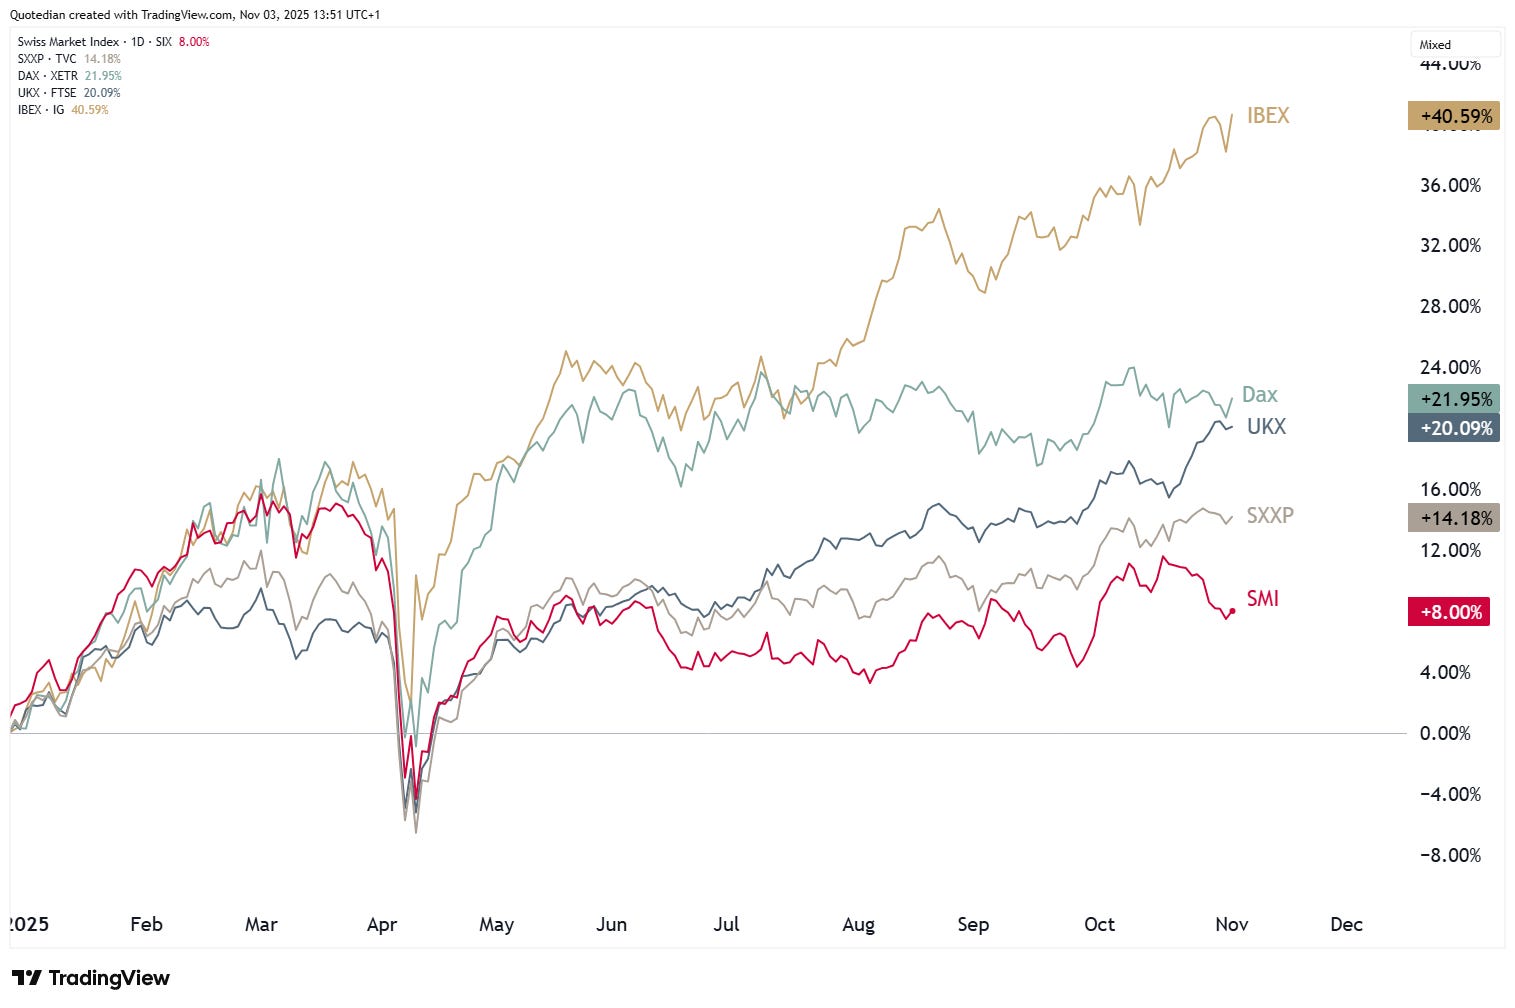
Switzerland’s SMI continues to be a continental laggard:
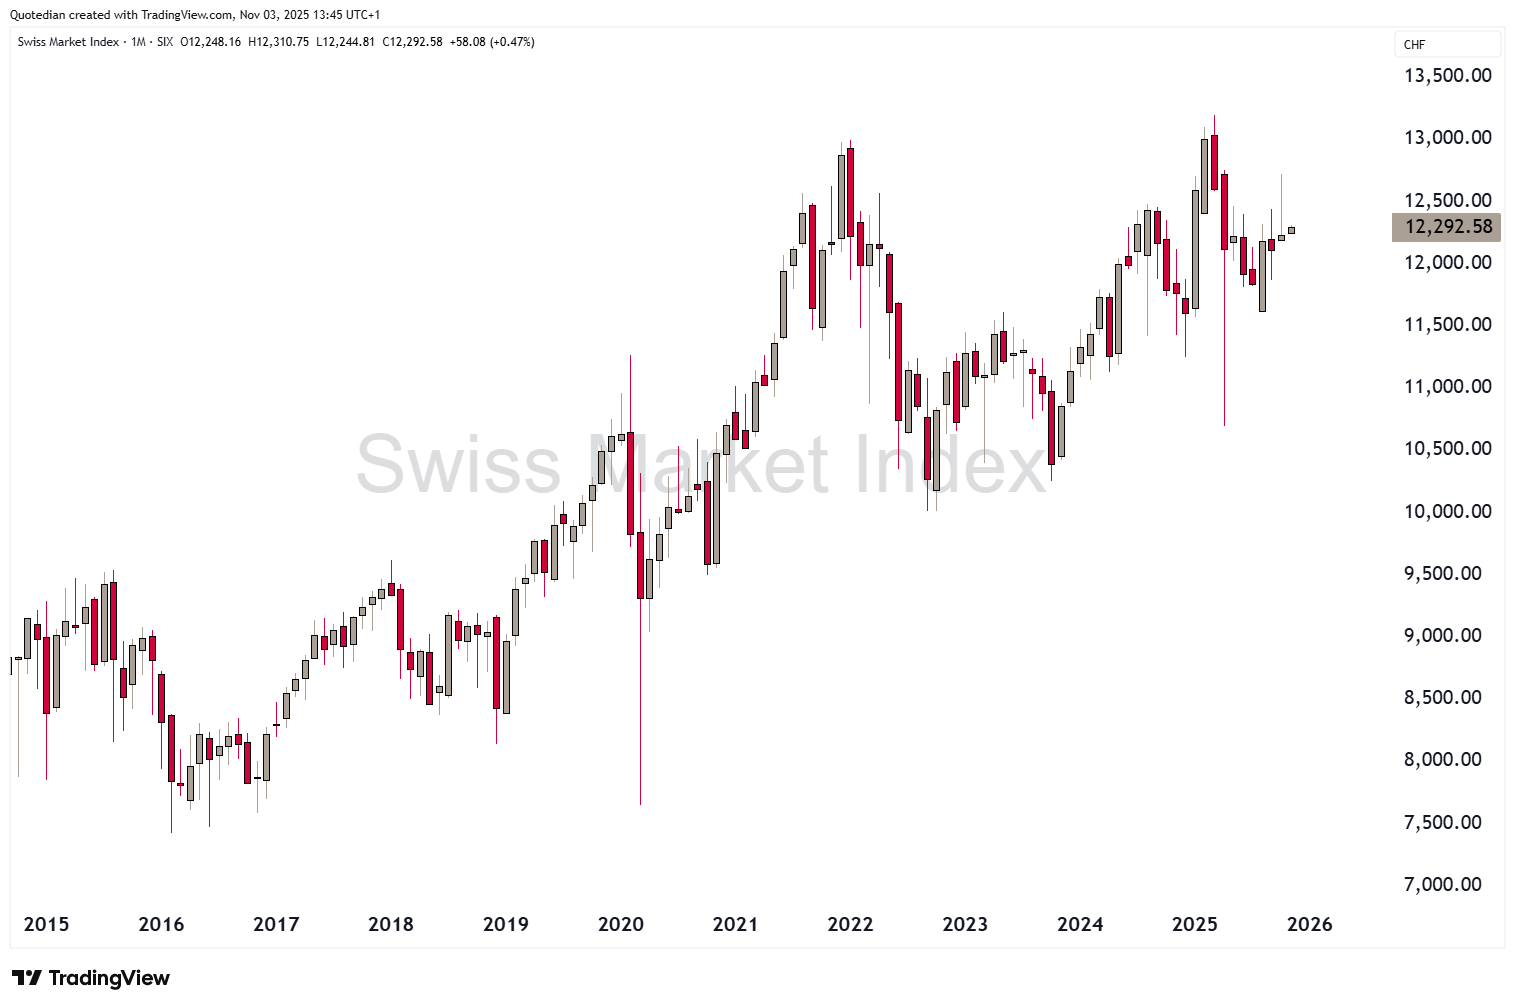
As a matter of fact, it is difficult to find a worse performer in Europe, currency-adjusted or not:
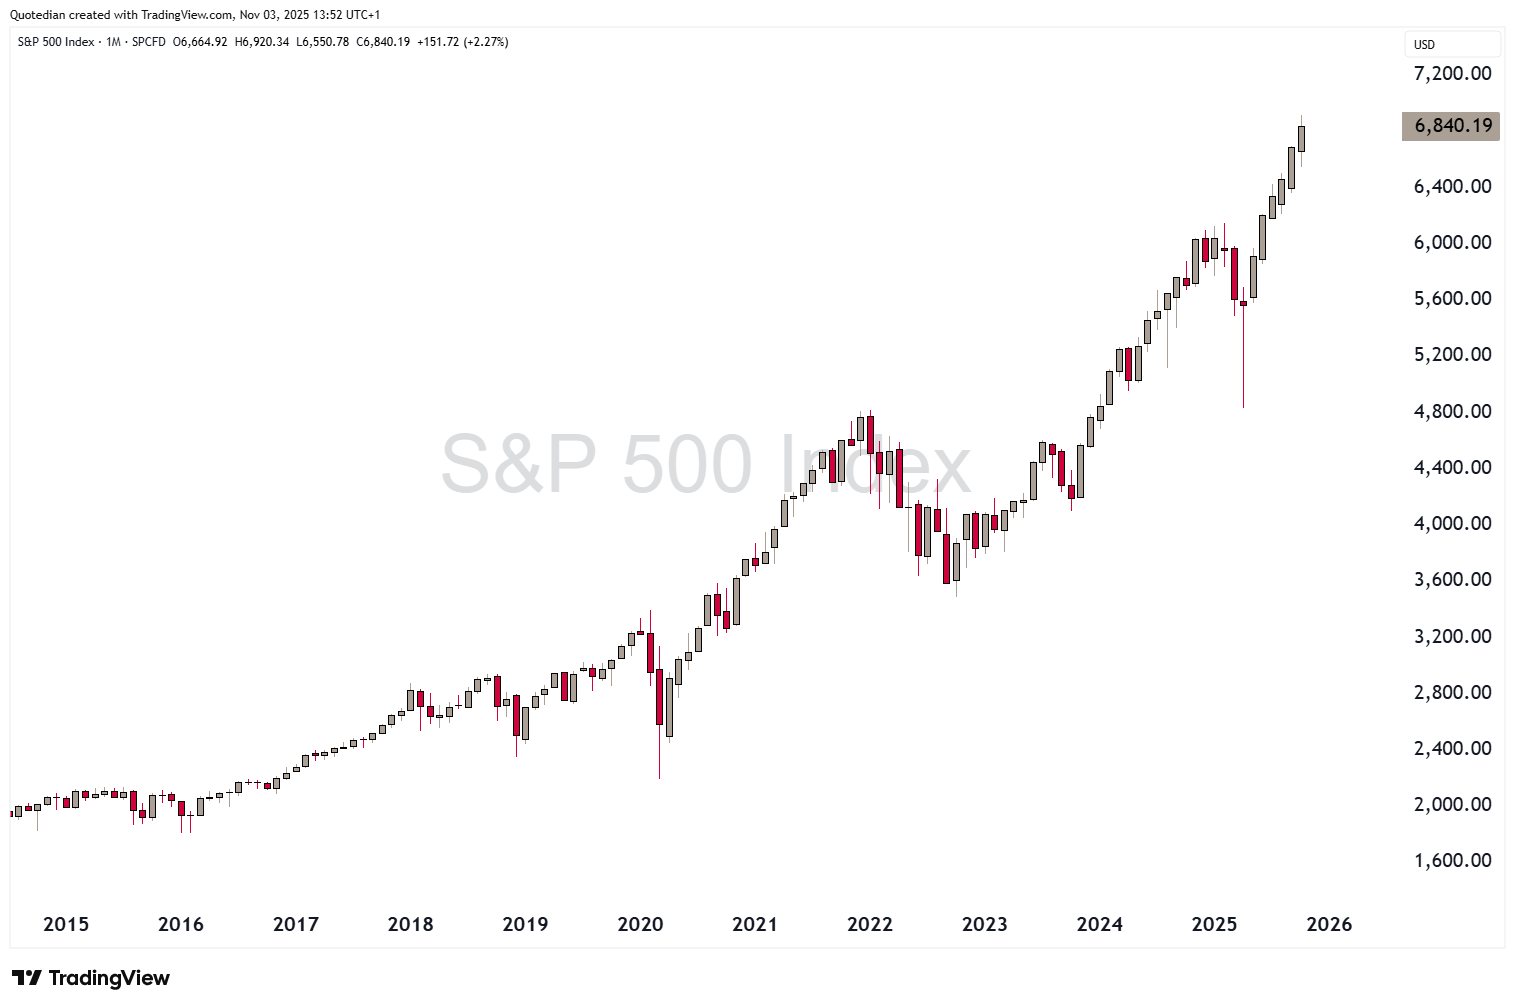
In the US, the S&P 500 has just put in its sixth consecutive month of gains:
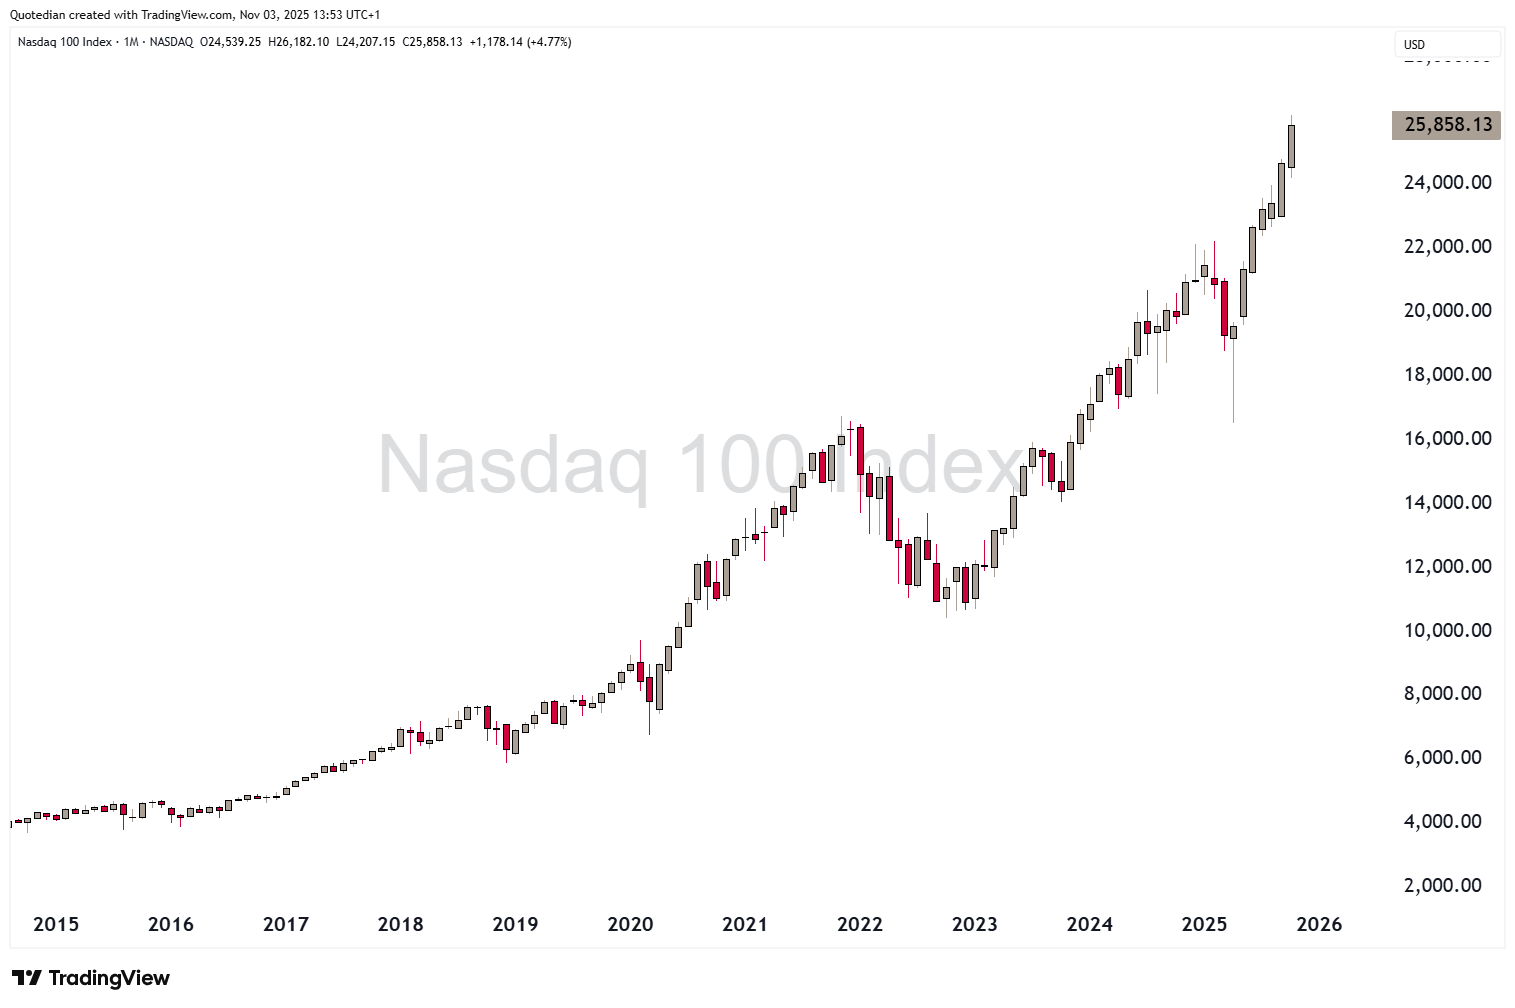
And make that seven for the Nasdaq 100:
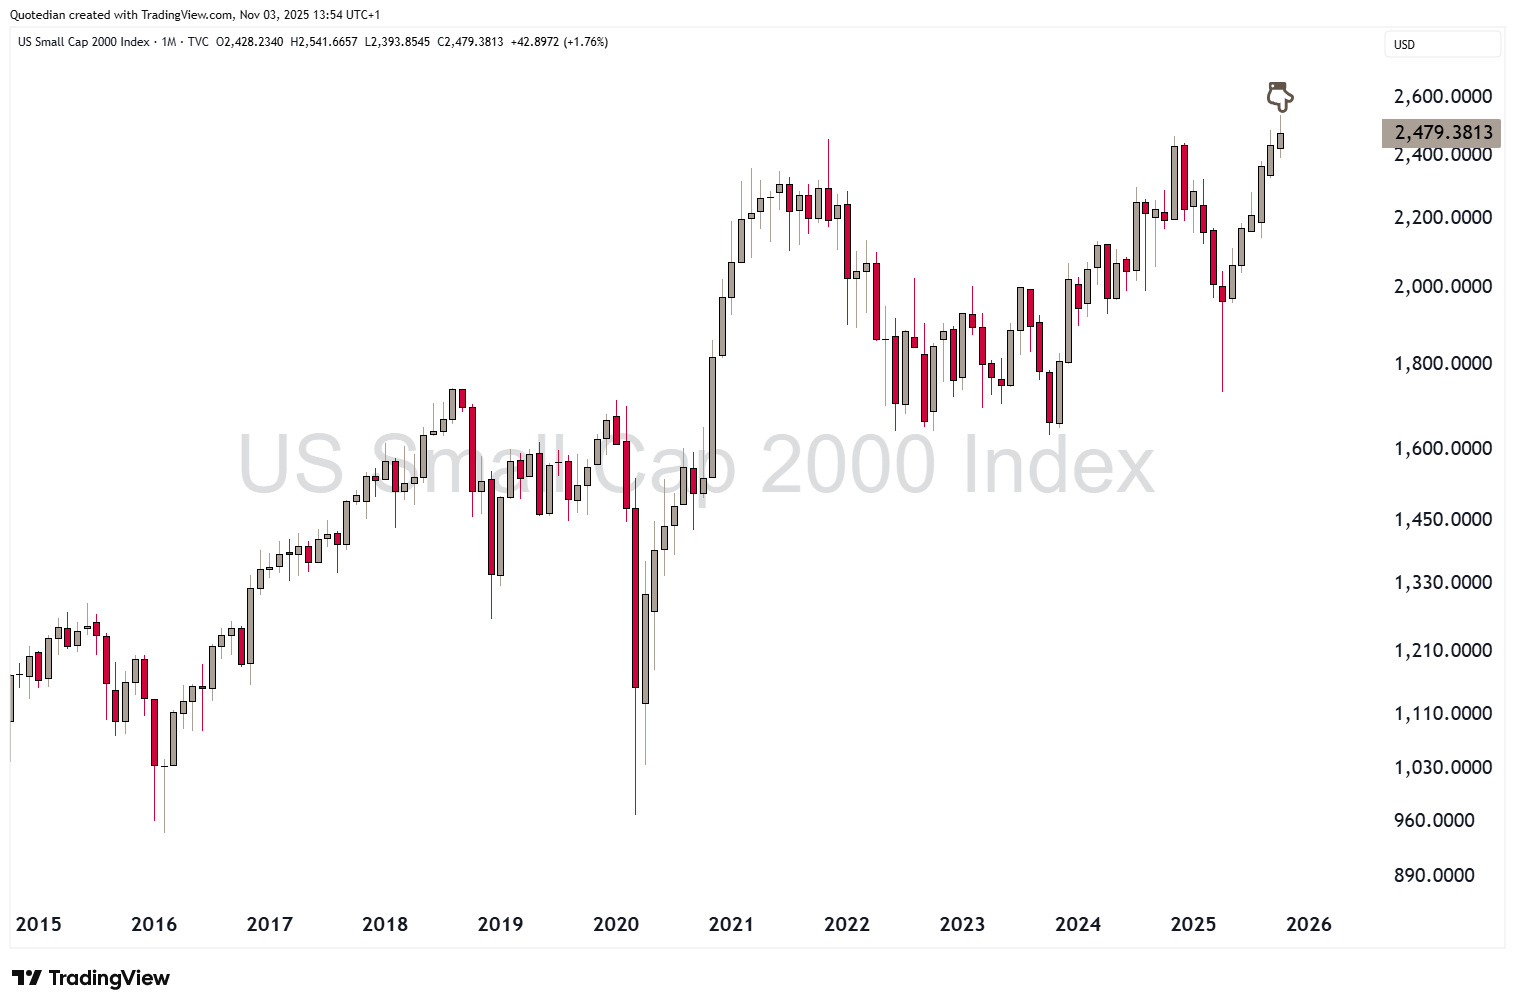
New kid on the block in terms of all-time highs were finally small cap stocks in October:
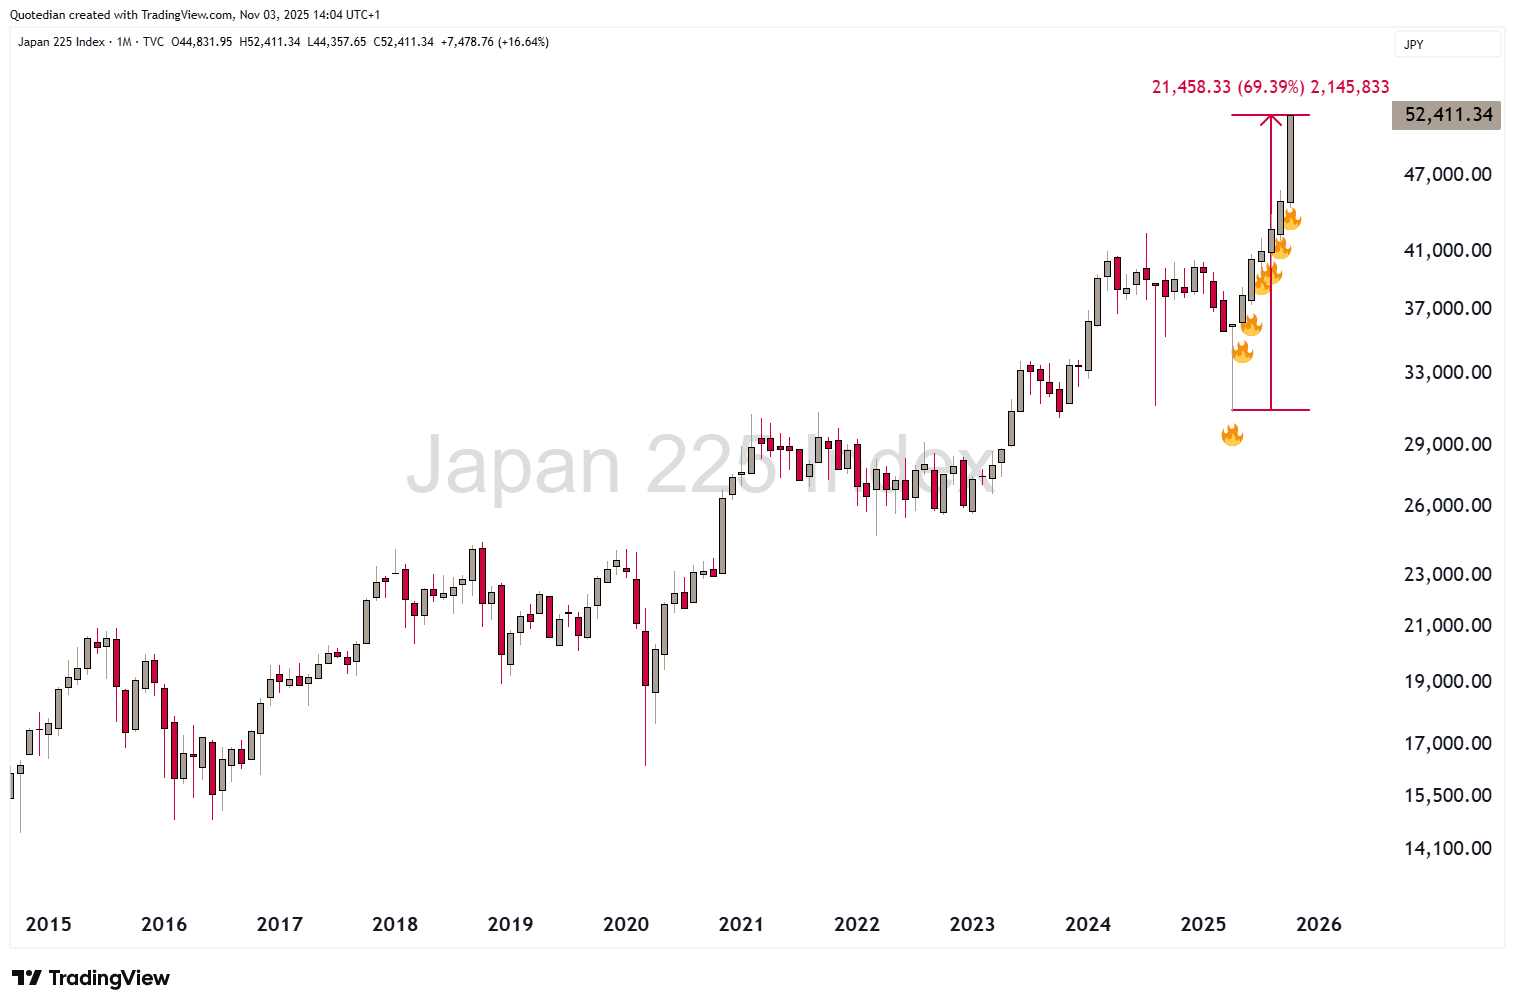
In Asia, Japanese stocks are on fire:
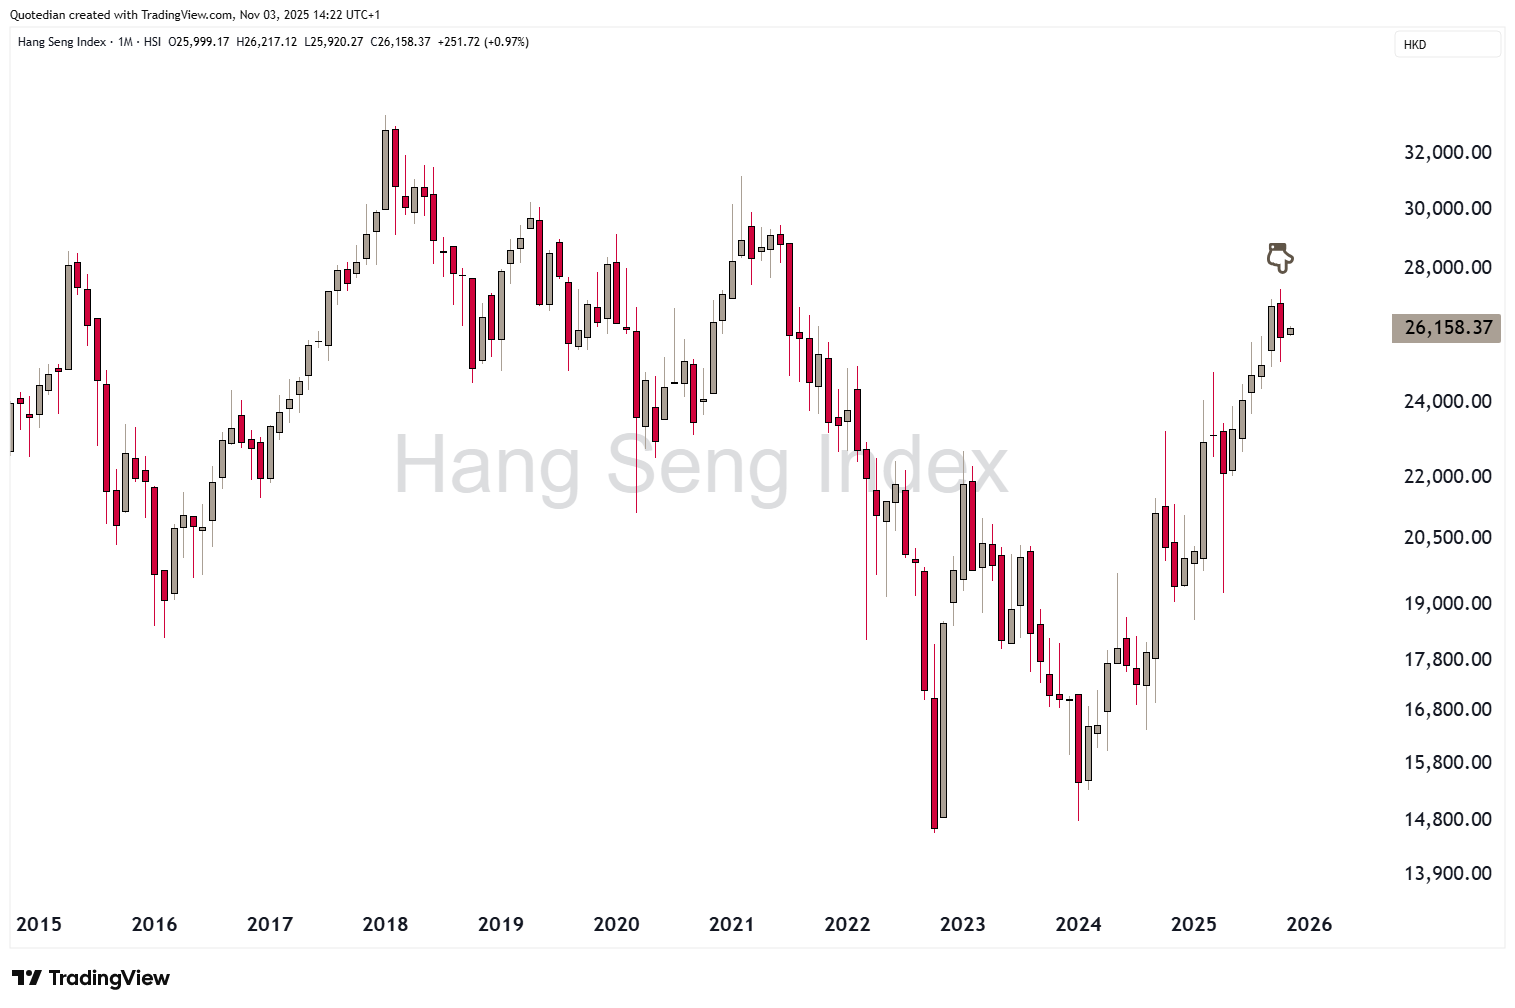
China stocks (Hong Kong & Mainland) took a bit a breather in October - here’s the Hang Seng index:
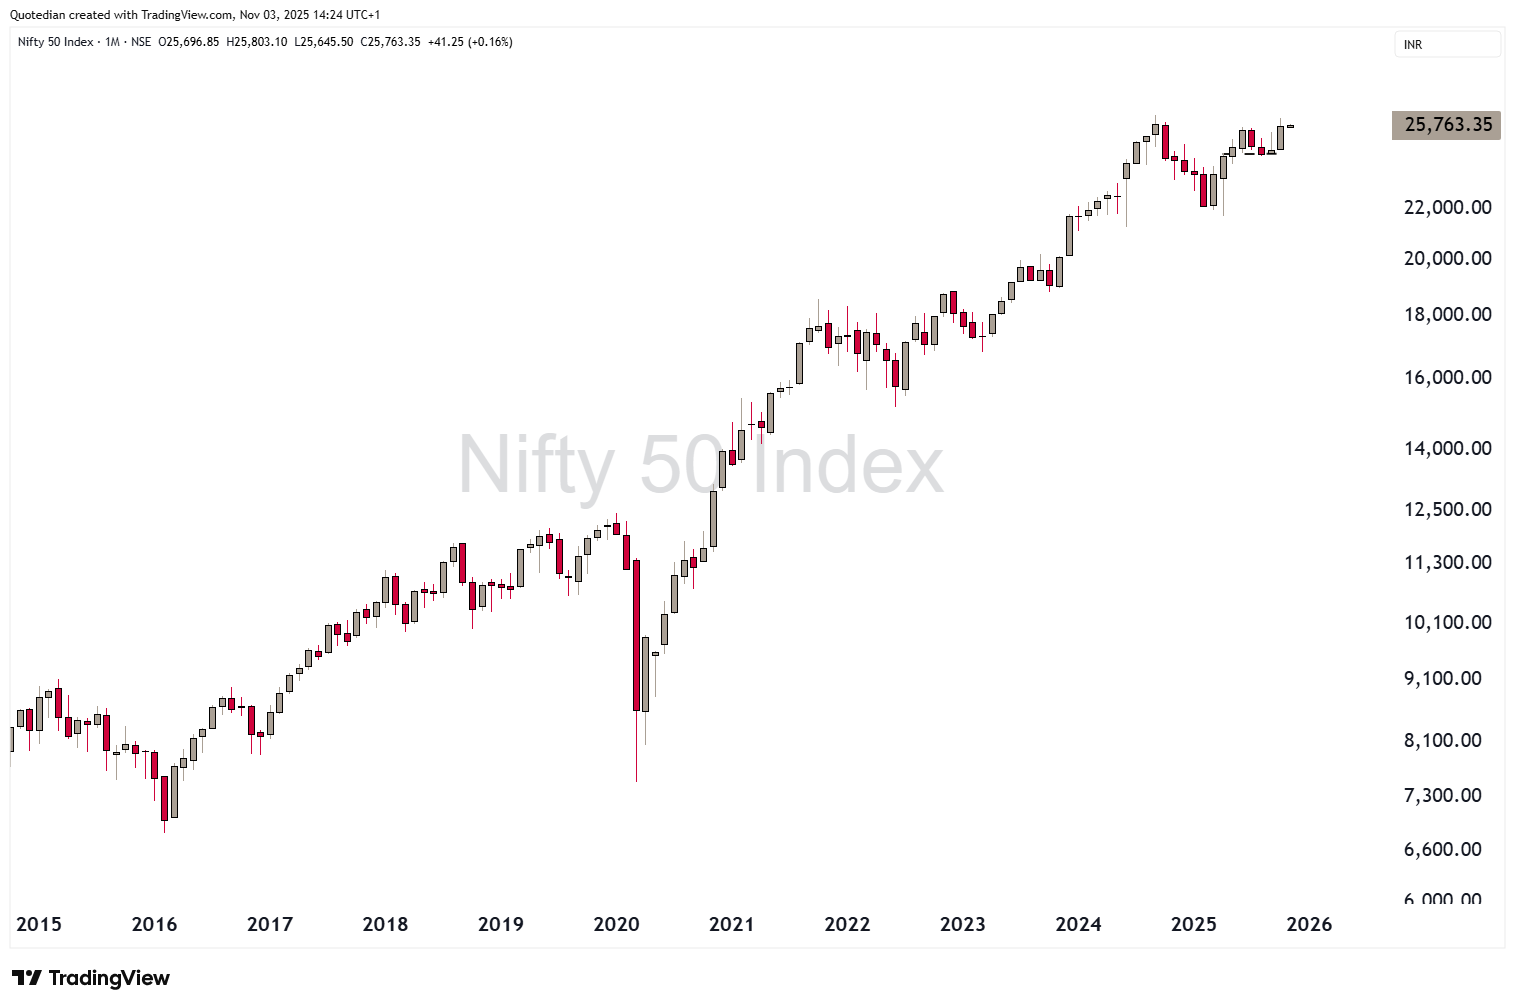
The Indian market however, fought its way back into close vicinity of the all-time highs set a year ago:
Time to review sector performance now, which at a global level shows that technology continues to rule:
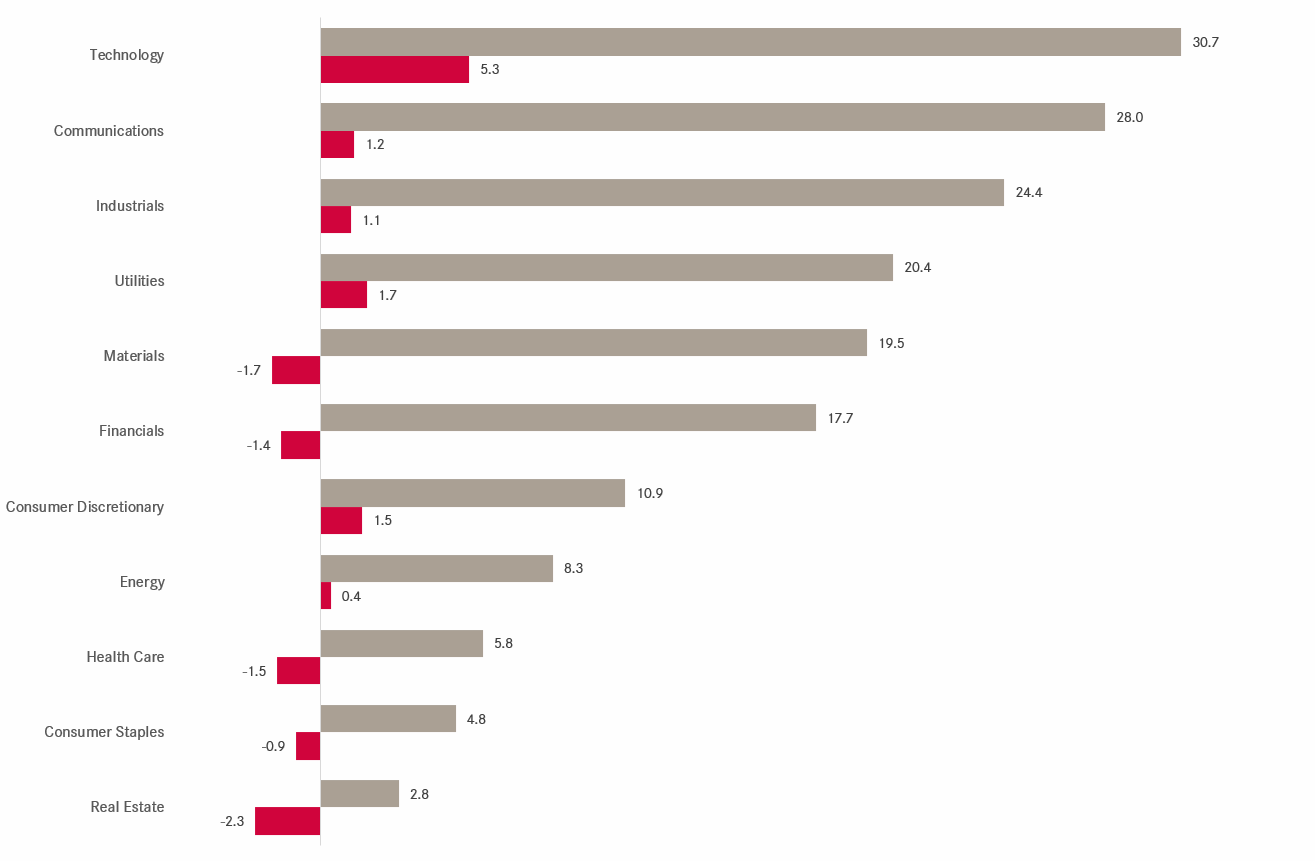
Probably best news for the equity bulls continues to be that three defensive sectors make up the bottom of the table, i.e. a rotation by investors into less risky aspects of the equity market hasn’t happened yet.
Only one sector chart as time has been flying and the sun has already starting to set on this beautiful November Monday.
We showed the chart below in several Quotedians over the past 18 months, showing how the relative performance of tech stocks (XLK) was topping out versus the broader market (SPY) at roughly the same level as back in 2000 at the height of the Dotcom bubble:
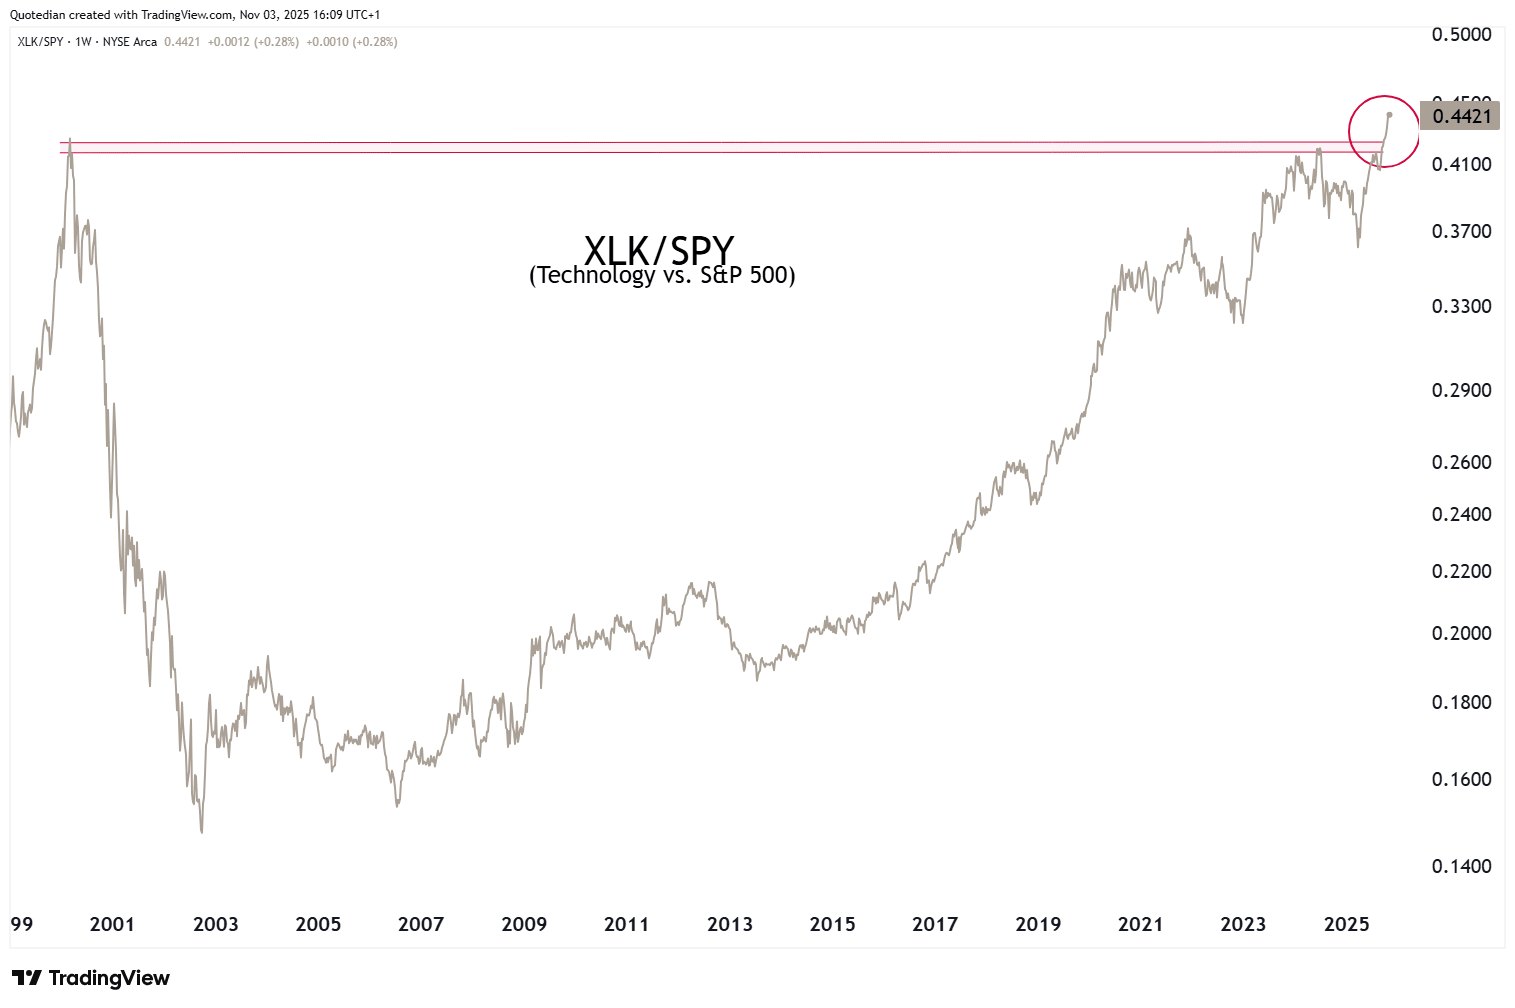
No more.
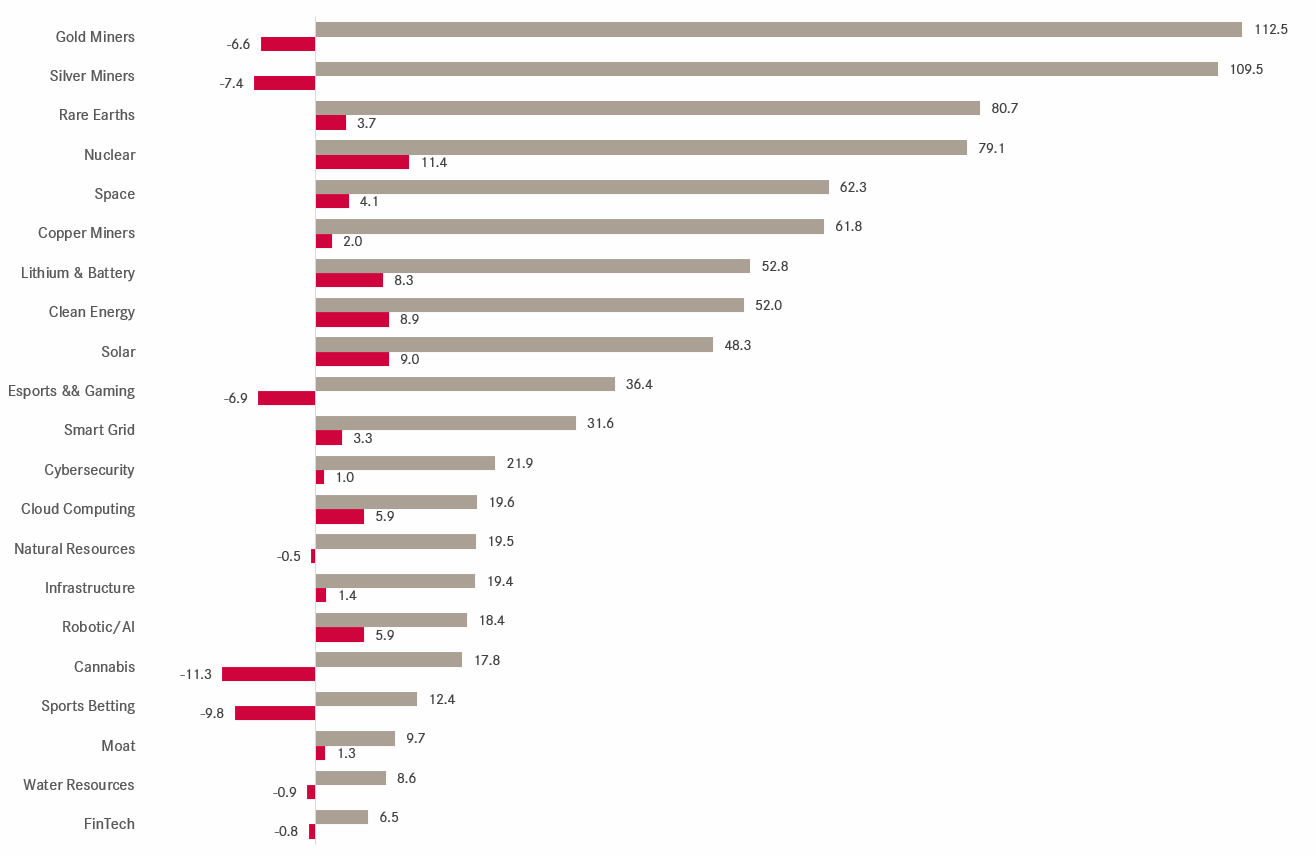
Here’s a performance table for some of the more pressing investment themes of today (all via USD-ETFs):
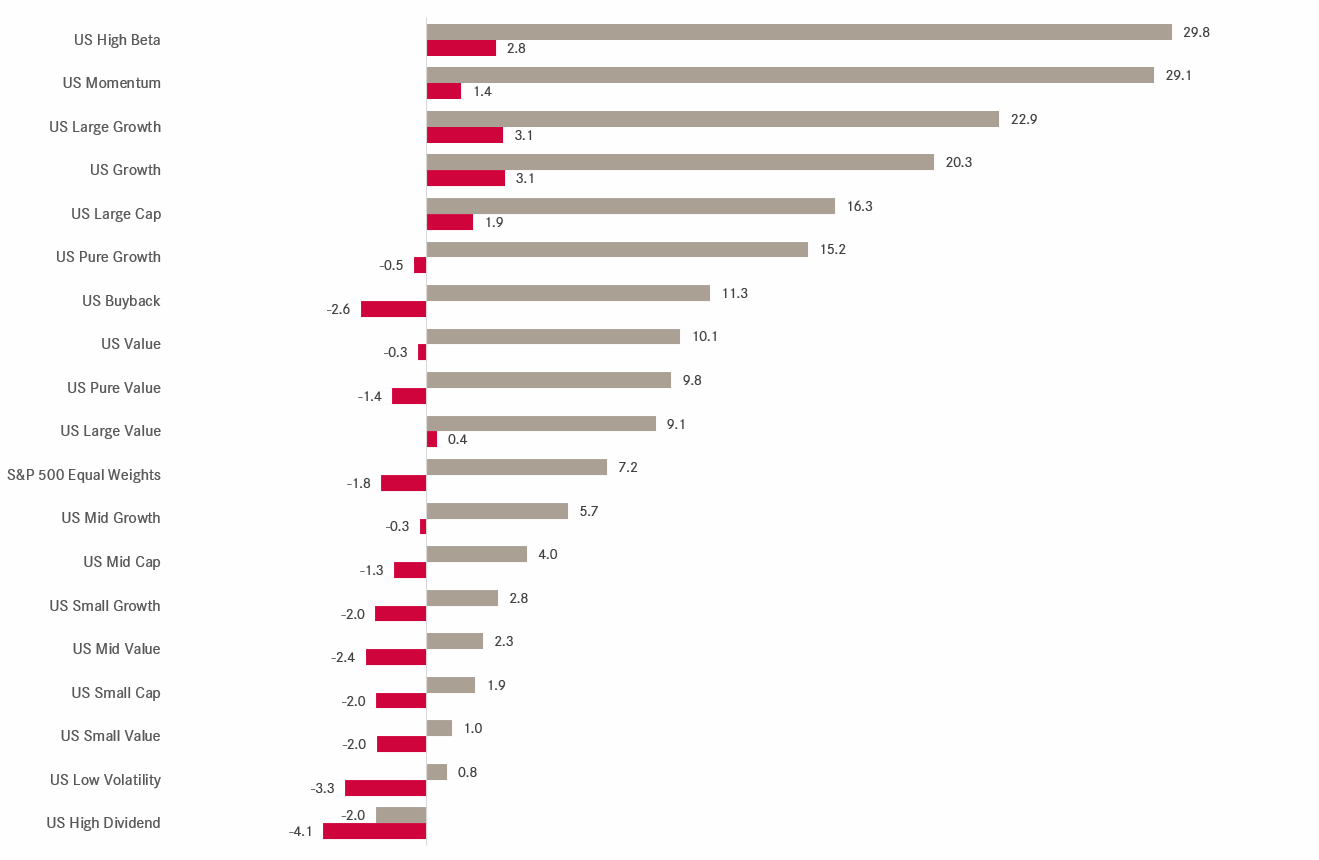
Now to two “factor” performance tables. The first, looking at more traditional factor splits:
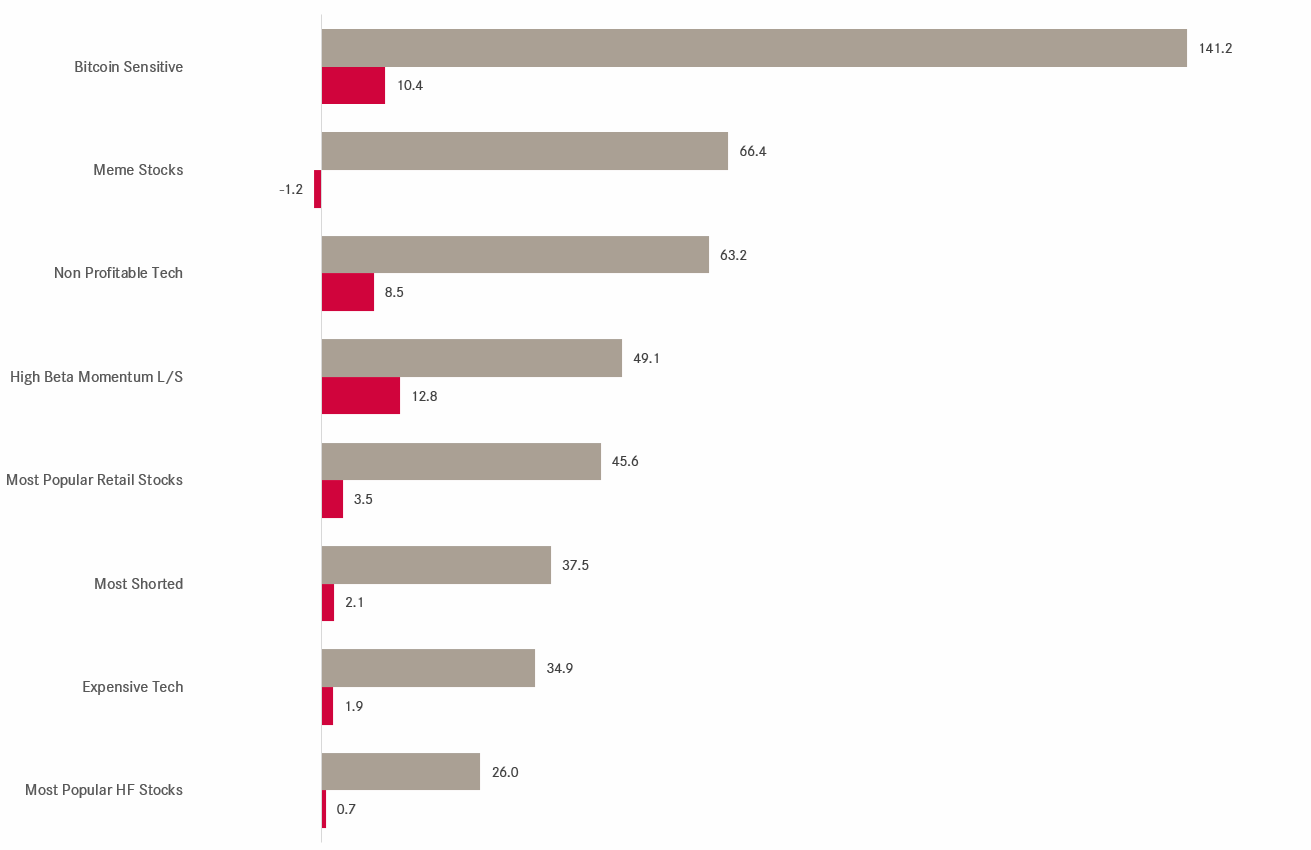
And the second one looking at some more “esoteric” factors:
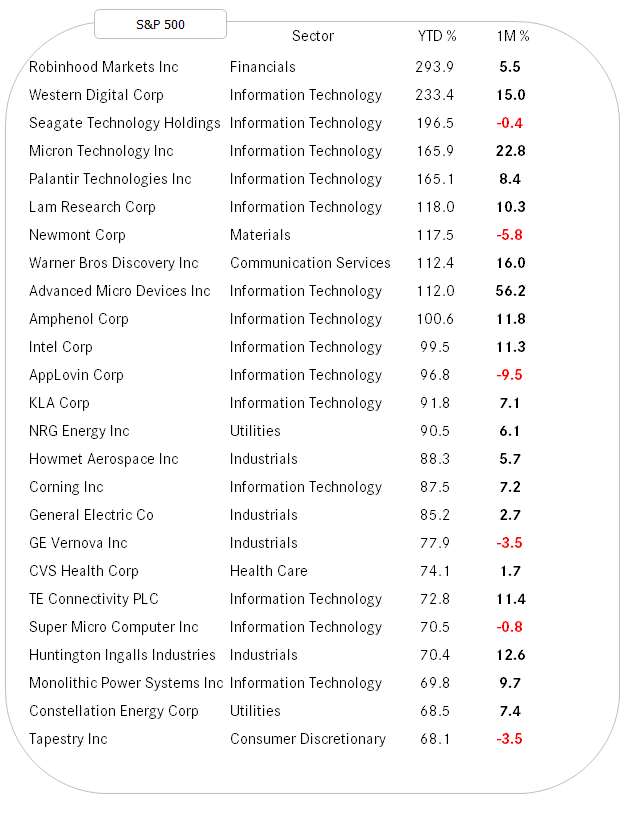
Finally, our two lists of the best performing stocks year-to-date on both sides of the Atlantic and how they have done during October.
Starting with the US:
And here’s the European equivalent:
Hence, to finalise the equity section, the best advice to equity investors is coming likely from this cartoon:

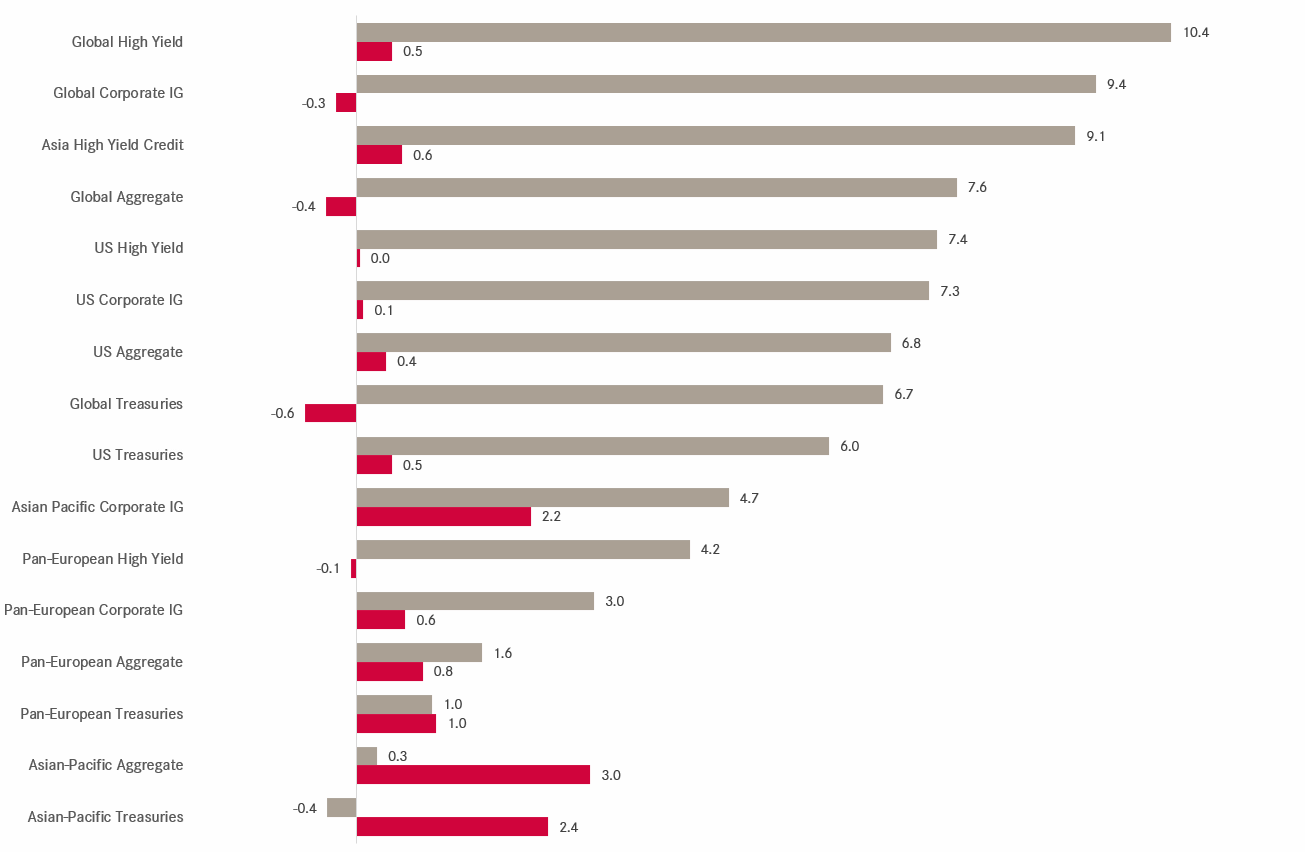
Fixed income market had a more mixed month, but on a year-to-date basis there are definitely some pockets which should have been of interest to investors:
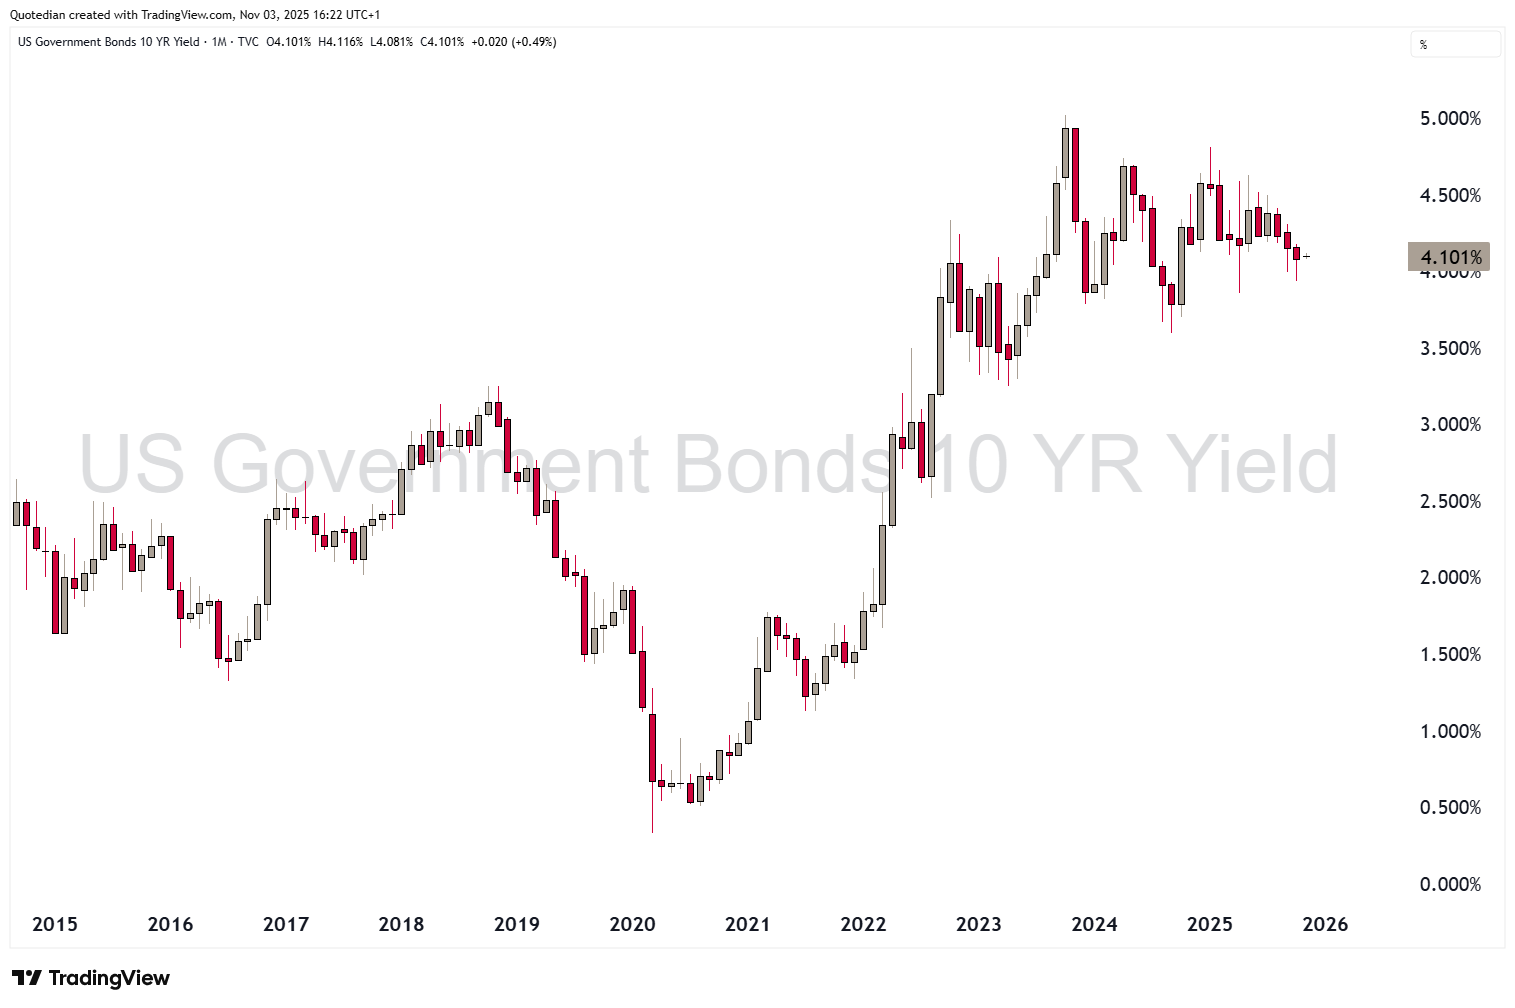
US 10-year government bond yields have hovered around the 4% label in October:
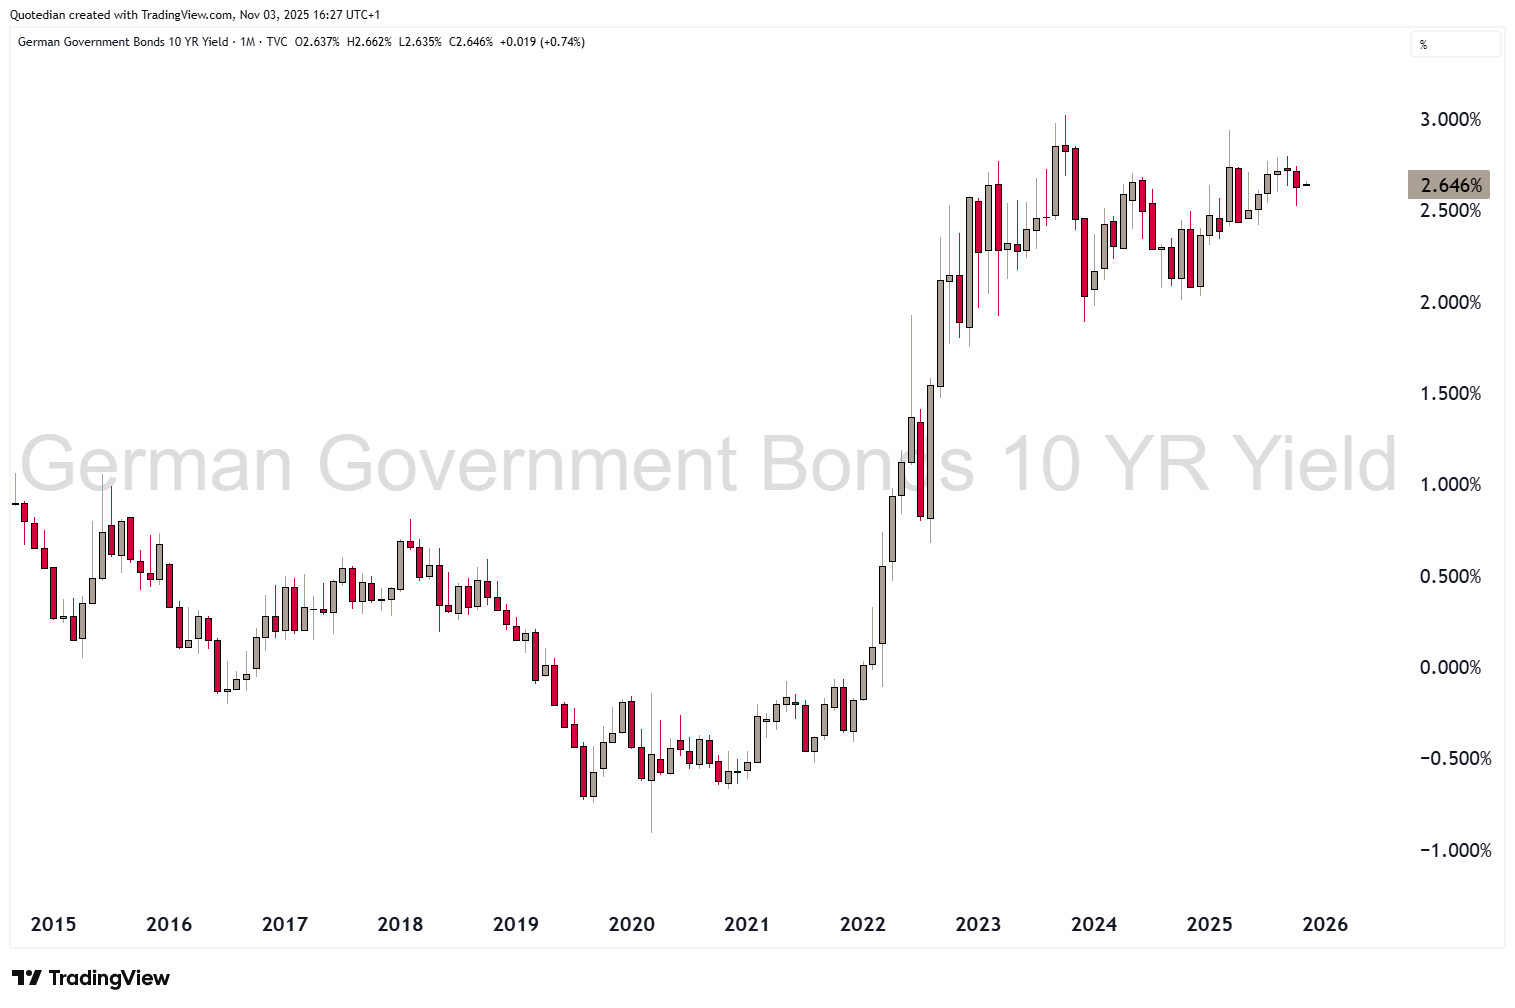
Also fairly little happening in European yields (proxied via German 10-year Bund):
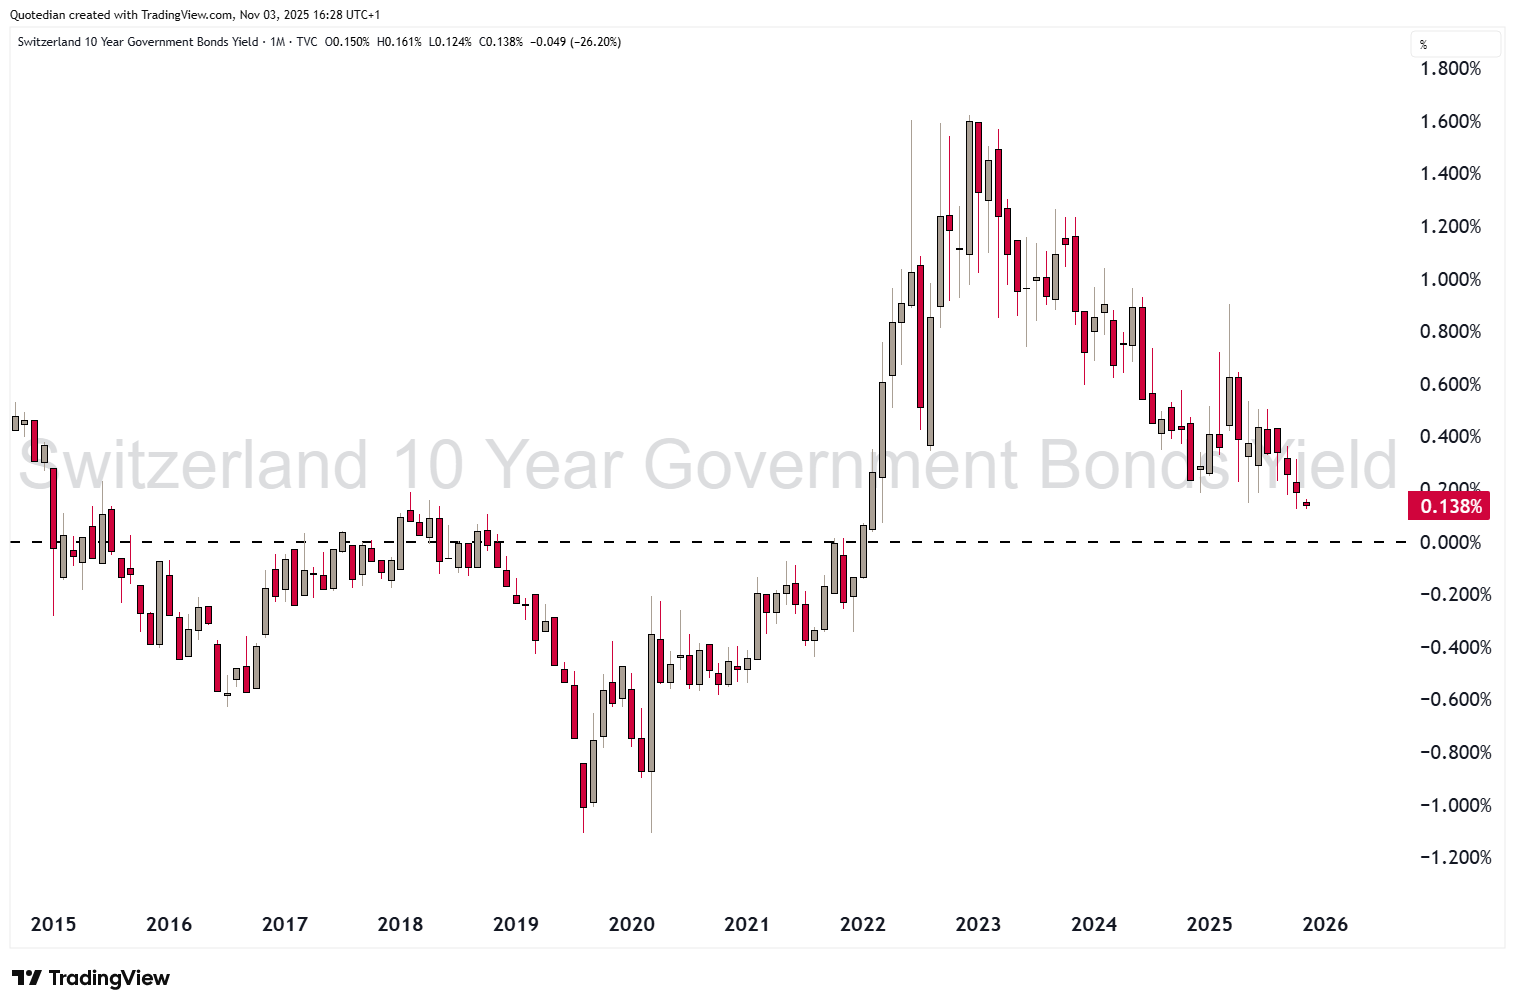
Swiss 10-year Government bond yields are dropping towards zero again:
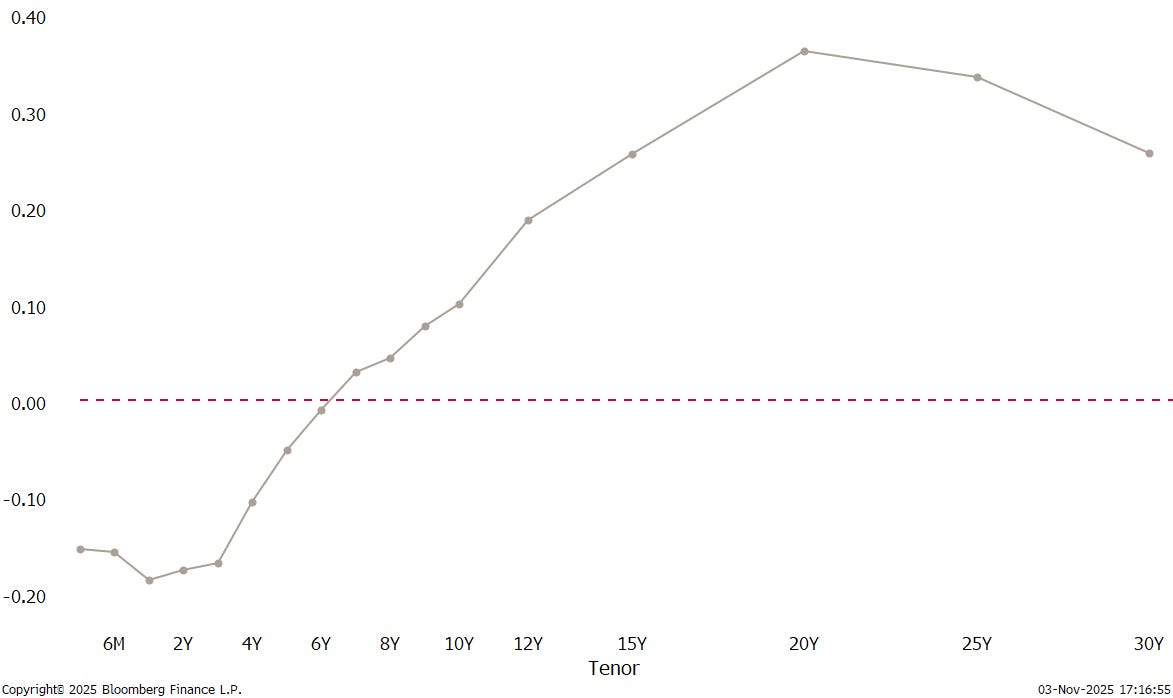
The Swiss Government Bond yield curve carries negative yields right beyond the 6-year tenor:
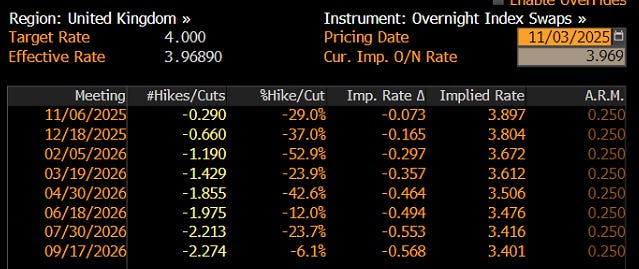
One of the biggest government bond yield drops during October came for UK Gilts,
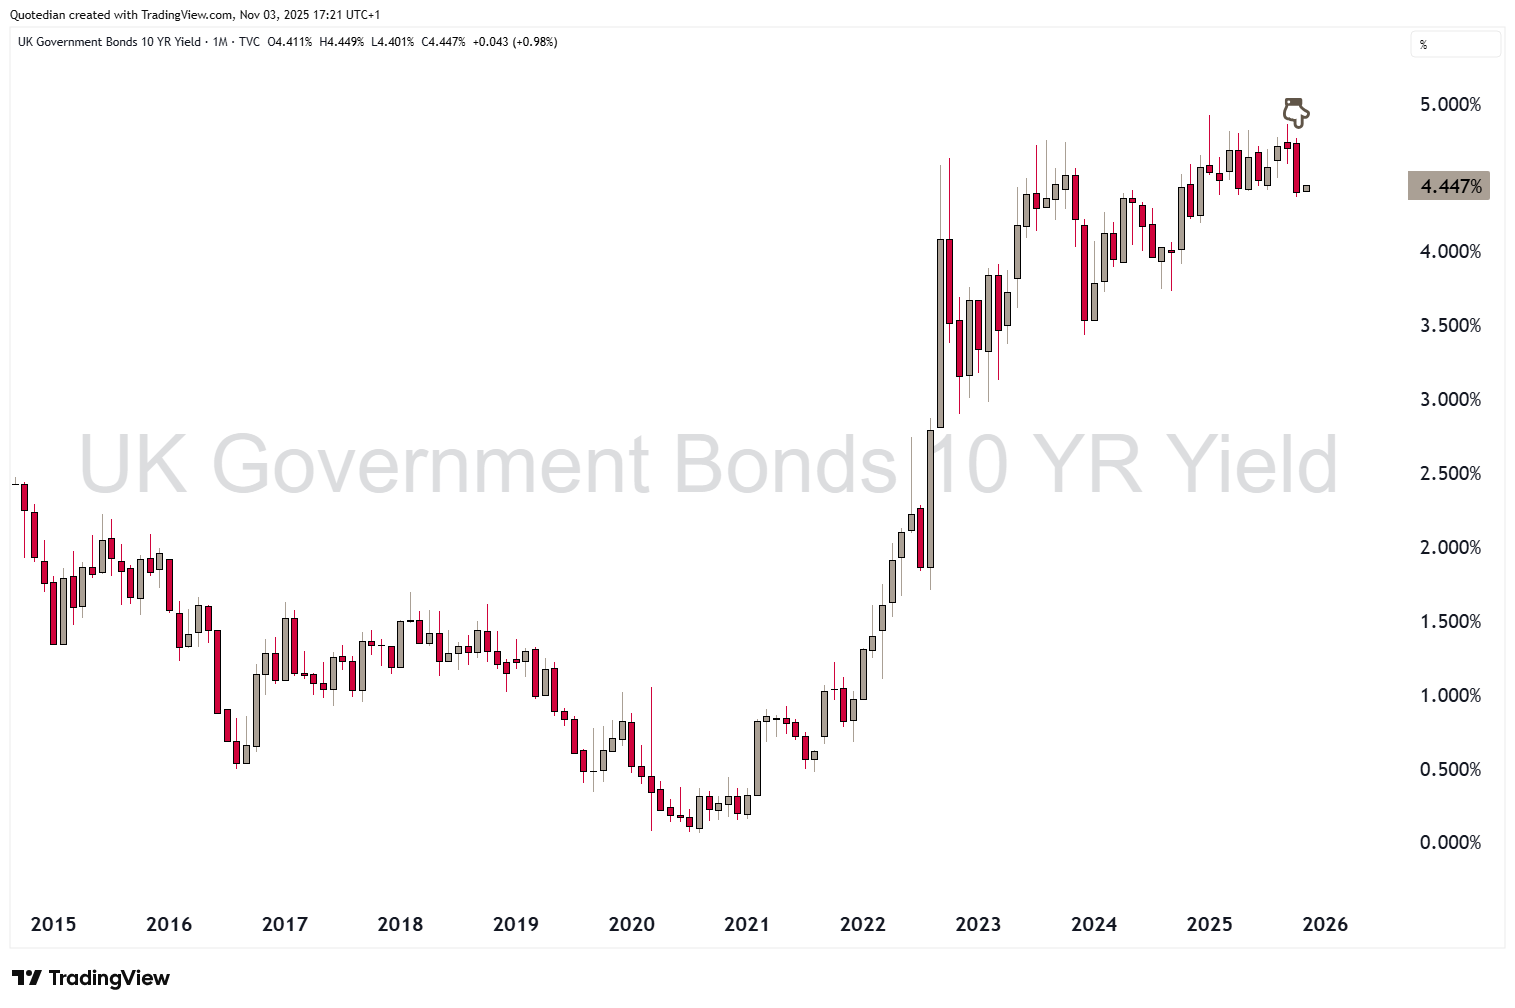
after consumer inflation (CPI) came in below expectations,
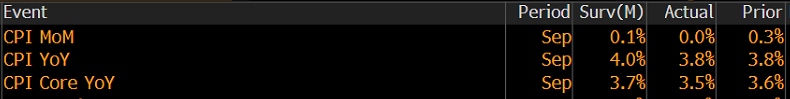
increasing the odds for BoE rate cuts next week:
With credit spread still razor thin,
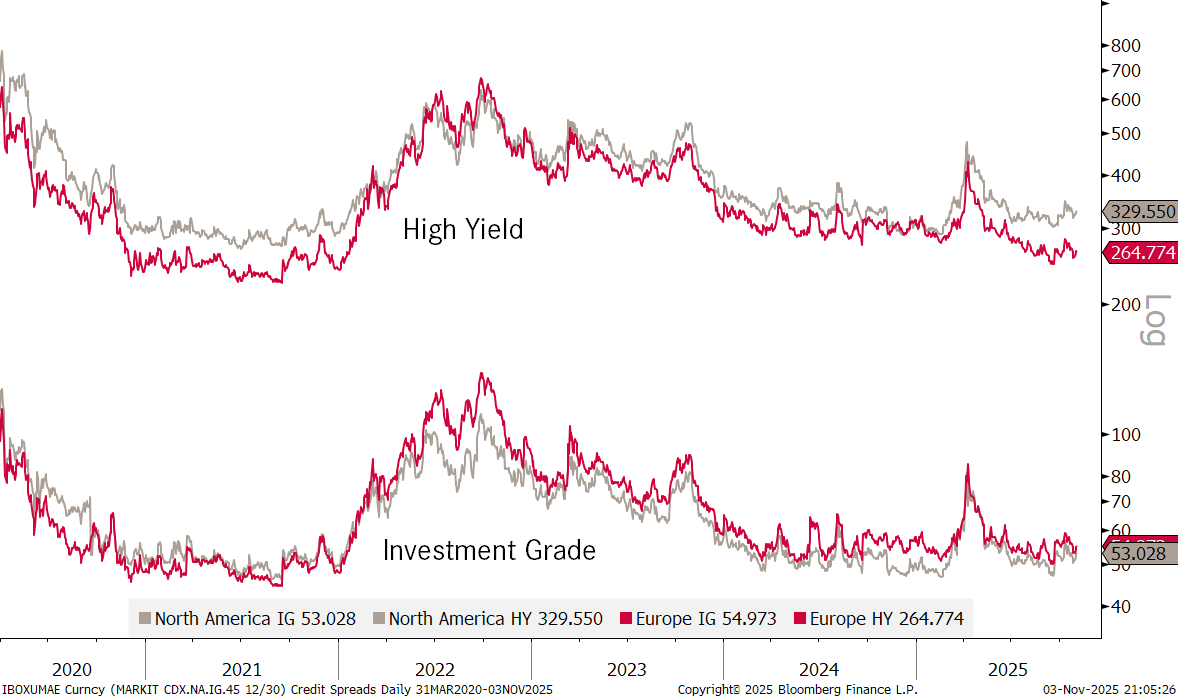
high yield bonds are making little net progress:
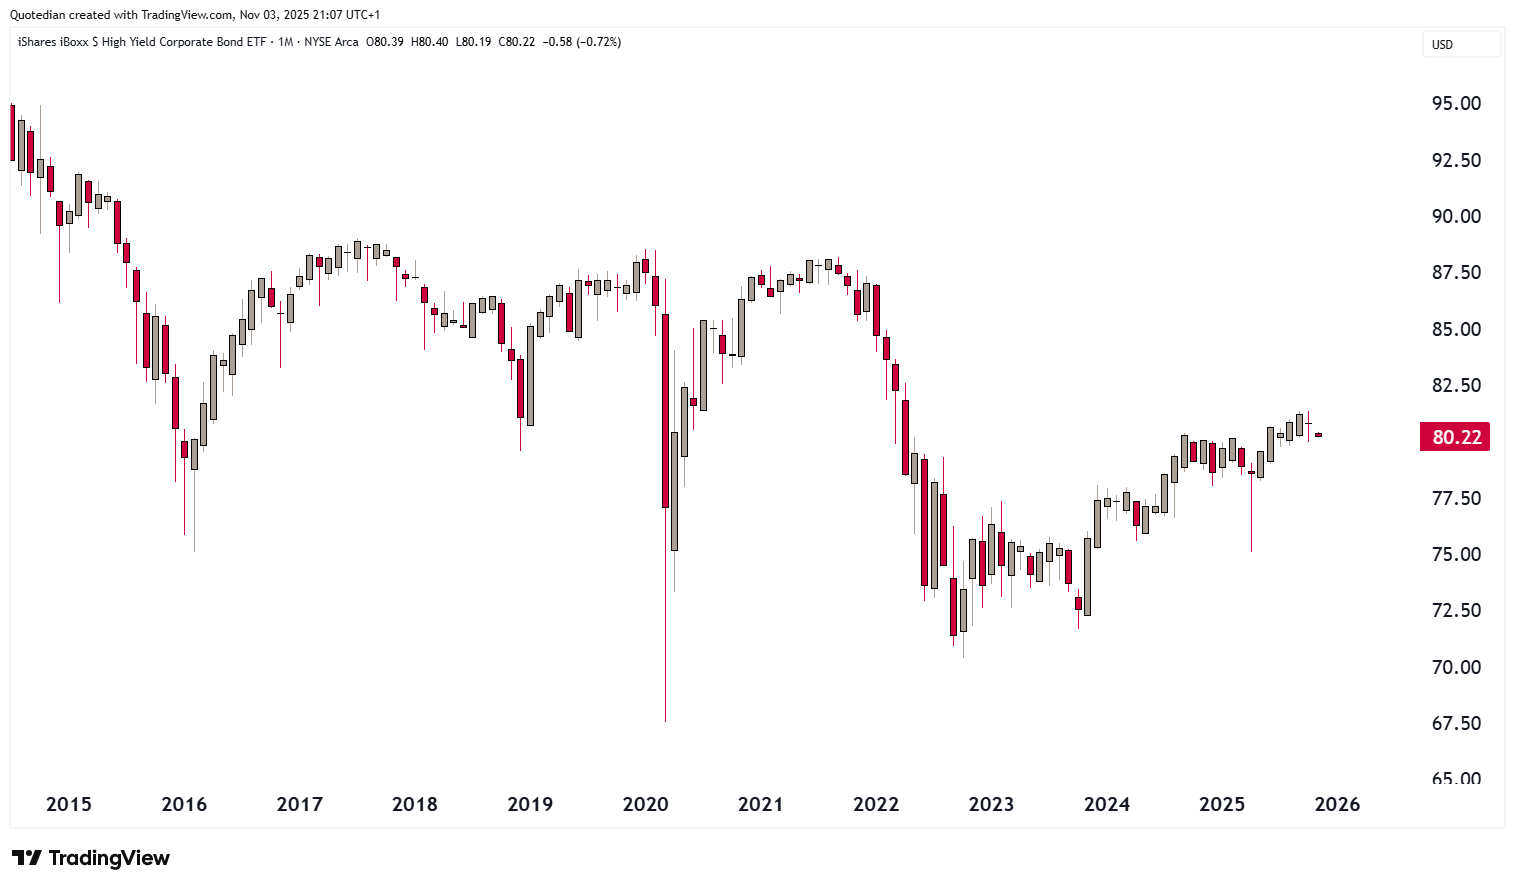
However, keep in mind that the chart of the iShares High Yield Bond ETF above is NOT a total return chart. The ETF pays about an additional six percent in dividend per annum.
Emerging market bonds, which we at NPB overweight since a few months, have been the better value proposition:
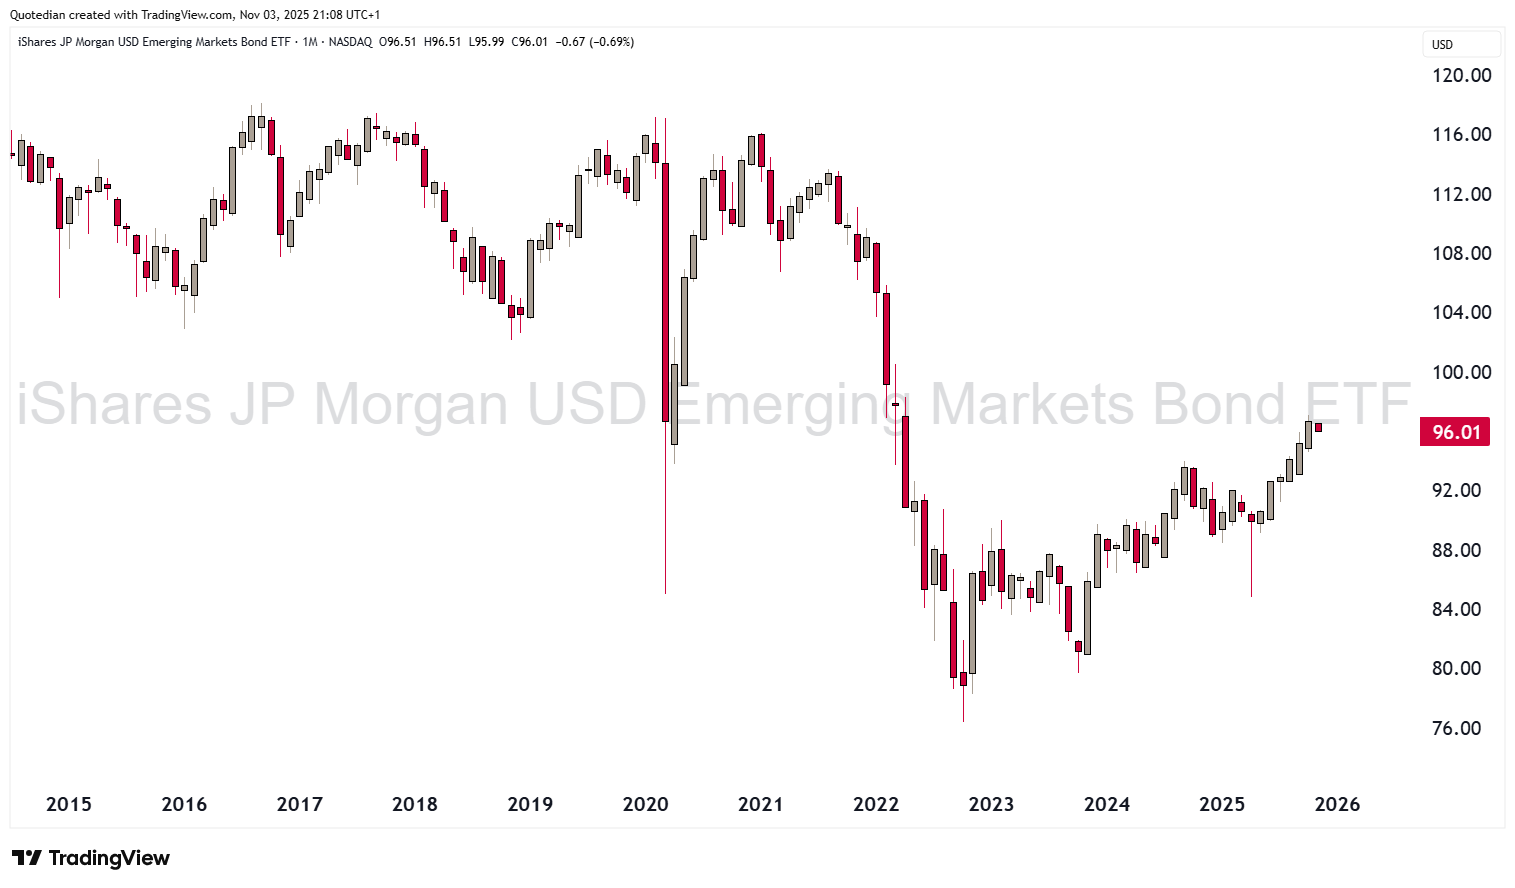
Also add a 5% p.a. dividend here.
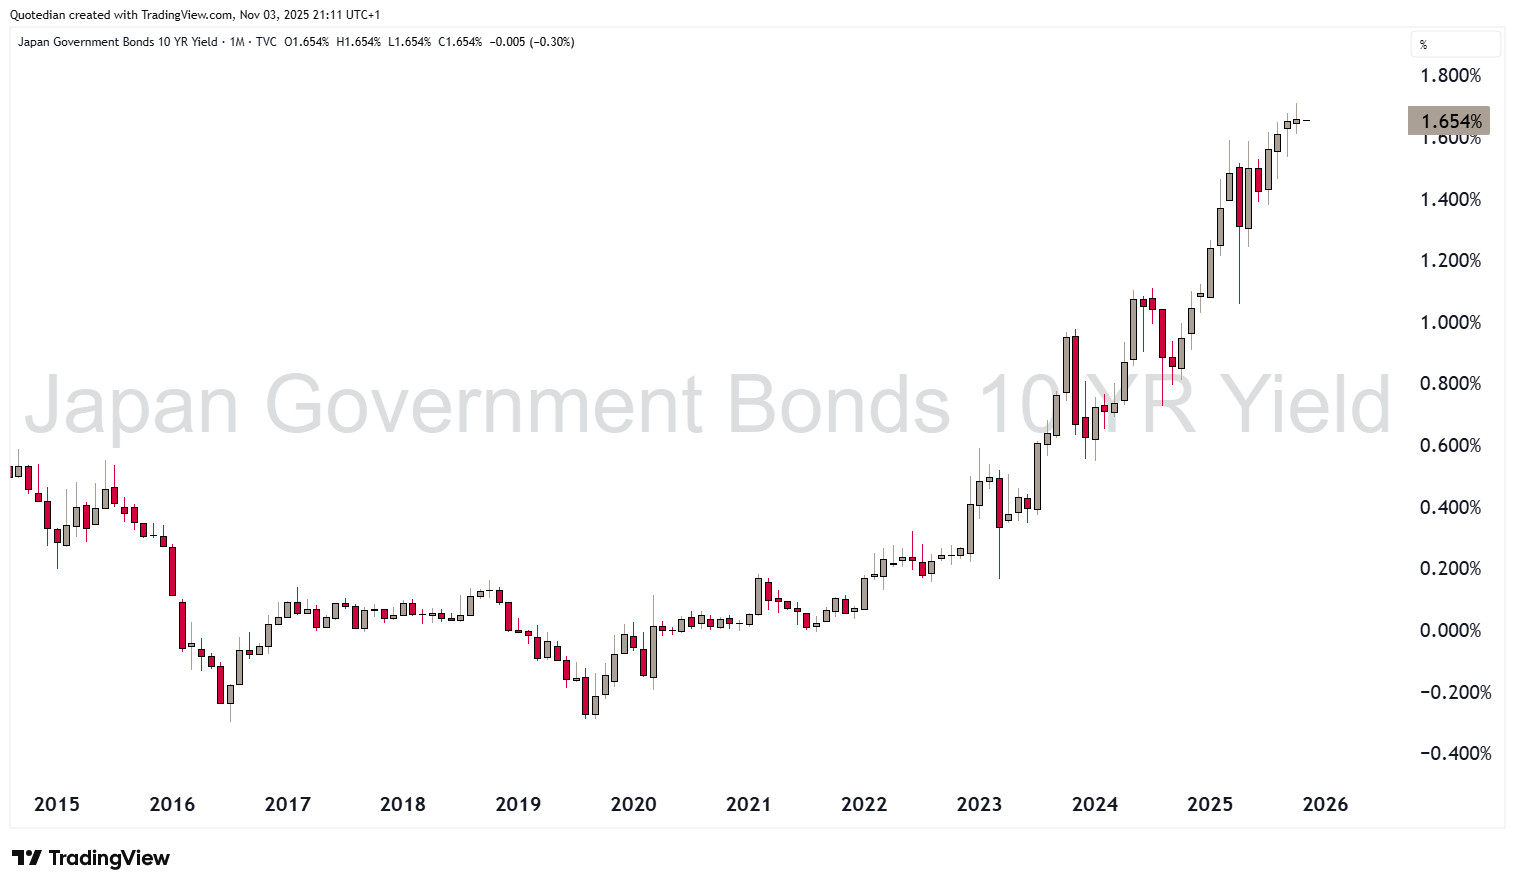
Returning to government bond yields for a moment, and as a segue into the FX segment, Japanese government bond yields, are the only G10 yields that are heading north:

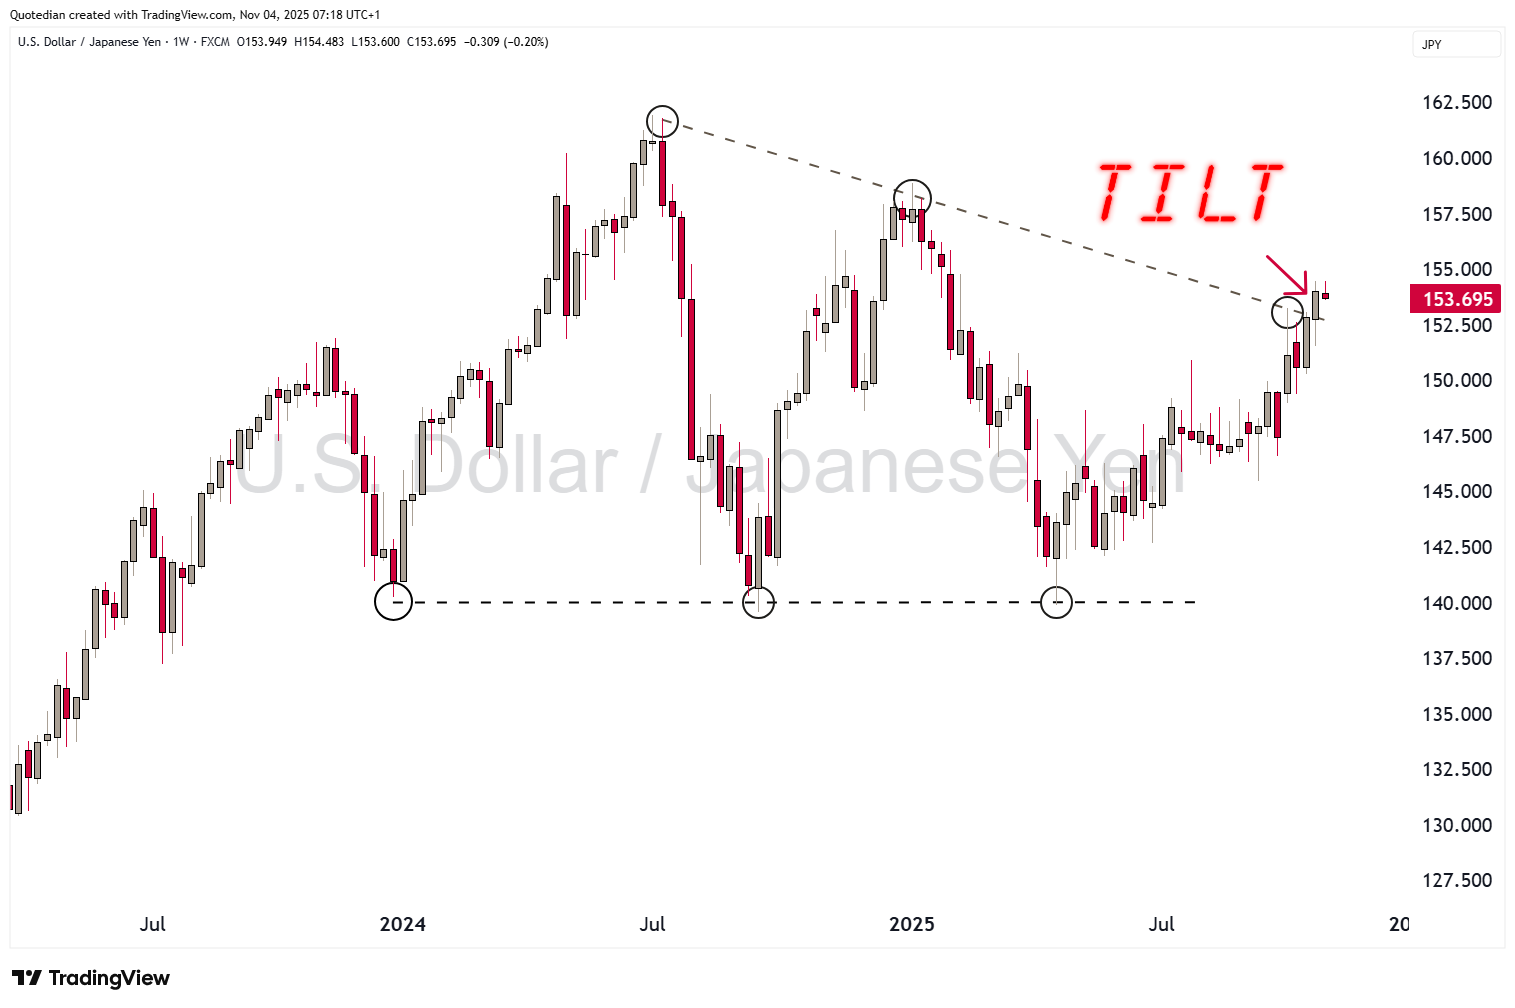
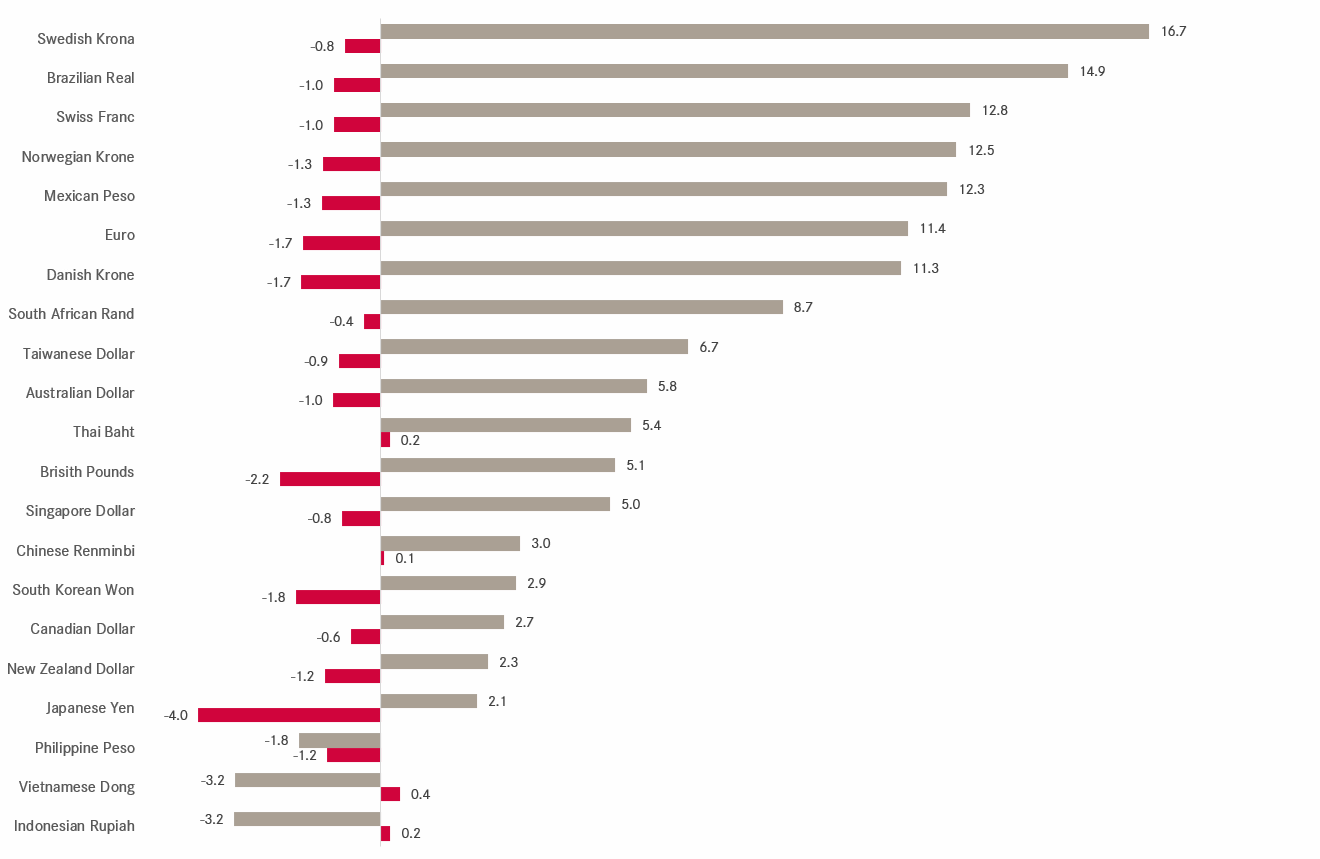
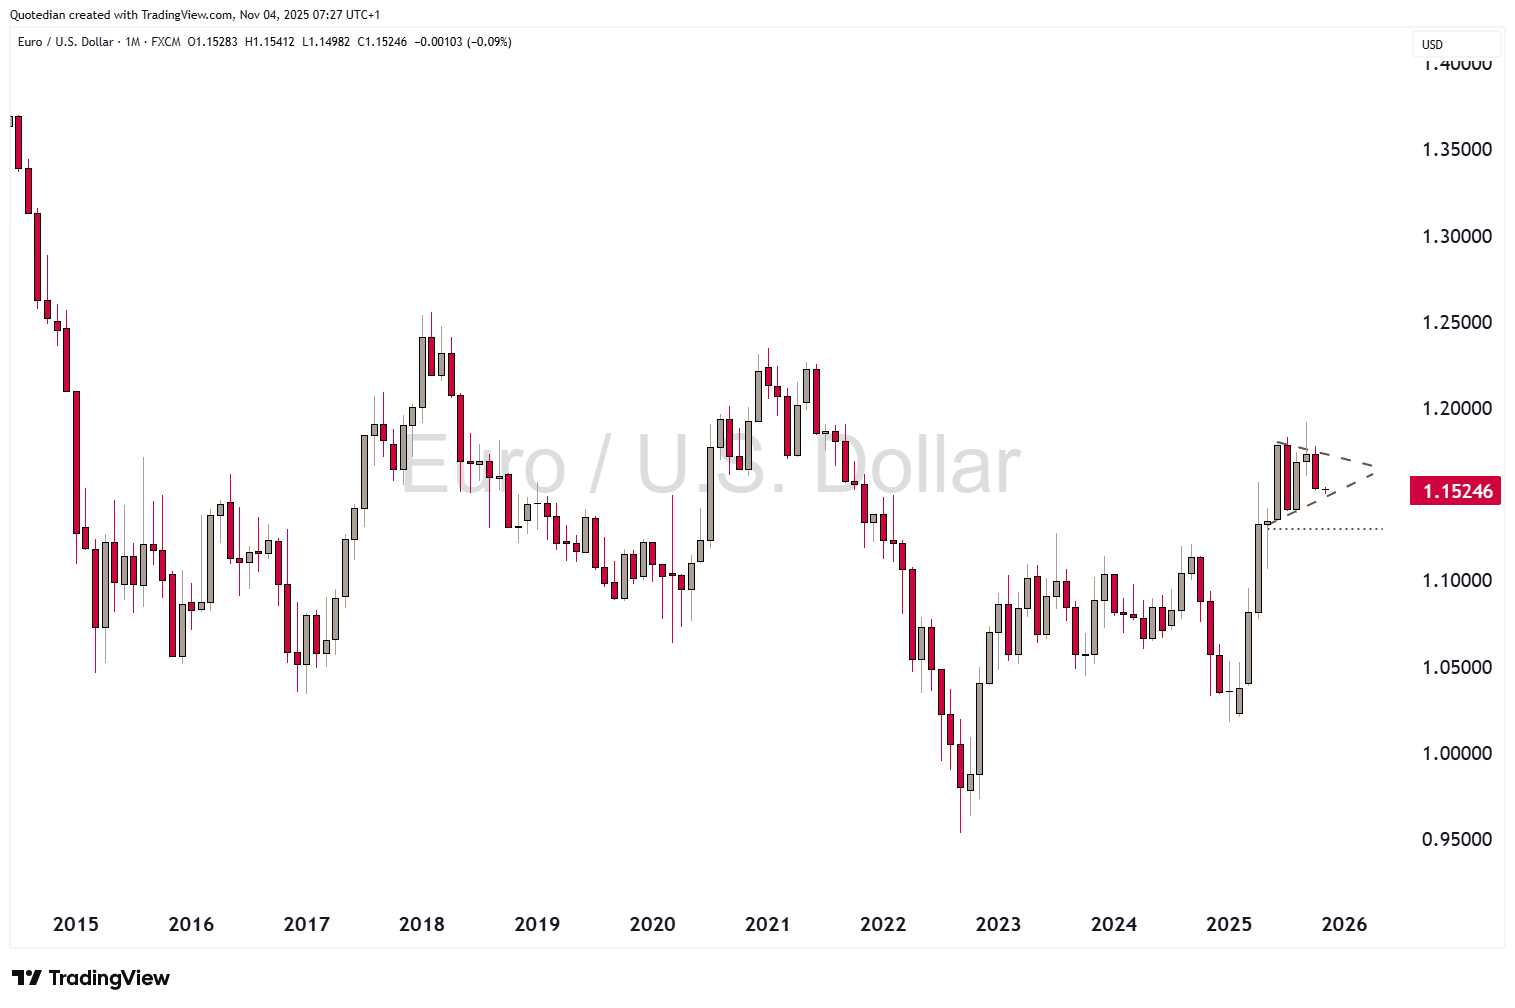
Which brings us the currency section, where our call for a stronger Yen has been put on halt as 1) the Trump administration is for now refraining from accusing the Japanese of currency manipulation and 2) subsequently the Yen broke below important support levels (resistance on the USD/JPY parity chart below):
But the Yen was not the only currency the US Dollar was showing strength against in October…
Glancing at the monthly US Dollar Index (DXY) chart then, we see that the greenback is at a crucial resistance level:
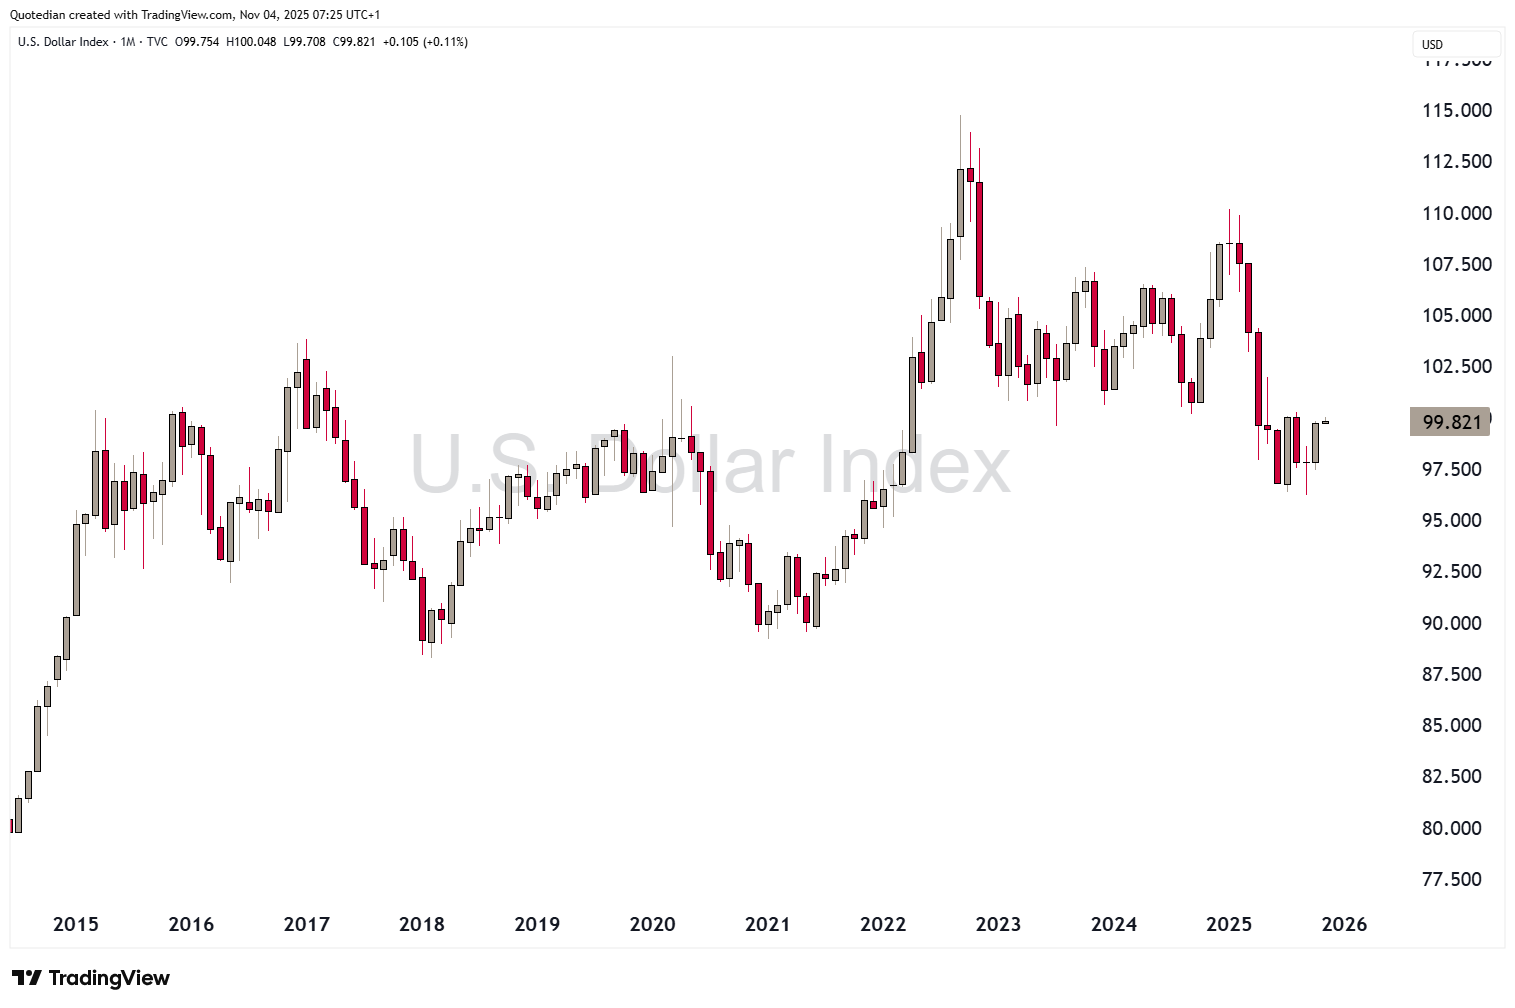
A decisive move above 100.00 would decisively improve the medium-term outlook for the currency, at least from a technical analysis point of view.
As the US Dollar Index is made up to two thirds of Euros and Yen, it is mainly the Yen weakness that is pushing the DXY higher at the moment. The EUR/USD cross could fall to 1.13 before seriously putting the longer-term uptrend in danger:
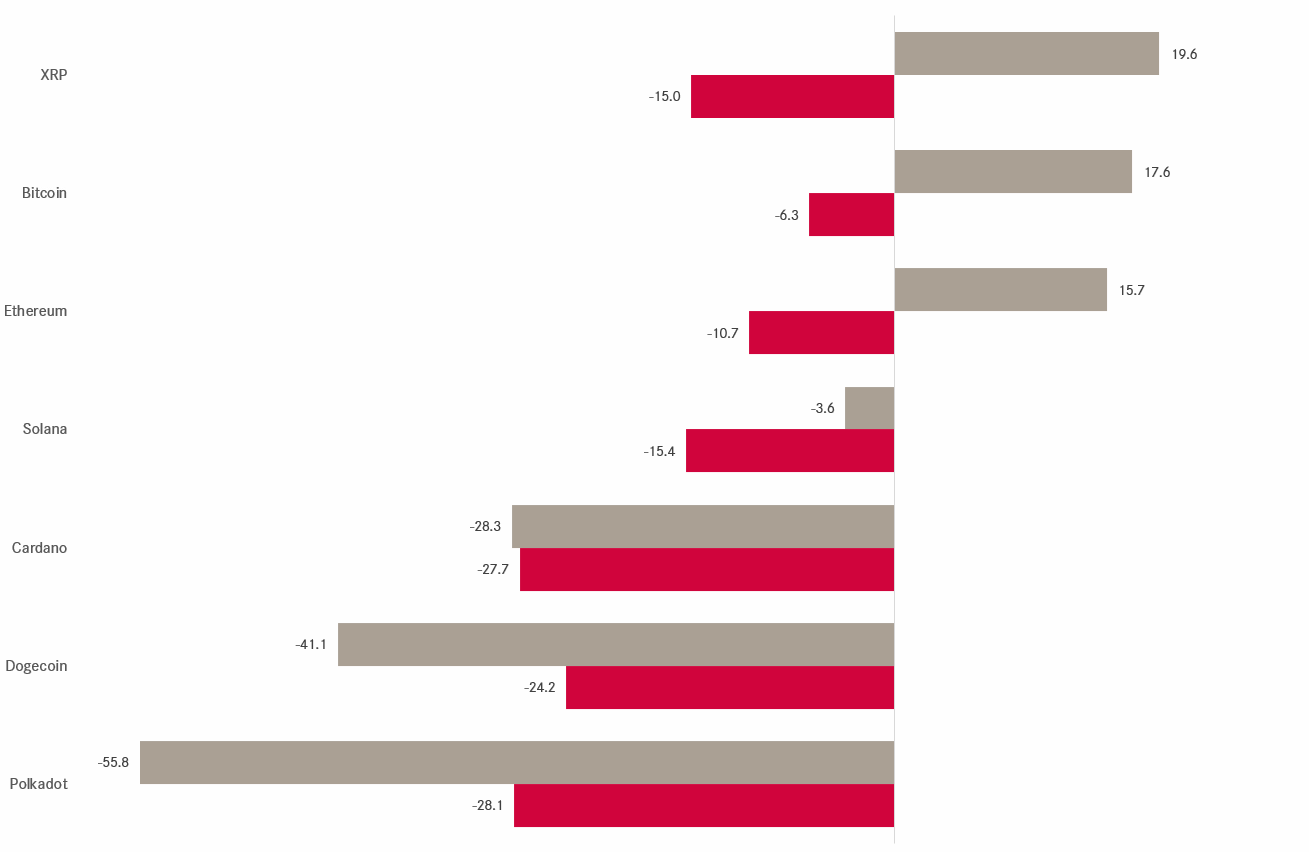
Cryptocurrencies suffered somewhat in October and in general the year 2025 turns out to be one of separating wheat (Ethereum, Bitcoin, Ripple) from chaff (Cardano, Dogecoin) with Solanan stuck somewhere in the middle:
Bitcoin looks a bit top heavy on the monthly chart and could drop to 75k-80k without endangering the secular uptrend (not a prediction):
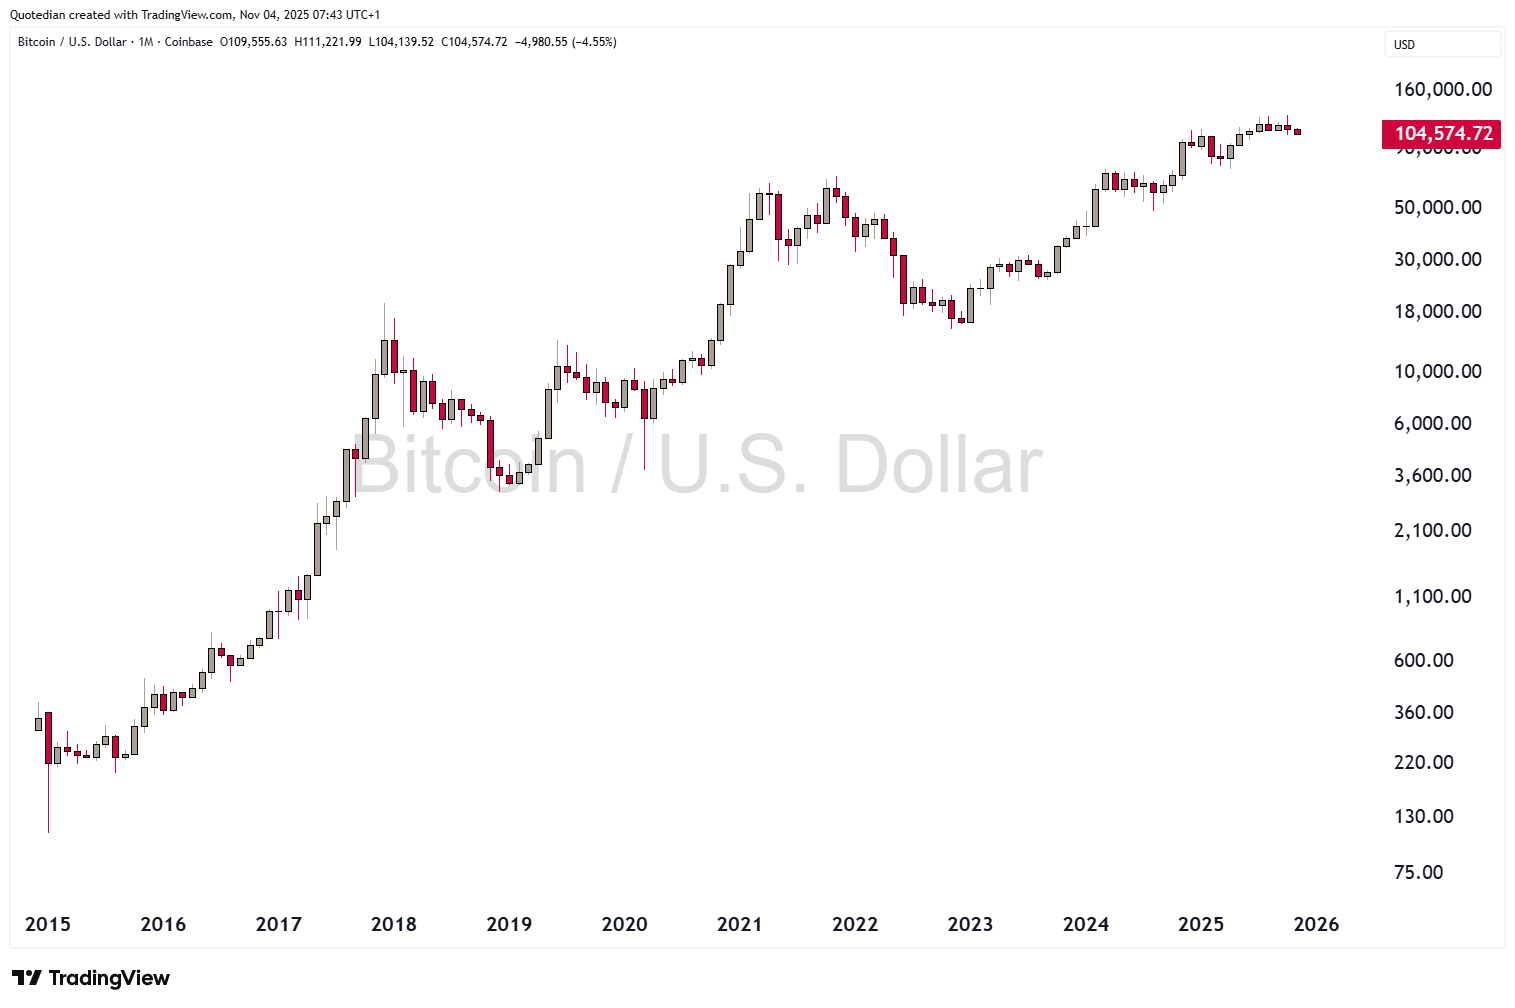
However, longer-term path of least resistance remains probably higher.

Last but not least, time to take a glance at the commodity sector, which is suddenly attracting much more attention again.
First, here’s the ‘sector’ performance chart of commodities, leaving little doubt which segment is the super-star this year (again):
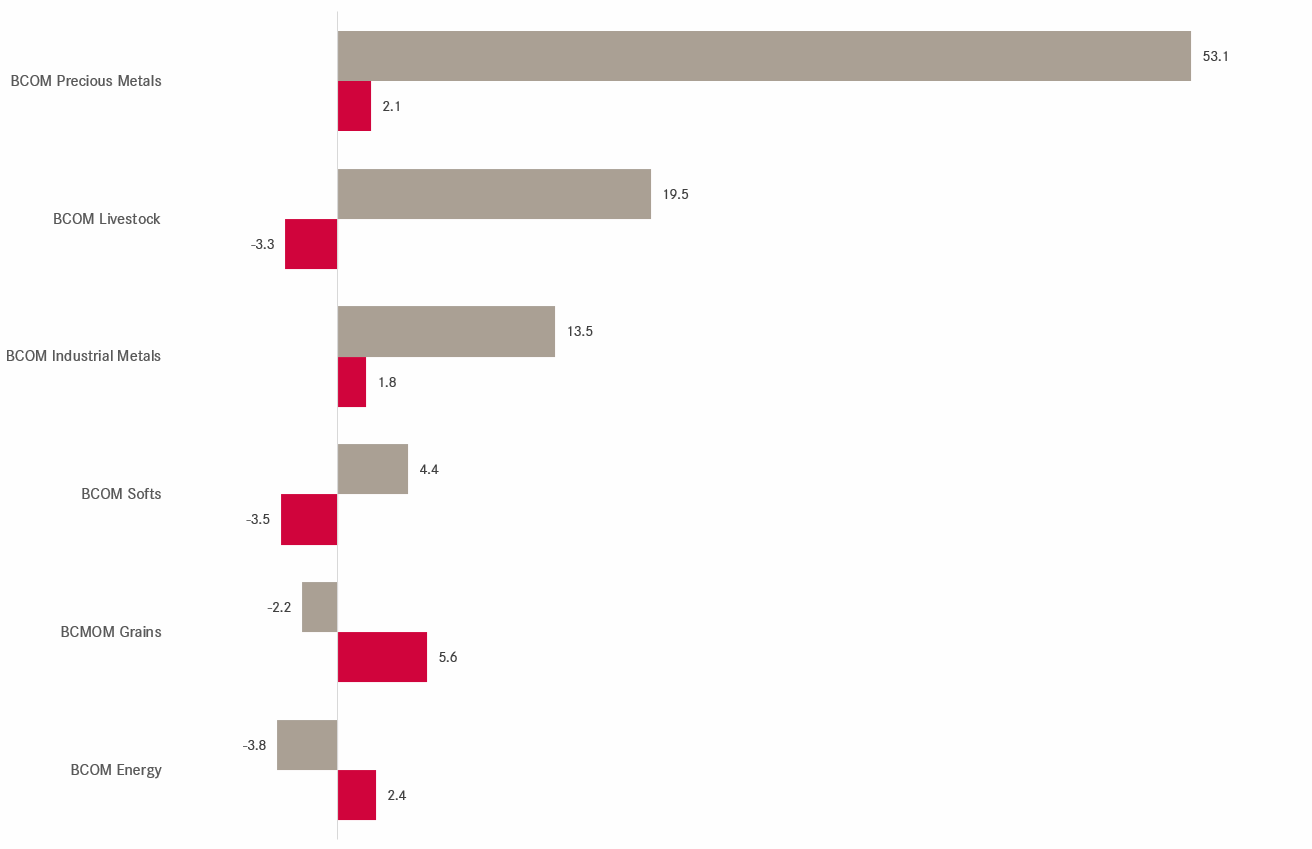
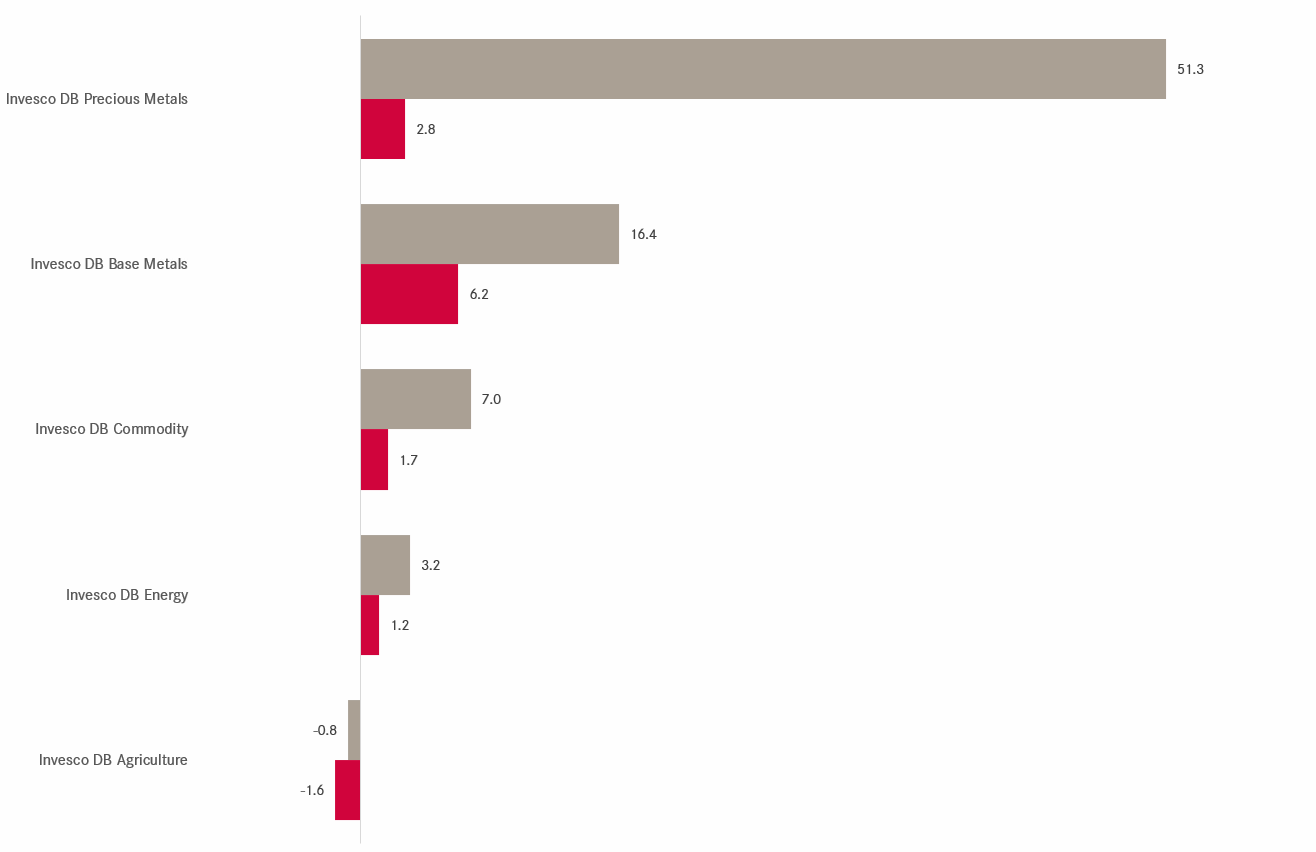
Most of these commodity ‘sectors’ are also directly investable via the Invesco DB ETF series:
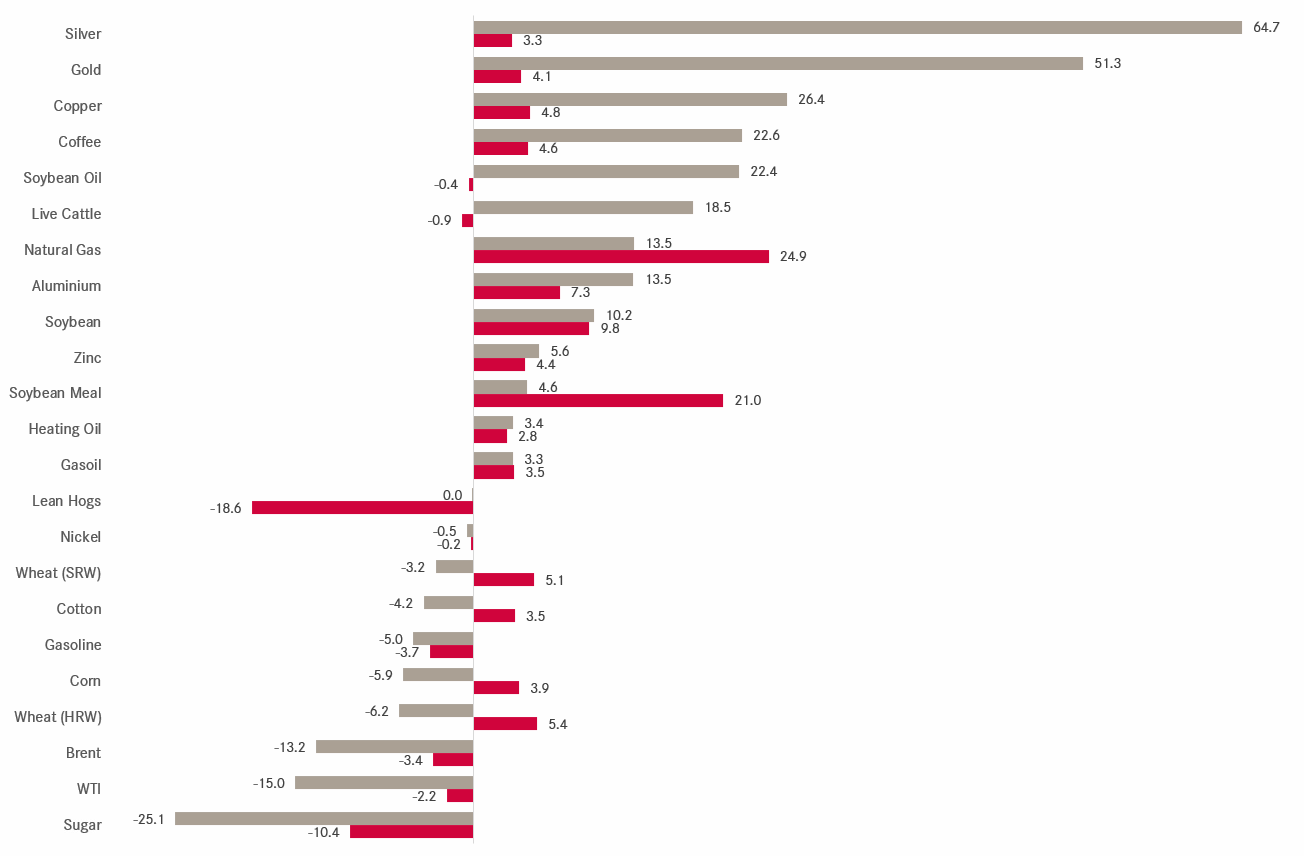
For those taking a more granular interest, here are October and YTD performances of some of the most important commodity futures:
October performance of Natural Gas stands out on the table above, let’s have a look at the monthly chart:
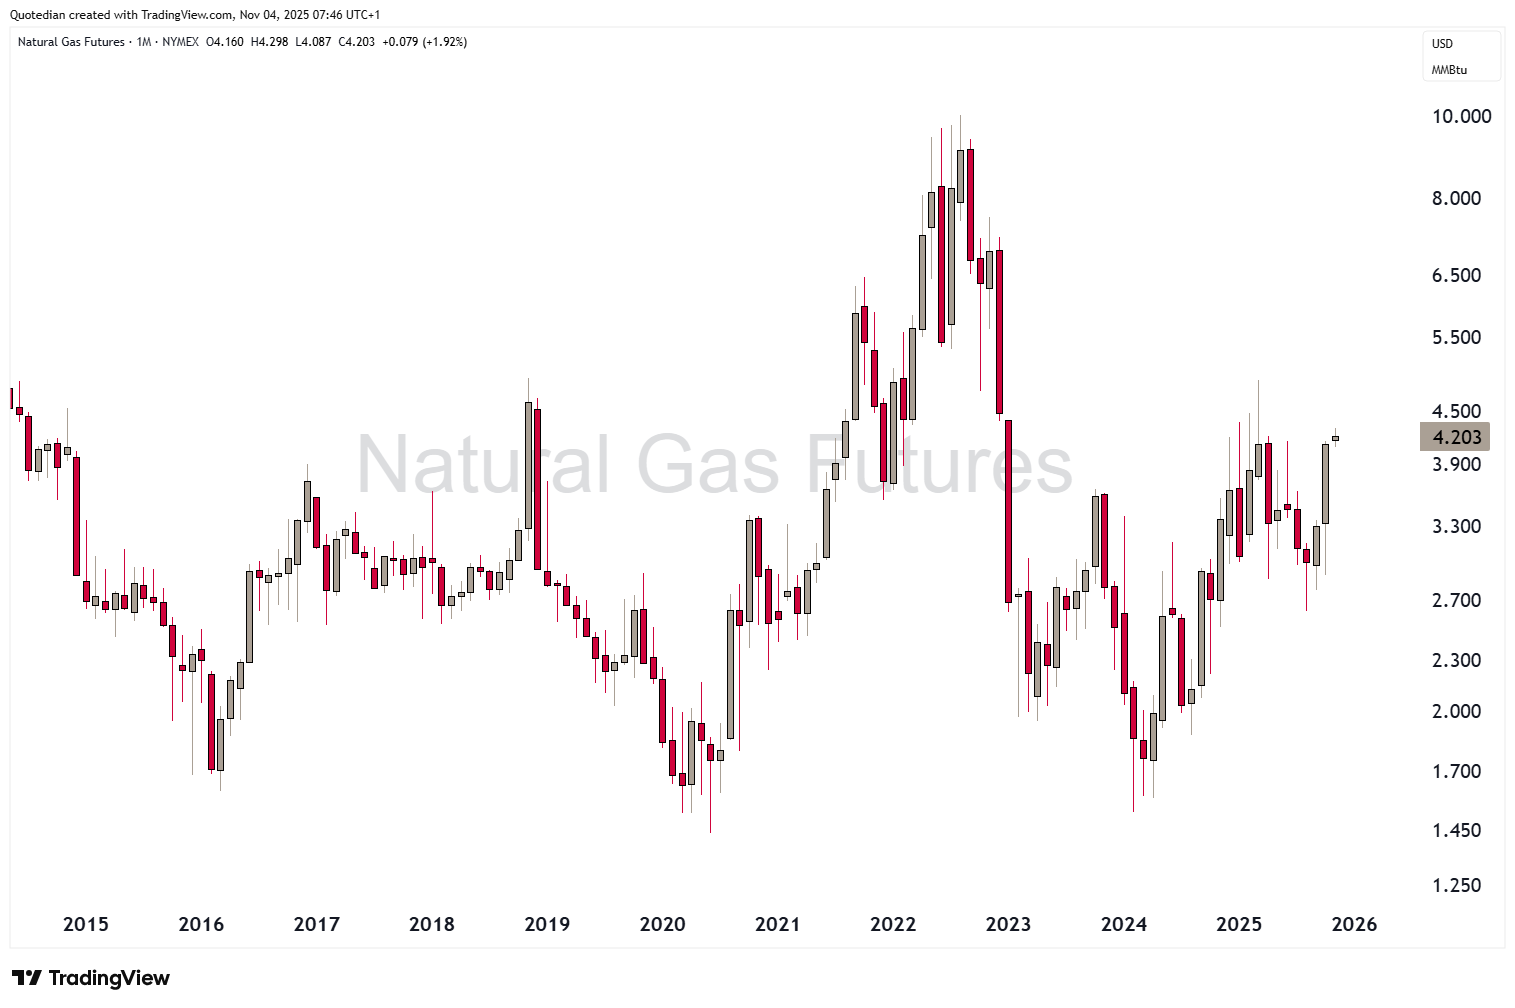
Is the AI data centre energy-need story finally revealing itself in the price of natural gas?
Perhaps.
We just must keep in mind that NG1 is an “gloriously volatile basterd”:
Of course, we need to look at the star performing precious metals too. Starting with Gold, after claiming the 3,000 level for a first time in March, the 4,000-mark was conquered only six months later:
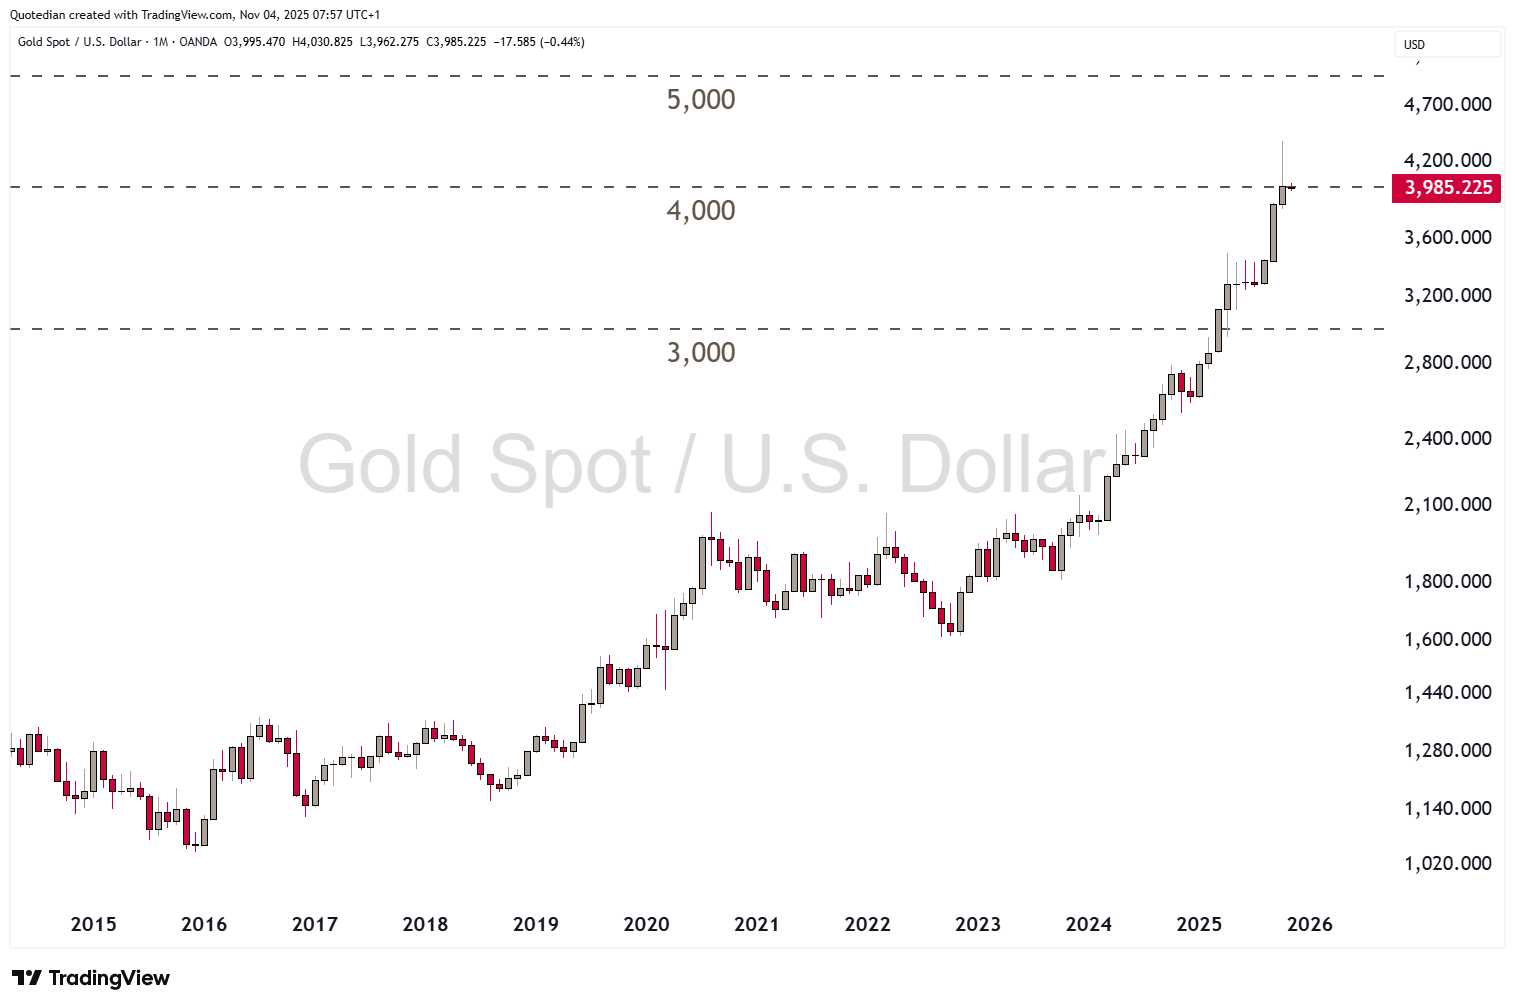
The yellow metal is still strongly overbought (RSI) on a monthly basis, but not anymore on the weekly and the daily chart. Some more sideways consolidation is likely on the menu from here on, but remain exposed and buy the dips (and gold miners). I also continue to find this chart telling:

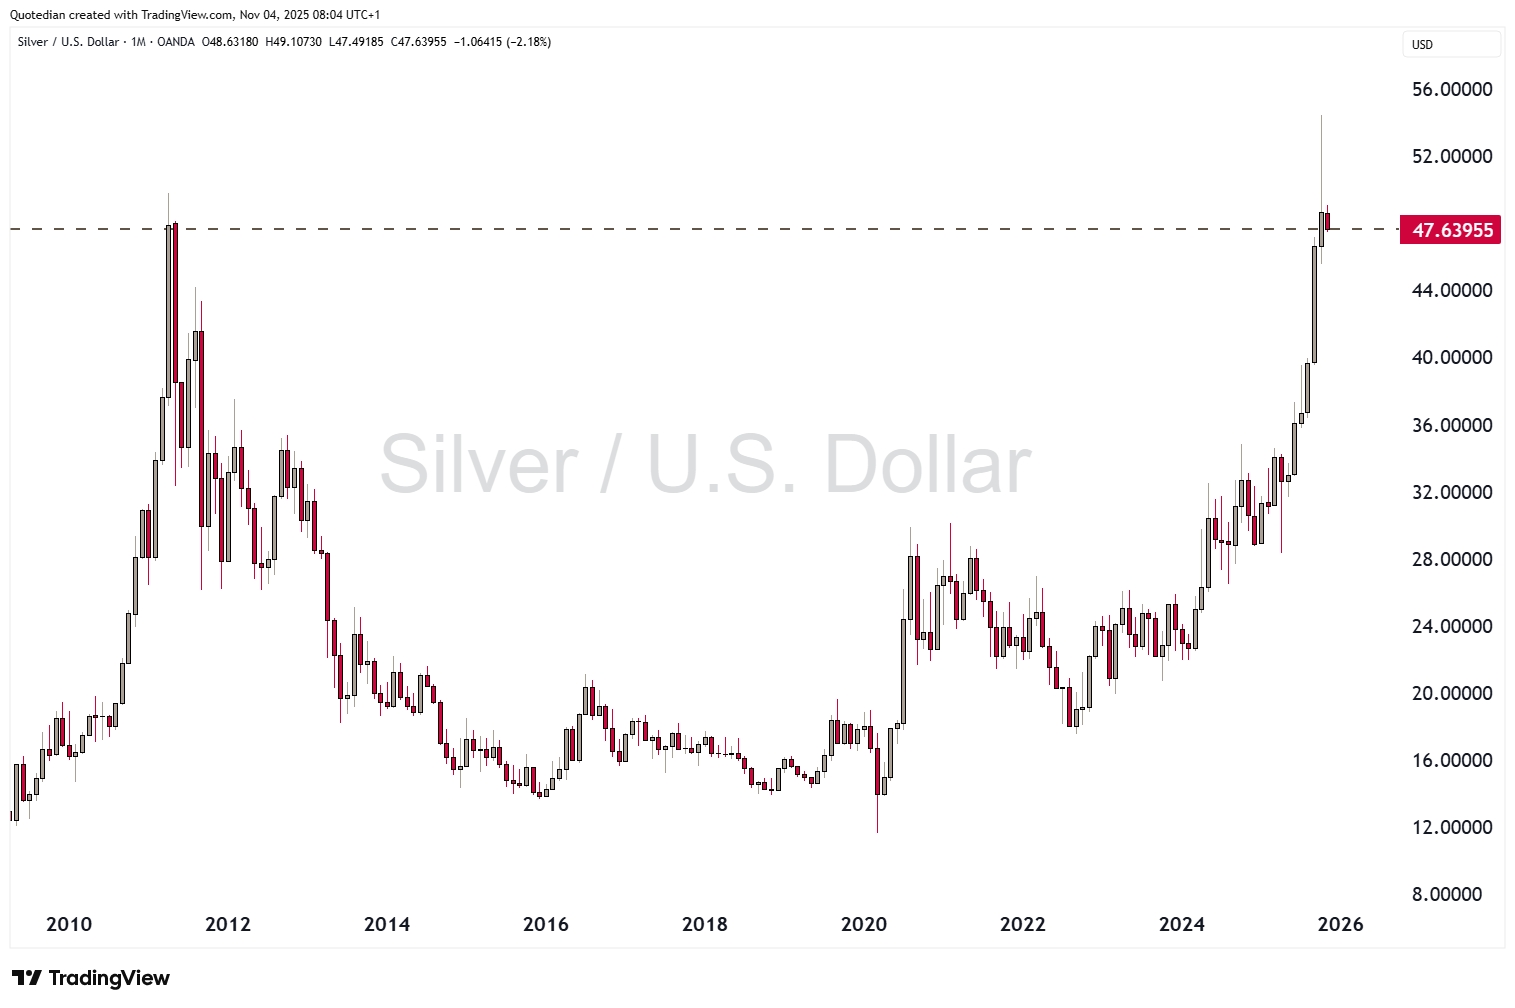
In Silver, the risks of a blow-off top remain, as a 15-year base was only broken last month:
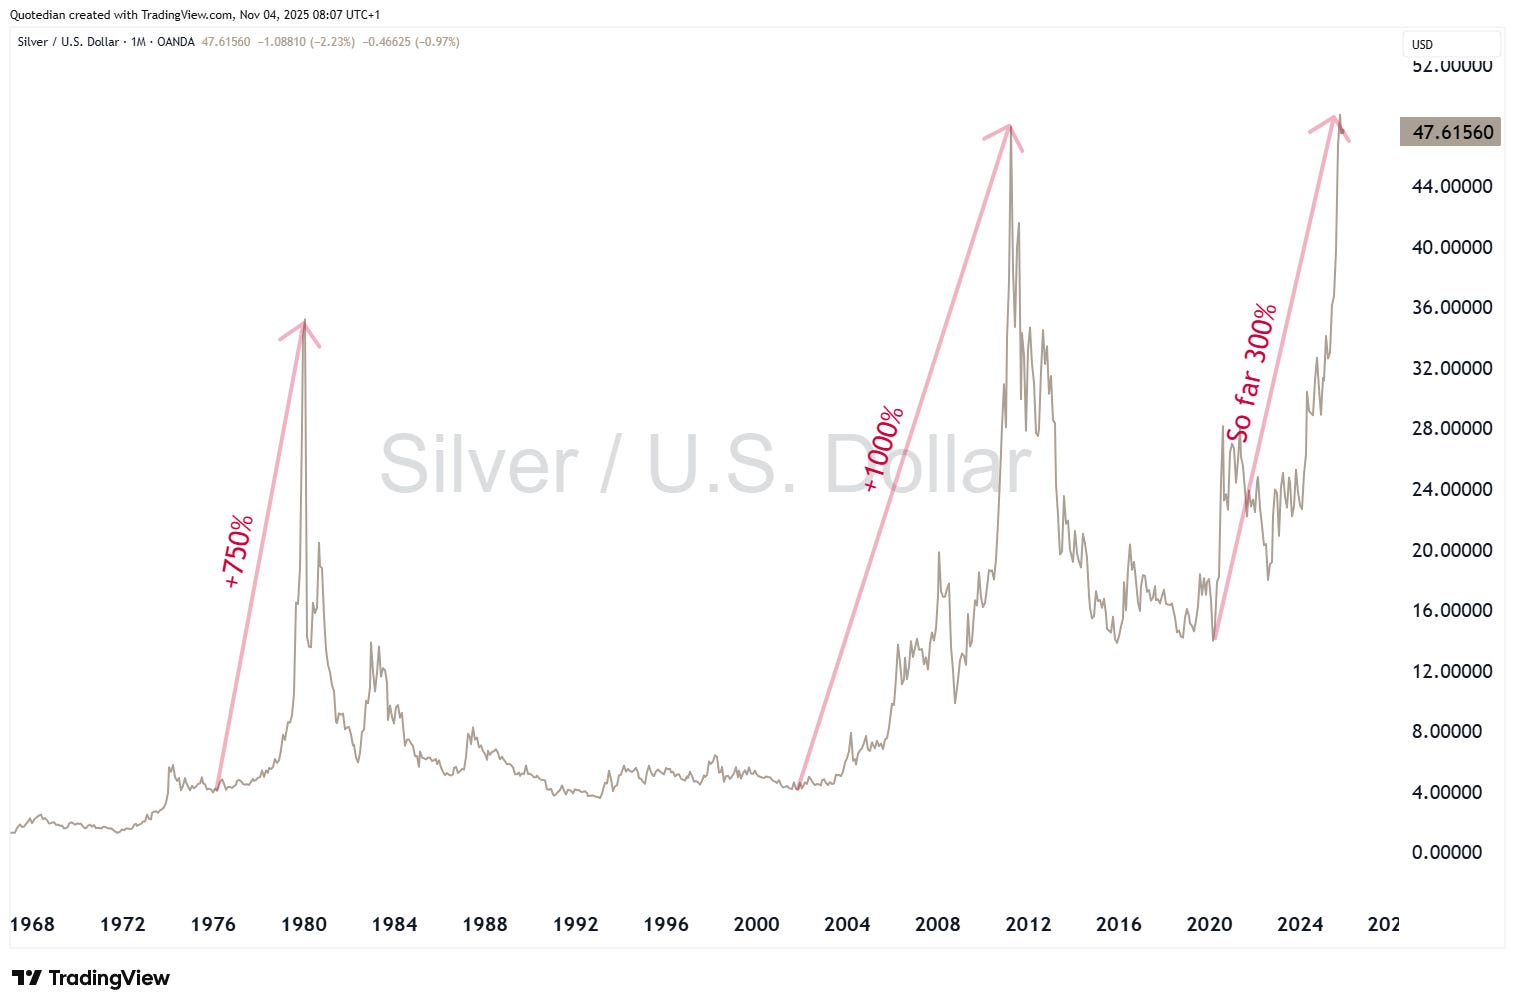
We would continue to play that upside risk through optionality, i.e. far out-of-the money calls “just in case” and also keeping this chart in mind:
But overall, gold and silver miners should continue to do very well over the coming months, even if the underlying metals move sideways only.
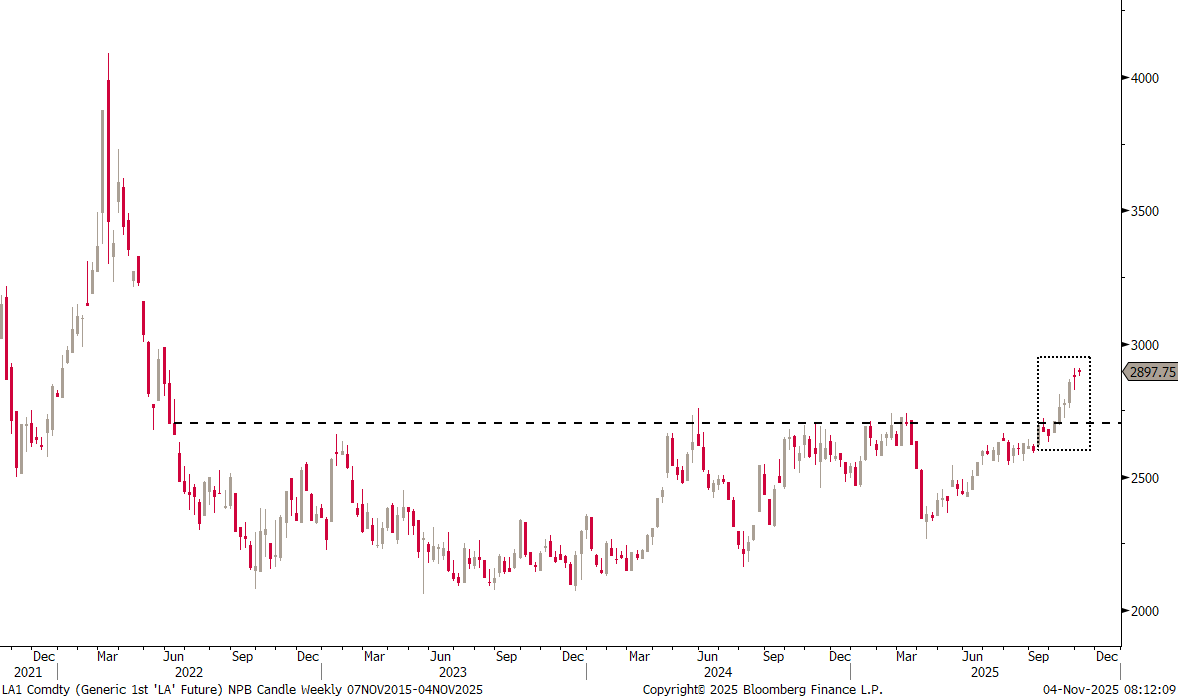
There is not enough time to go into all the other, non-precious metals, as we have delayed this letter into Tuesday already, but I think the (little-talked about) breakout in Aluminium could be worth further investigation:
Alright, that’s all for this week. May the trends be with you!

In reality, you need no other Disclaimer than the one above, but just in case:
Everything in this document is for educational purposes only (FEPO)
Nothing in this document should be considered investment advice
Investing real money can be costly; don’t do stupid shit
Leave politics at the door—markets don’t care.
Past performance is hopefully no indication of future performance
The views expressed in this document may differ from the views published by Neue Private Bank AG