

Stranger Things
Volume V, Issue 169


“Men, it has been well said, think in herds; it will be seen that they go mad in herds, while they only recover their senses slowly, one by one.”
— Charles Mackay, Extraordinary Popular Delusions And The Madness Of Crowds
DASHBOARD

AGENDA

CROSS-ASSET DELIBERATIONS
A bit of a strange session that was yesterday … let’s observe some of these stranger things.
Equity markets were in corrective mode yesterday, which in itself is of course not strange given the substantial advances since about a week ago. On a 15-minute chart of the S&P 500, this has set up some nice short-term “lines in the sand”:

On the downside, a break of 3,950 would complete a shoulder-head-shoulder pattern, with a minimum target at around 3,875. On the upper side, the previous recovery high at 4,025 is the line in the sand, with a break reinstating our target #1 (light green) on the daily chart:

It is important to note, that a break of short-term support or resistance means a measured move of around 2% to 3% only on either side, hence, not huge.
So, maybe here’s Stranger Thing #1: During the prior three sessions to yesterday’s the S&P traded above 4,000, but refused to close above that level. Who’s ‘defending’ that?

Breadth was tilted to the negative side in yesterday’s session, with losers outpacing winners at a ratio of about two-to-one. Nine out of eleven sectors reversed lower on the day:

Here’s the day’s market heat map for the US market (S&P 500):

And in case you think this letter is too US-centric, here’s the heatmap for the STOXX Europe 600 index, although it gets a bit crowded:
Stranger Thing #2 then would be that despite the equity “sell-off”, volatility (VIX) actually contracted:
Admittedly a small contraction, probably due to the “quietness” of the session, but still a contraction.
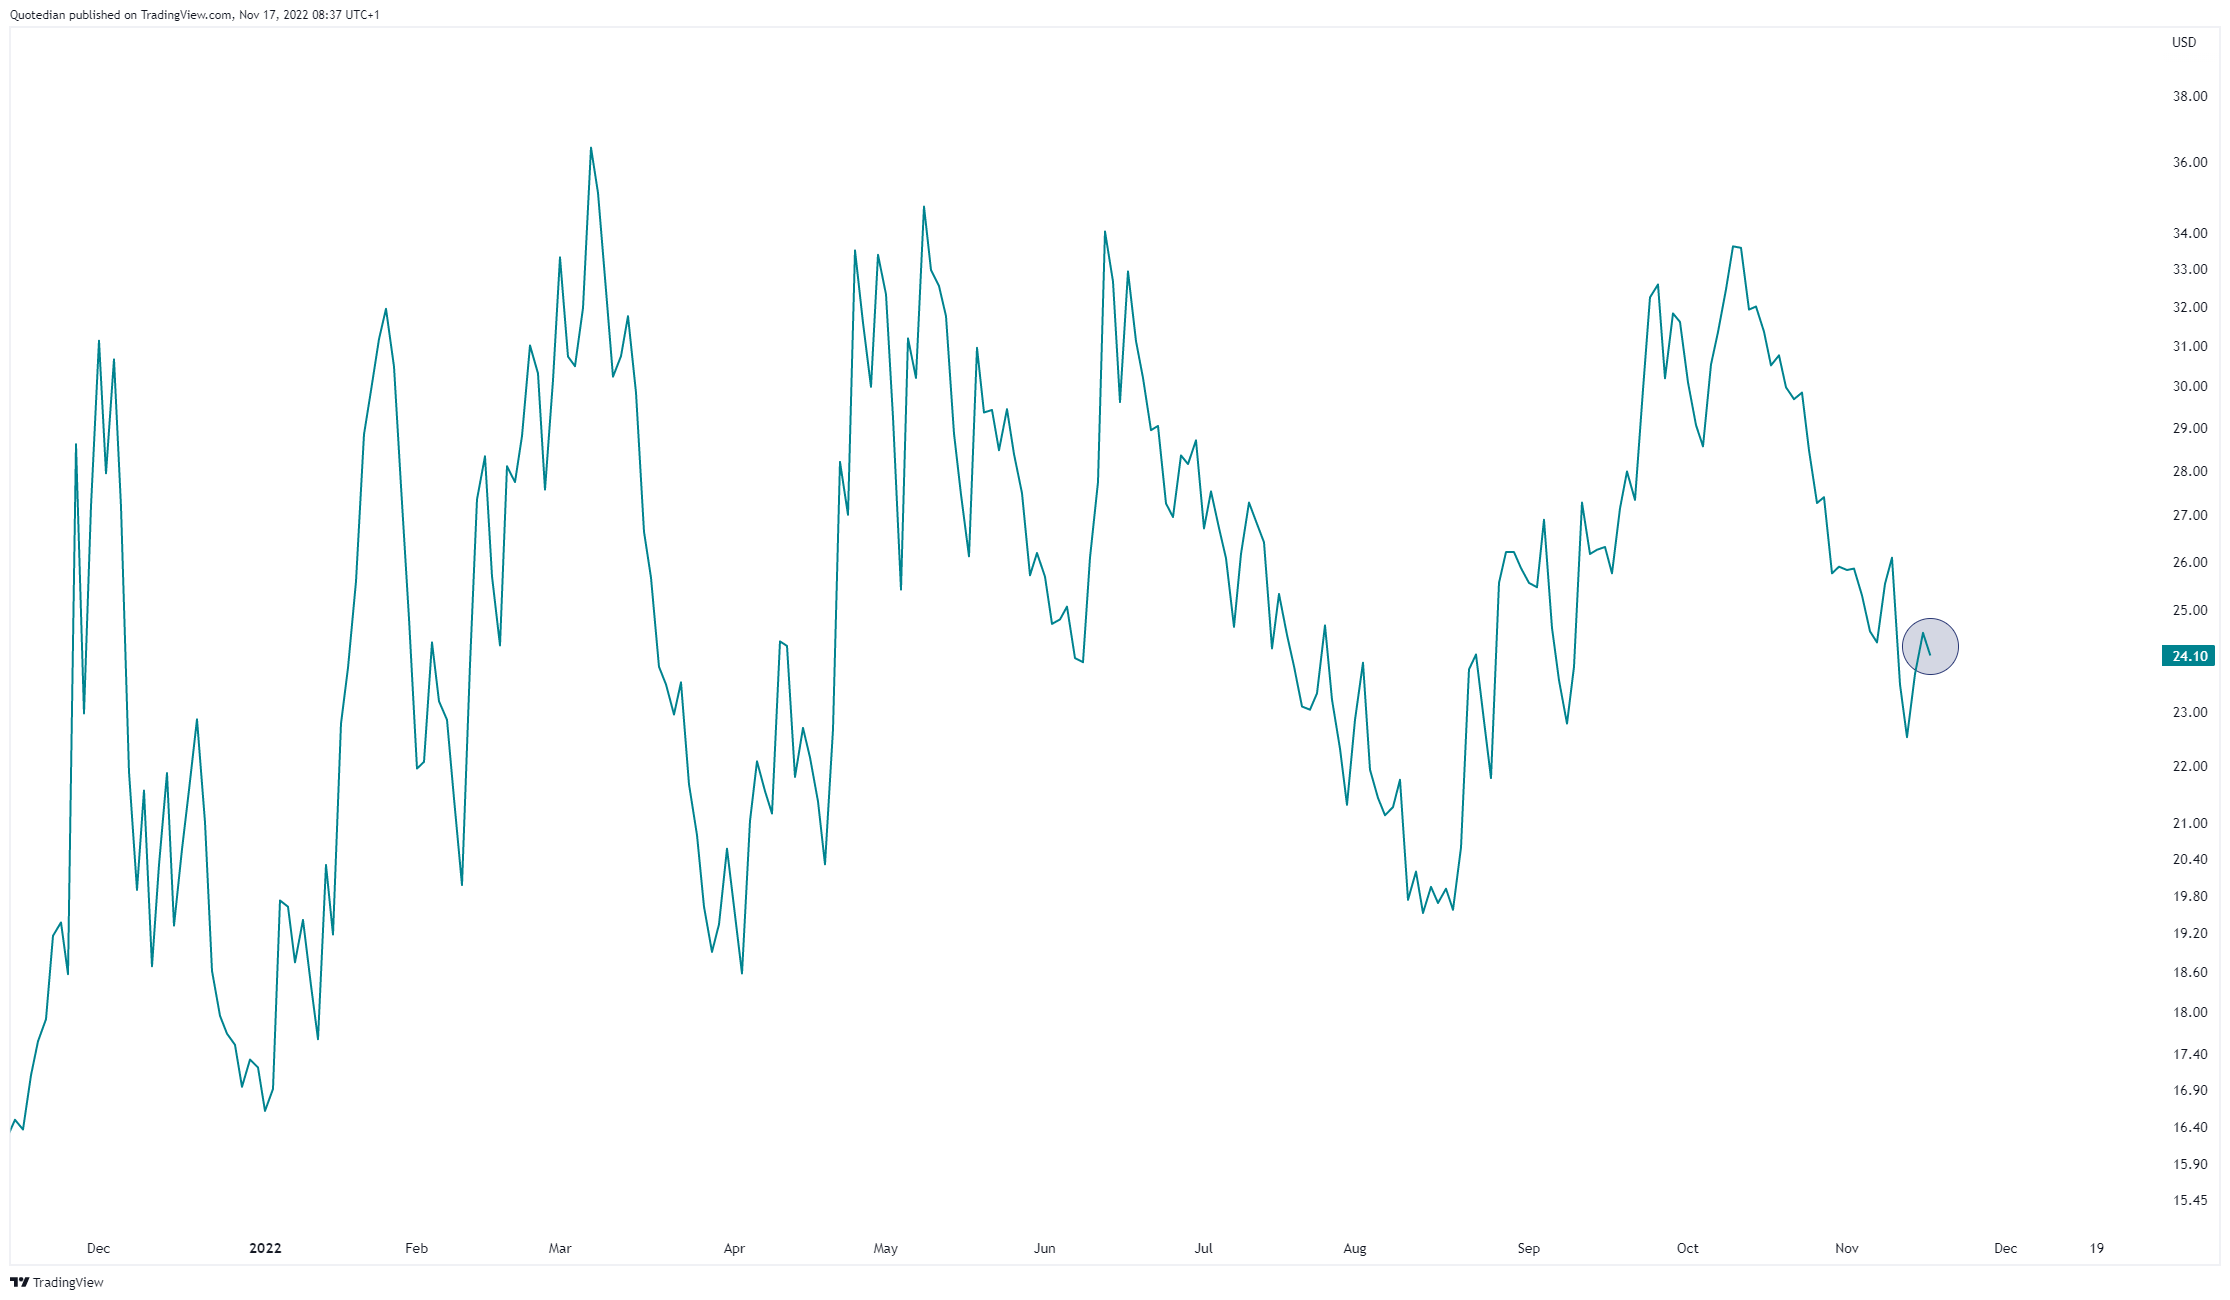
This serves us as a perfect segue into fixed-income markets, where the VIX-equivalent (MOVE) was up for a third consecutive day:

Maybe not yesterday’s move, but the generally elevated level of MOVE, which I think we already discussed a few Quotedians ago, classifies as Stranger Thing #3:

We are talking levels here not seen since the COVID-panic in March 2020, when the fixed-income market basically went into a comatose state until the Fed Frog came to give it its awakening kiss (that choice of words classifies for sure as Stranger Thing #4 🤣🤣) or the GFC before that.
US 10-year yields dropped recession-like by nearly 20 basis points from an early (European) intraday high at around 3.84% to a low at 3.67% before settling down around the 3.7% handle.

That’s quite the move, especially given a slightly inflationary Retail Sales print in the early US session. The level between 3.47 and 3.57 seems to be an immediate target zone for rates on the daily chart:

This brings us to Stranger Thing #5, with 2-year yields actually slightly up during yesterday’s session,
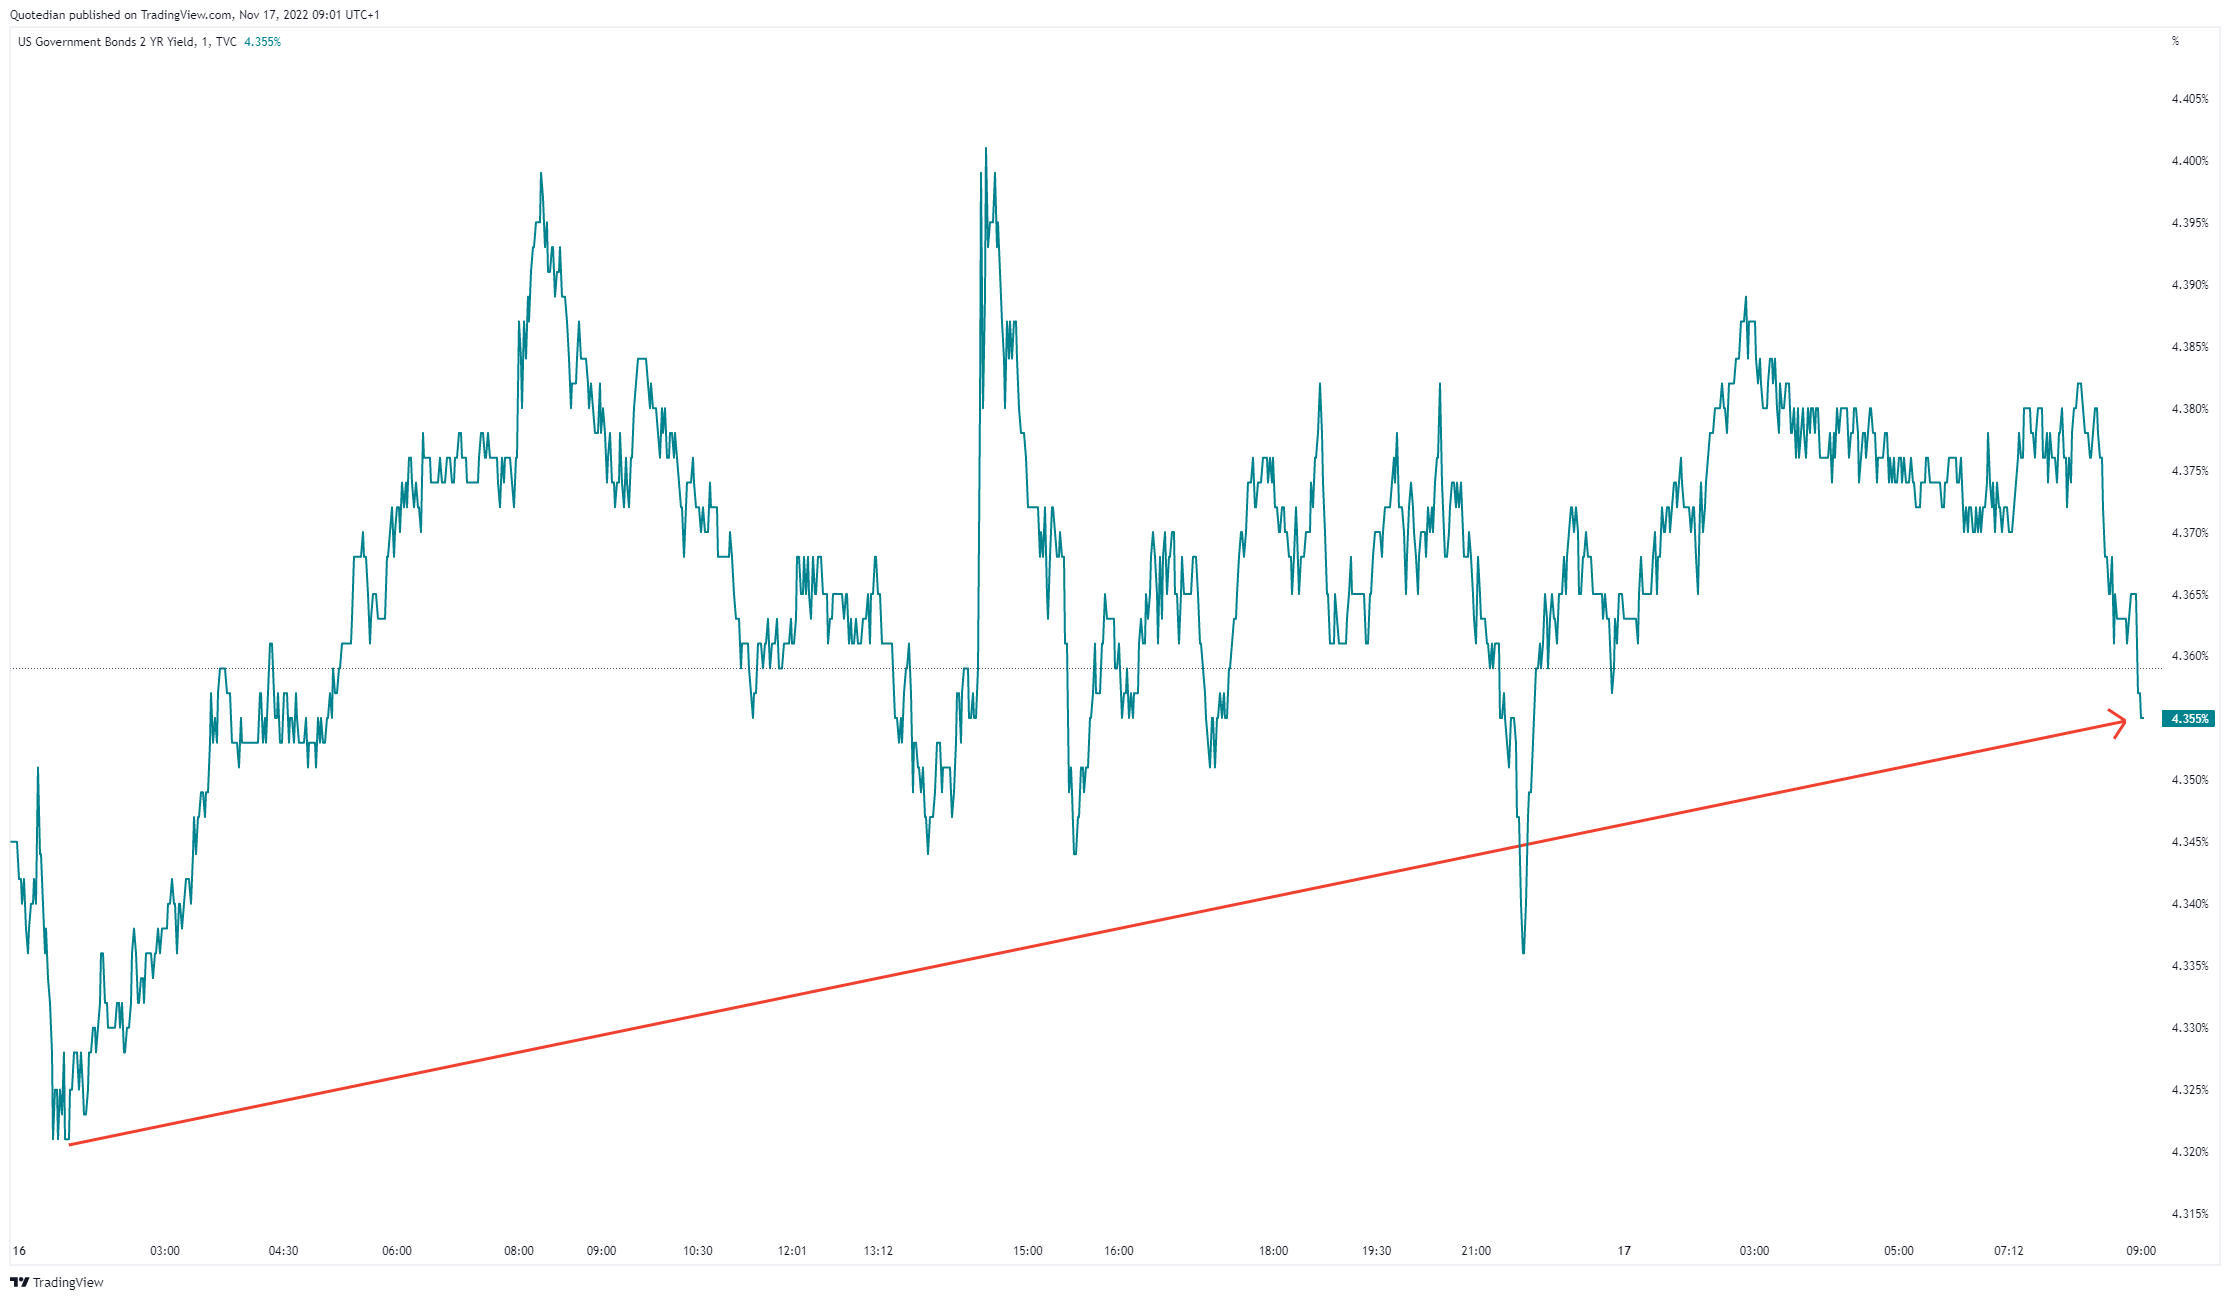
leading directly to Stranger Thing #6, which is the deepest yield curve inversion since 1982 taking place:

In currency markets, the US Dollar seems to have found at least a short-term footing, though the consolidation has been too shallow so far to call it a correction. Here’s the EUR/USD cross for example:

Let me shortcut here today, as it is high time to hit the Send button. However, make sure not to miss out on Stranger Thing #7 in the COTD section below!
Have an ordinary (aka unstrange) Thursday as possible.
André
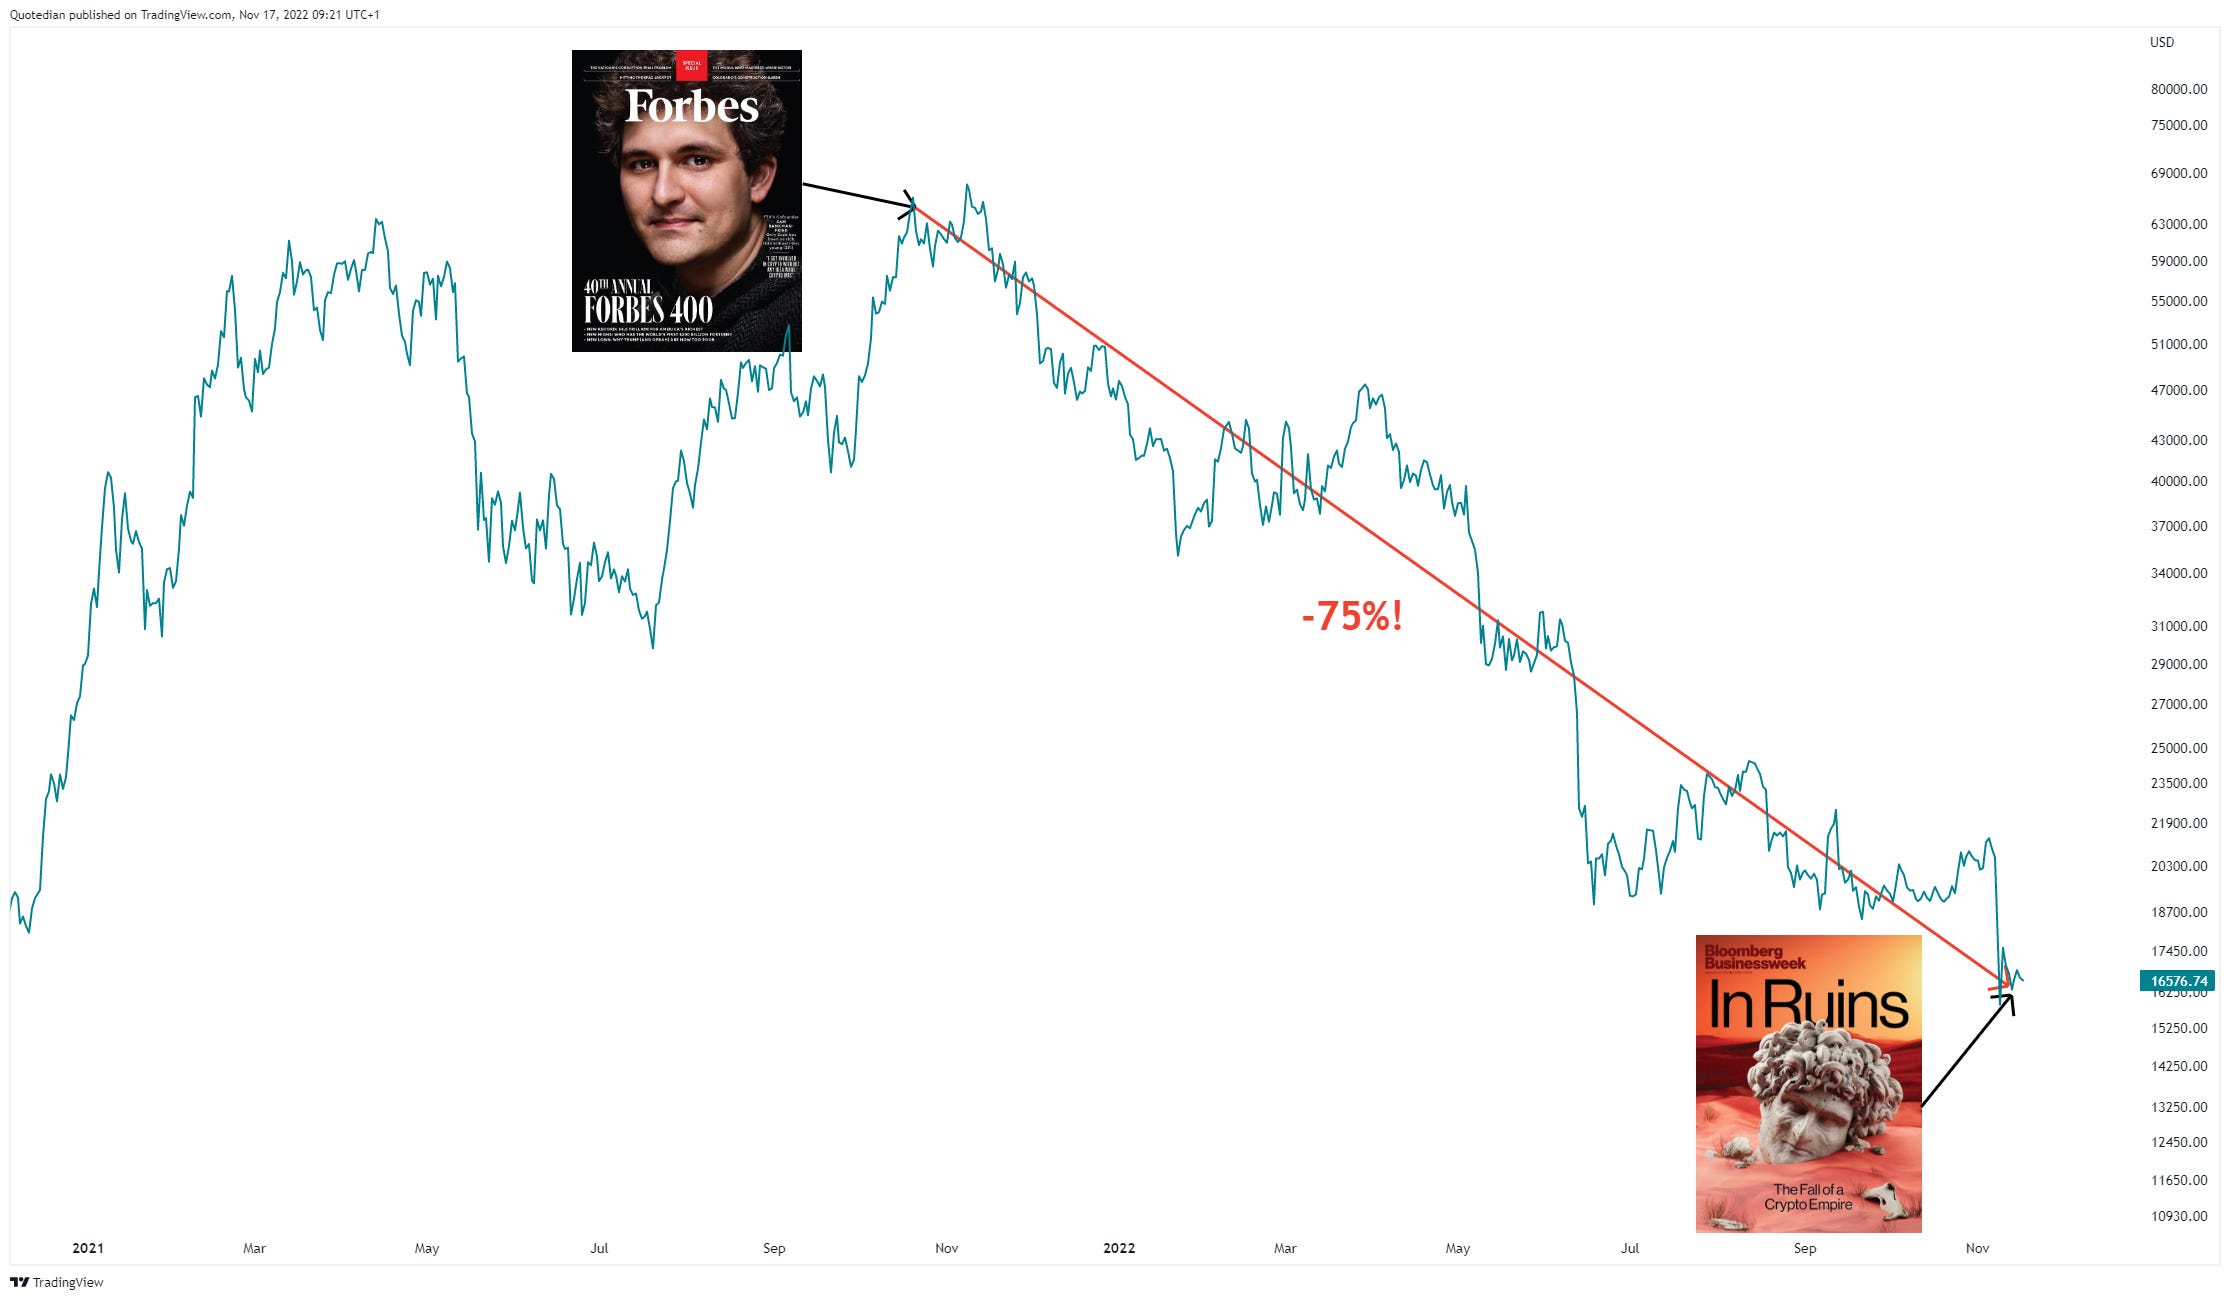
CHART OF THE DAY
In the crypto space, or whatever is left over of it, Bitcoin seems to have stopped the bleeding for now. And given our Magazine Frontcover story contrarian indicator (remember the recent USD sell signal?) maybe there’s even some upside juice to be had in Bitcoin?
Stranger Thing? Or maybe not …
Thanks for reading The Quotedian! Subscribe for free to receive new posts and support my work.
DISCLAIMER
Everything in this document is for educational purposes only (FEPO)
Nothing in this document should be considered investment advice
Past performance is hopefully no indication of future performance