Technical Issues
Volume V, Issue 171
“The computer was born to solve problems that did not exist before.”
— Bill Gates
“A computer once beat me at chess, but itw as no match for me at kick boxing.”
— Emo Philips
DASHBOARD
AGENDA
CROSS-ASSET DELIBERATIONS
**Housekeeping **
Unfortunately, I had some technical issues on Sunday, which kept me from sending out the weekly wrap-up edition of the Quotedian. Also, the technical issue is not quite sorted yet, so some of the usual tables and stats will look a bit different until sorted. But hey, as Winston Churchill said: “Never let a good crisis go to waste” and in that spirit, I will be overhauling some segments of The Quotedian.
Also, this week, which is a shortened week in the US due to Thanksgiving break, hence, I will be publishing dependent on market ‘excitement’, i.e. in a tranquil market environment, we may skip the Thursday and/or Friday issues. You have been warned 😉
Already in Monday’s session, one could tell, at least by turnover, that we are in one of the more festive weeks for the US market, with total market volume around 30% below the average of the past 30-days.
Indices themselves closed down somewhat, with the biggest ‘drop’ amongst the bellwether benchmarks registered on the Nasdaq (-1%). The day’s sequence was down-up-down, with the ‘up’ provided by dovish comments from FOMC member Mary Daly, who spoke in favour of a rate hike slowdown:
Overall, the S&P 500 daily chart is one of indecision over the past two sessions (black circle):
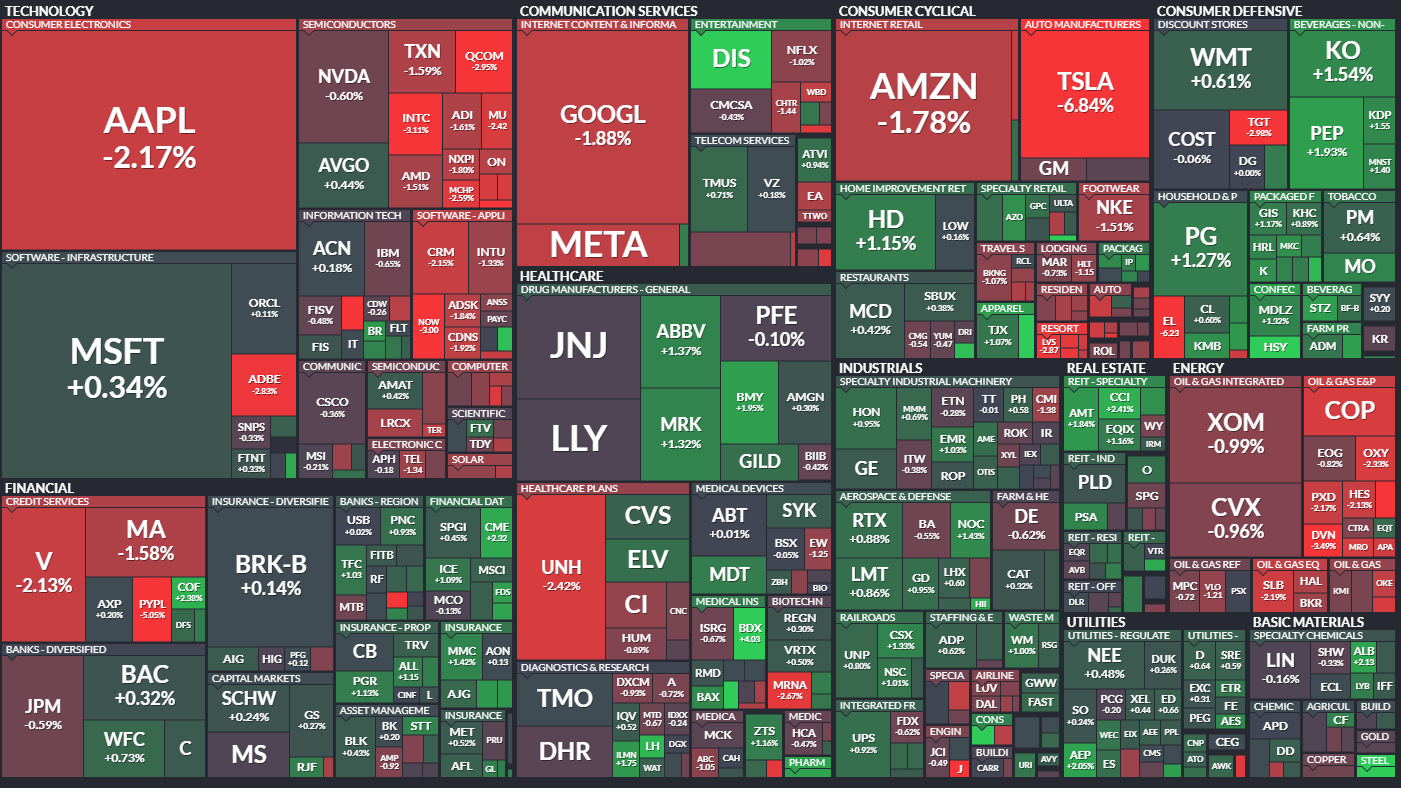
This is also visible in breadth data, with actually more stocks up than down on a negative day, which is also an indication that some of the larger cap stocks were under pressure:
Also, more sectors (7) were up than down (4):
Going through my chart set in trying to prepare a new one, I tumbled over this one, which I must have shared towards the end of October:
It shows an inverted shoulder-head-shoulder pattern, with the S&P after breaking the neckline (black) rising right into our target zone (green arrows) and since then stalling. Beautiful!
Also interesting, is that since reaching this target zone, the S&P has stopped to rise, whilst the VIX has continued to fall (rise on the inverted chart below):
Despite all the relative “quietness” in the overall market, a lot of stocks were actually on the move, let me highlight just a few:
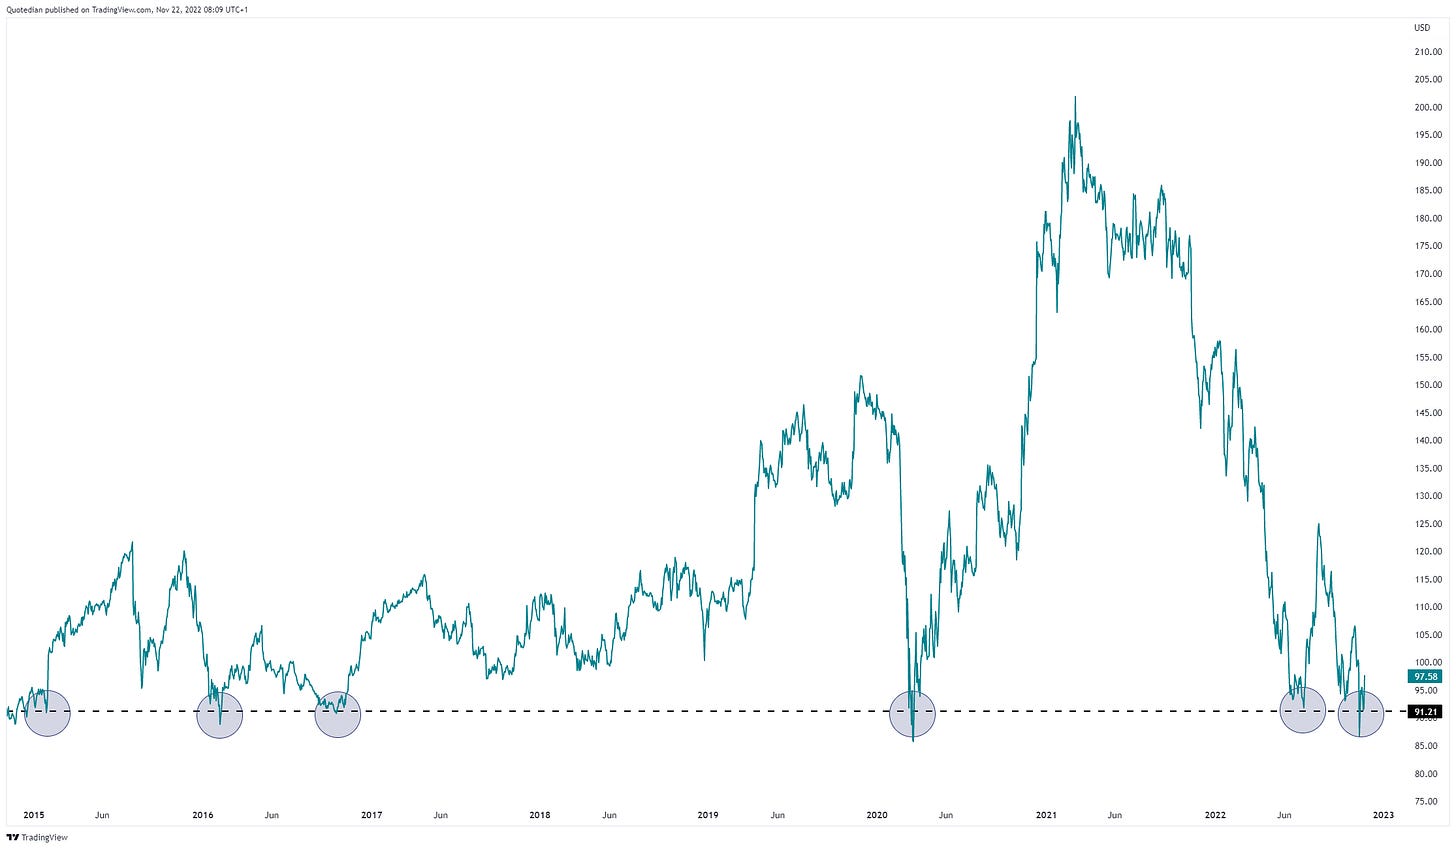
Disney — The company reinstated its old long-time CEO Bob Iger as new CEO, paying him a juice USD27 million per year for the next two years. It seems that $90 is the lowest share price the company’s board is willed to accept:
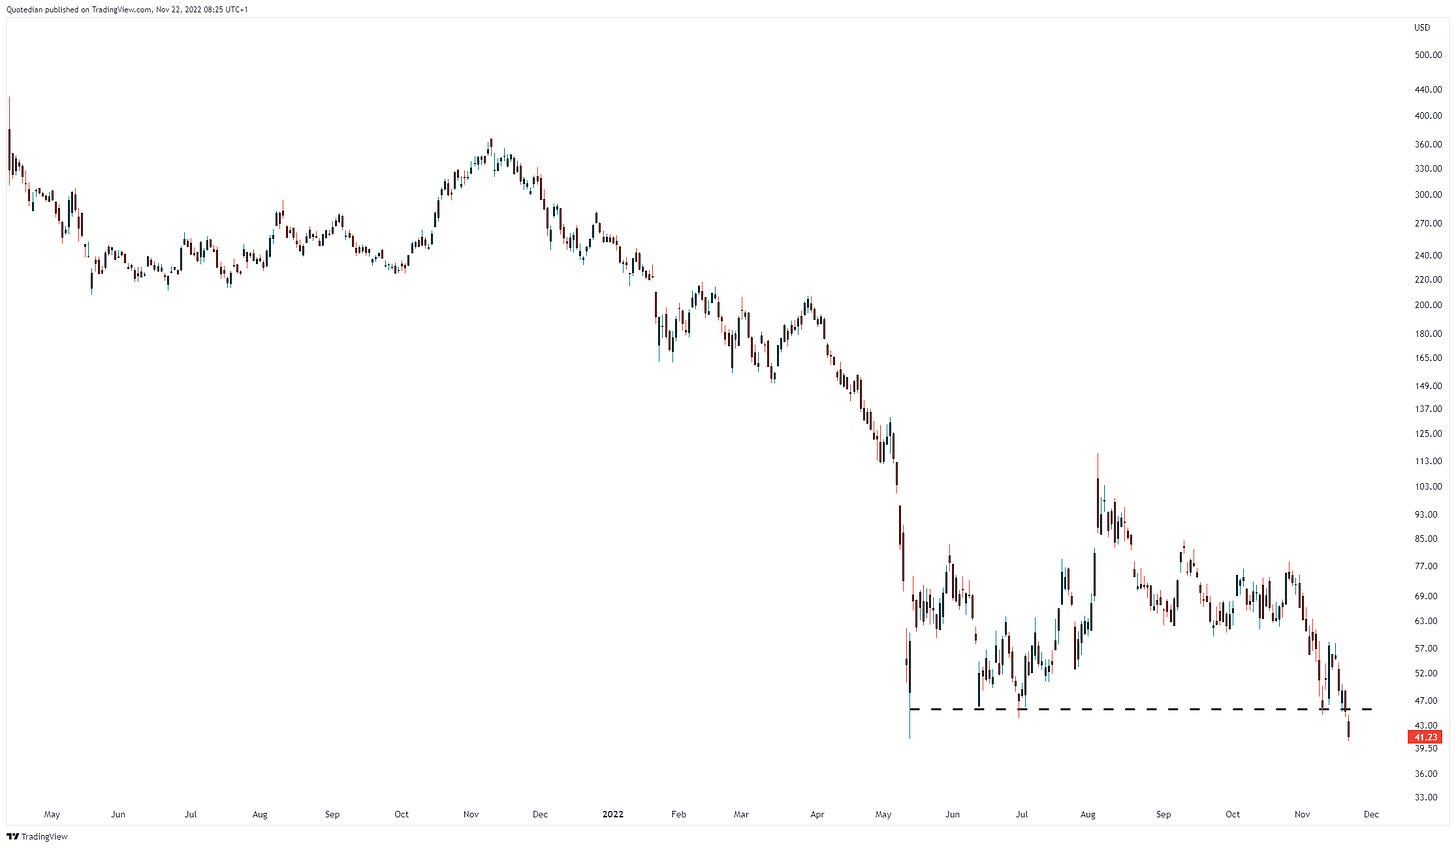
Another stock making topping the charts (inverted pun intended) is Tesla, where it looks like that Twitter may not be Elon’s biggest headache:
Major support at $180 has given yesterday, and the next stop could be as low as around $120-ish. While on the log-scale chart above the move so far may only seem half brutal, here is what it means in terms of the company’s market cap:
That’s about 15x the price recently paid for taking Twitter private …
Finally, another stock, called Coinbase, with some obvious connections to the crypto scene, is somewhat unsurprisingly also in free fall, with a target price probably somewhere around zero:
This Tuesday morning, most major indices are printing green, with the notable exception of Hong Kong stocks, where some profit-taking seems to be taking place after a recent 25% rally.
Though some uncertainty for both, China Mainland and Hong Kong stocks, has come after a recent rise in COVID cases, including some COVID deaths. Here’s a cases chart for China:
In fixed-income markets, one could physically hear here in Luxembourg the collective sigh of relief coming out of the ECB headquarter over in Frankfurt has Germany’s PPI finally gave a negative month-on-month reading:
I am not sure though if that is really a relief on the year-on-year chart:
In any case, the bond market ‘celebrated’ by taking the yield curve (10y-2y) negative, which is a first in quite a while:
Which brings us to the US bond market, where the yield curve AND the leading economic indicator index (LEI) are giving recession signals, as this very instructive chart from the fine chaps at BCA Research shows:
We will have a deeper dive regarding inversion and timing of recession and stock market performance in a future Quotedian, but basically, the ‘fun’ happens once the curve starts steepening again.
Also, something I meant (and still mean) to write about is the vanishing liquidity in global treasury markets. Here’s a teaser:
One more regarding fixed-income markets, this time on the credit side of risk … credit spreads (HY in the chart below) have been contracting pretty strongly since September:
The question would be, still time to load up on High Yield papers? Or, last chance to hedge before next year’s recession?
Over in currency markets, the US Dollar is having a bounce, which last week we said could take the EUR/USD cross back down to parity, but probably not much further:
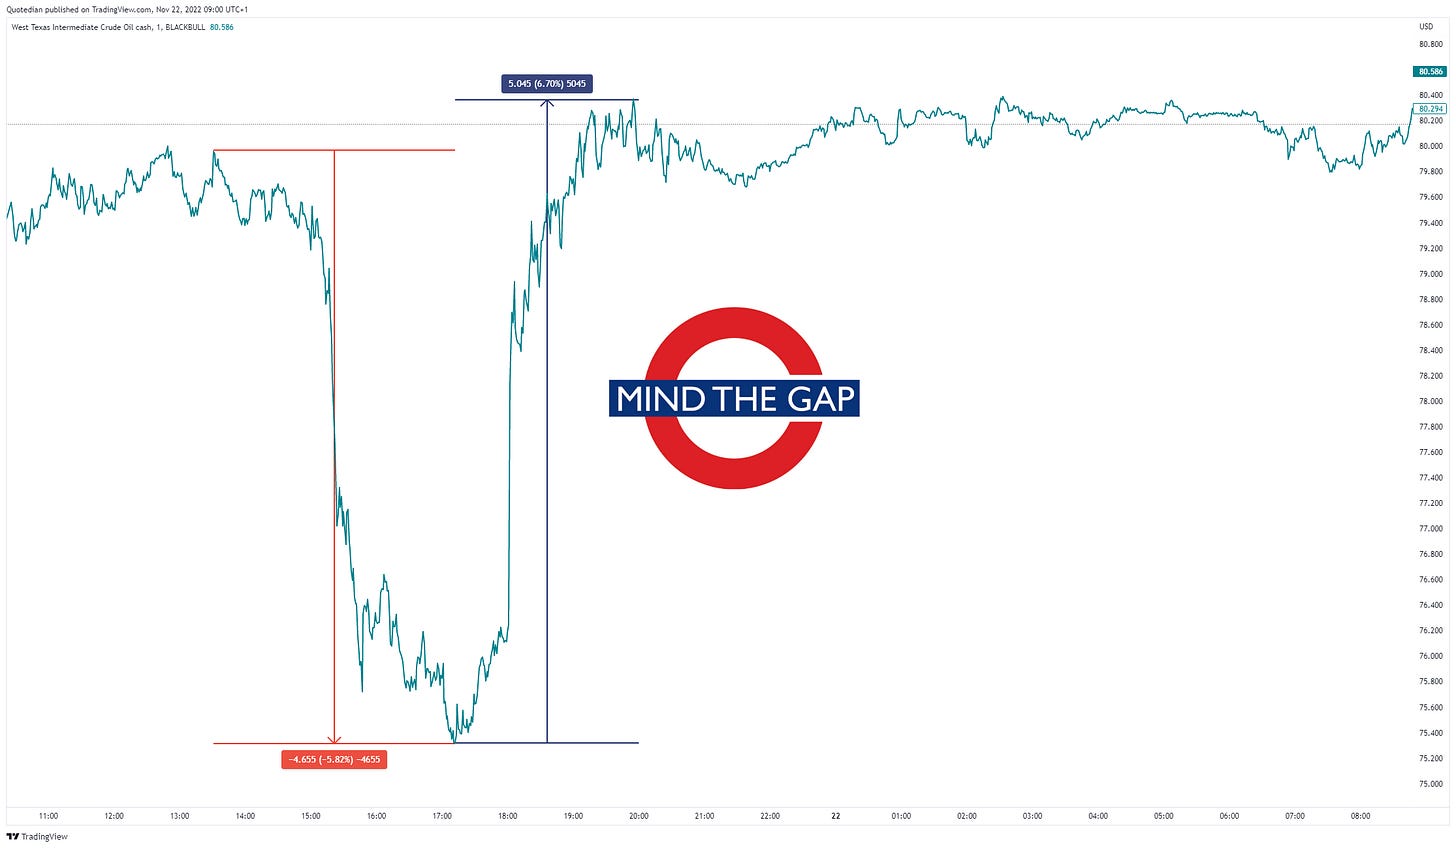
And finally, in the commodity space, oil was the talk of the town over the past hours, where the combination of a (now denied) rumour of OPEC+ output boost together with rising China-COVID cases created one of the largest hammer candles on the oil chart in a while:
This is what yesterday (and today) look like on an intraday chart:
Time has come to hit the Send button. Have a great Tuesday and make sure to check back in tomorrow!
André
CHART OF THE DAY
Last night a Bloomberg headline read:
Which reminded me of a chart I had shown last week. It showed the recent S&P 500 rally and how the GS most shorted index did NOT participate in that rally, i.e. no short squeeze. Adding to the same chart now the MEME ETF (yes, it contains what is written on the tin and yes, it is sad it even exists), we see that MEME stocks also neglected to participate.
Hhhmmm, stay tuned …
Thanks for reading The Quotedian! Subscribe for free to receive new posts and support my work.
DISCLAIMER
Everything in this document is for educational purposes only (FEPO)
Nothing in this document should be considered investment advice
Past performance is hopefully no indication of future performance


