The Crash
The Quotedian - Vol VI, Issue 84 | Powered by NPB Neue Privat Bank AG
“The only thing worse than being blind is having sight but no vision.”
— Hellen Keller
The crash is here! Yes, yes.
No, not tomorrow, not next week, but rather it has already happened!
Don’t believe me? Here it is:
Down nearly 43% in just about a month's time - I think that qualifies as a crash. The down move showed even the classical Elliott Wave Theory five waves impulsive pattern:
And, of course, we are talking about the crash in the CBOE S&P 500 Volatility Index, better known as the VIX index.
As a matter of fact, it crashed so hard that it touched its lowest level since January 2020!
And that’s quite a while ago and obviously was only about a month away from the COVID-spike (not that we think the same will happen again now!).
The VIX crashed! What now? We know, contact us!
Contact us at ahuwiler@npb-bank.ch
So, why did the VIX hit its lowest level in nearly four years with so much to worry about? Well, that’s exactly why! The worries have not materialized and Mr Market is taking note.
Let’s look at the Wall of Worry from another angle. Let’s call it the Thanksgiving-angle.
We give thanks, that
The war in Ukraine/Russia has not gone nuclear
No escalation of the Israel/Hamas conflict
the recession keeps getting postponed
no further major bankruptcy has come through after the banking crisis of March
earnings have held up
Santa is just around the corner
These gradual “improvements” are pushing investors back in the risk-on mode and that is what counts!
Today’s letter will be a bit shorter, as a) the megalodon end-of-month letter is due on Friday and b) it has been bloody quiet on most financial markets over the past week.
As mentioned just a second ago, it has been eerily quiet on equity markets over the past five sessions:
The Nasdaq suffered a similar fate during this Thanksgiving holiday period:
Remember, never short a dull market and indeed it seems as if markets are re-energizing for the Santa rally due later in December.
This latter index (NDX) is less than four percent away from a new all-time high:
Already up 46% this year, will the index make it the 50% mark and reach a new-all time high still this year - or do we really have to wait for January?
Over in Europe, we usually look at the Euro STOXX 50 (SX5E) or the Europe STOXX 600 (SXXP) indices, but today, let’s have a look at some if its regional components.
Starting with the DAX for example, we note that the November rally has nothing to envy over its US cousins and for some strange reason, this index is only three(!) percent away from a new ALL. TIME. HIGH.
In France, the CAC-40’s rally has been slightly more muted and the index has also still more distance to cover to a new ATH:
I suspect that this index is dearly missing the upside participation of one of its most important components - LVMH:
That is not a bullish chart - don’t fish.
But dear French investors, fret not, it could be worse - you could have been invested in Swiss stocks. Here’s the SMI, looking rather unhealthy:
In all fairness, most index members are up year-to-date and some even quite decently so, but some of the heavy swingers (Nestle, Roche) are dragging the performance notably this year:
Finally, time to check what our friends from the small island up north have been upto lately:
I wish I could make that chart look more interesting, but I can’t …
For an interesting chart, let’s turn to the stock market chart of a country that stands close to the just observed English market … Argentina’s MERVAL:
Now that’s what I call market action! Never a dull day at the office, since the wig was elected, as the following chart of day percentage movement of the index demonstrates:
Check out the right-hand percentage scale on that chart …
Ok, time to wrap up the equity section here and rush through the remain asset classes.
In the interest rates sphere, the US 10-year yield is getting hammered crashing:
This downward trend further accelerated yesterday (28.11.), as some of the recently most hawkish FOMC members made dovish statements:
Christopher Waller said policy is well positioned to return inflation to the Fed’s 2% target
Michelle Bowman refrained from telegraphing an imminent hike
Lower yields translate of course to an extension of the bond rally. Here’s the popular US bond ETF TLT:
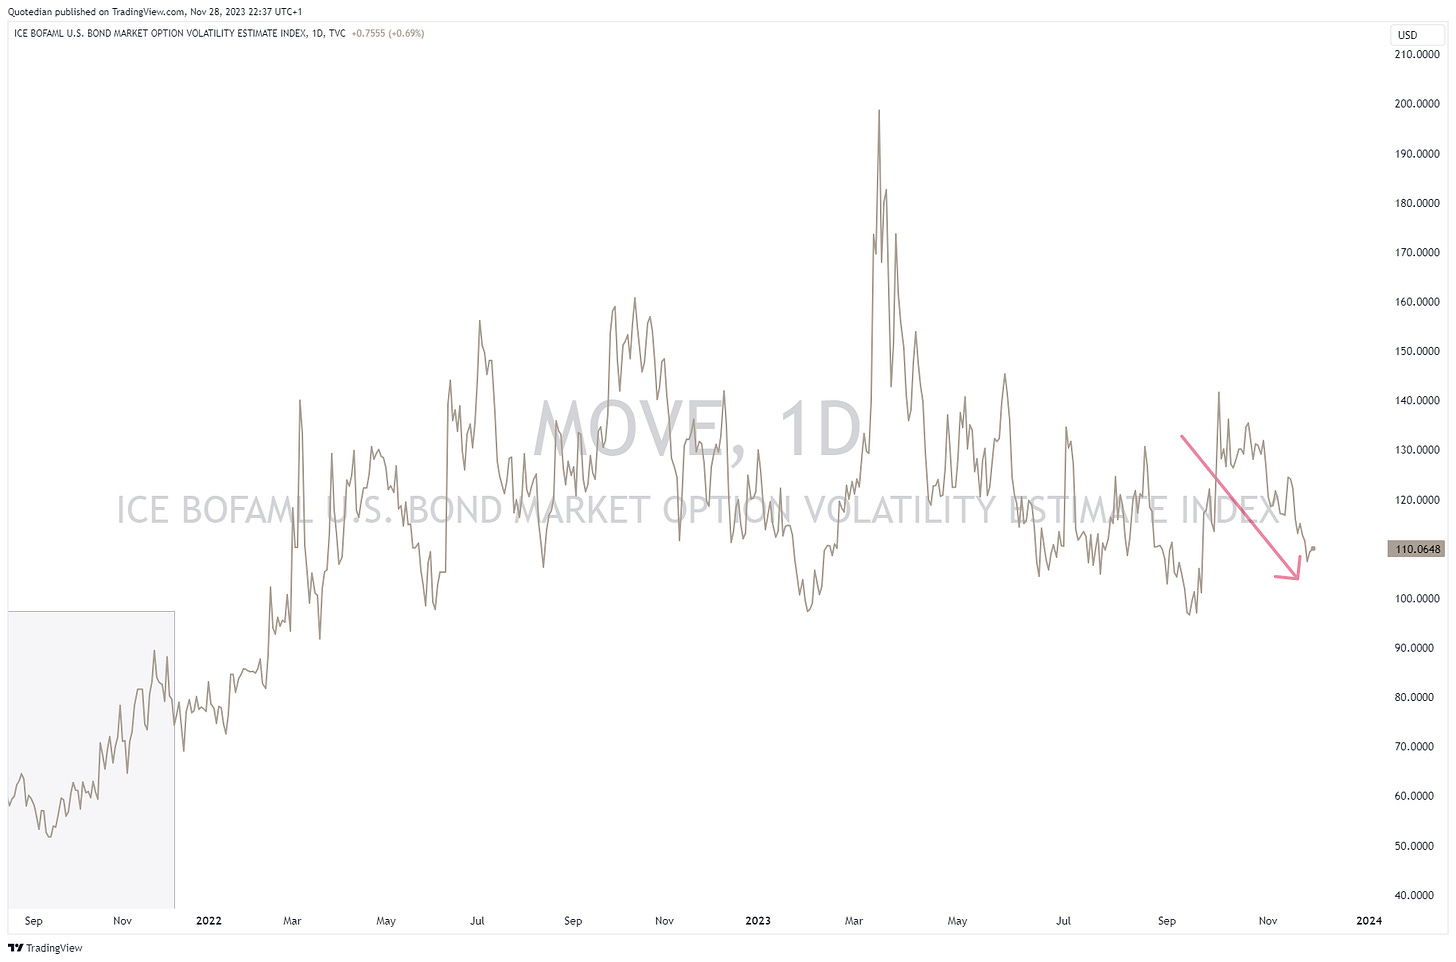
Accordingly, the MOVE, the bond market’s VIX equivalent is also coming down (albeit not crashingly so):
Another market nearly “crashing” and hence supporting the rally in risky assets, is the US Dollar. Here’s the Dixie:
Which translates into the EUR/USD cross trading around the 1.10 level again:
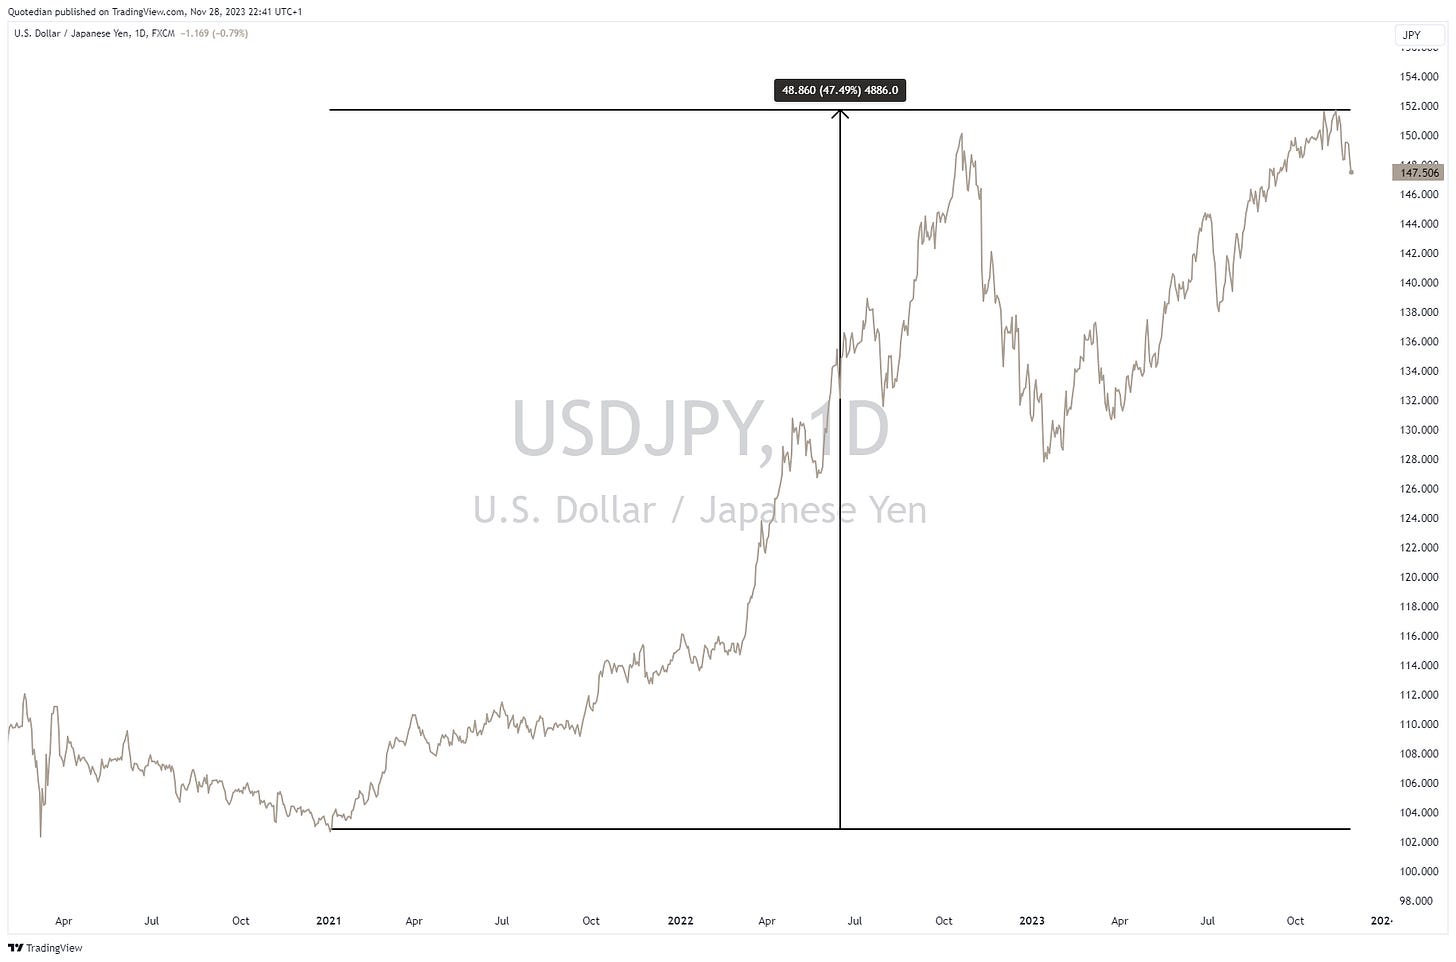
But the most intriguing chart remains the USD/JPY, where it seems the snowball for a higher Yen (lower USD/JPY on this chart) has finally started getting rolling:
Especially if considering where we came from:
Keep the USD short / long JPY trade on for now.
Finally, in the commodity space, only one chart nobody is talking about:
Gold!
Only a few bucks from a new all-time high and it seems nobody cares. Breakout potential!
Ok, time to hit the send button. Make sure to check your inbox on Friday or over the weekend for the end-of-month edition with all the fine stats and monthly charts.
Be safe,
André
The news of the death of Warren Buffett’s sidekick, Charlie Munger (99), hit the headlines just as the Quotedian was sent off to the printing press, but we had time to add this little tribute in the COTD section. After all, we are the QUOTEdian:
RIP Charlie.
Everything in this document is for educational purposes only (FEPO)
Nothing in this document should be considered investment advice
The views expressed in this document may differ from the views published by Neue Private Bank AG
Past performance is hopefully no indication of future performance


