The ECB and the Curve - A Fairy Tale
The Quotedian - Vol V, Issue 123
“An empty vessel makes the loudest sound, so they that have the least wit are the greatest babblers.”
— Plato
DASHBOARD
AGENDA
CROSS-ASSET DELIBERATIONS
Disclaimer: Of course, today’s “‘Quote of the Day'“ is entirely fictitious, not based on any real-life persons or institutions and above all has nothing to do with the bollocks coming out of central bankers’ mouths over recent years.
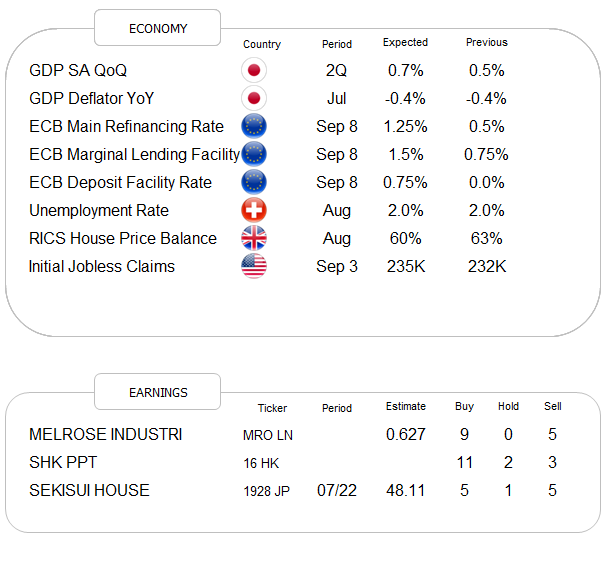
With that out of the way, it is time to look forward to today’s ECB meeting, where Europe’s central bank is likely to lift its key interest rate to a staggering +0.75% (make sure to pay special attention to the arithmetic sign just before the number) after a full decade of ZIRP and NIRP. Conceptually, this looks as follows:
With real data, like this:
Shameful. I rest my case, your honour.
Anyway, on with yesterday’s market review and some further thoughts …
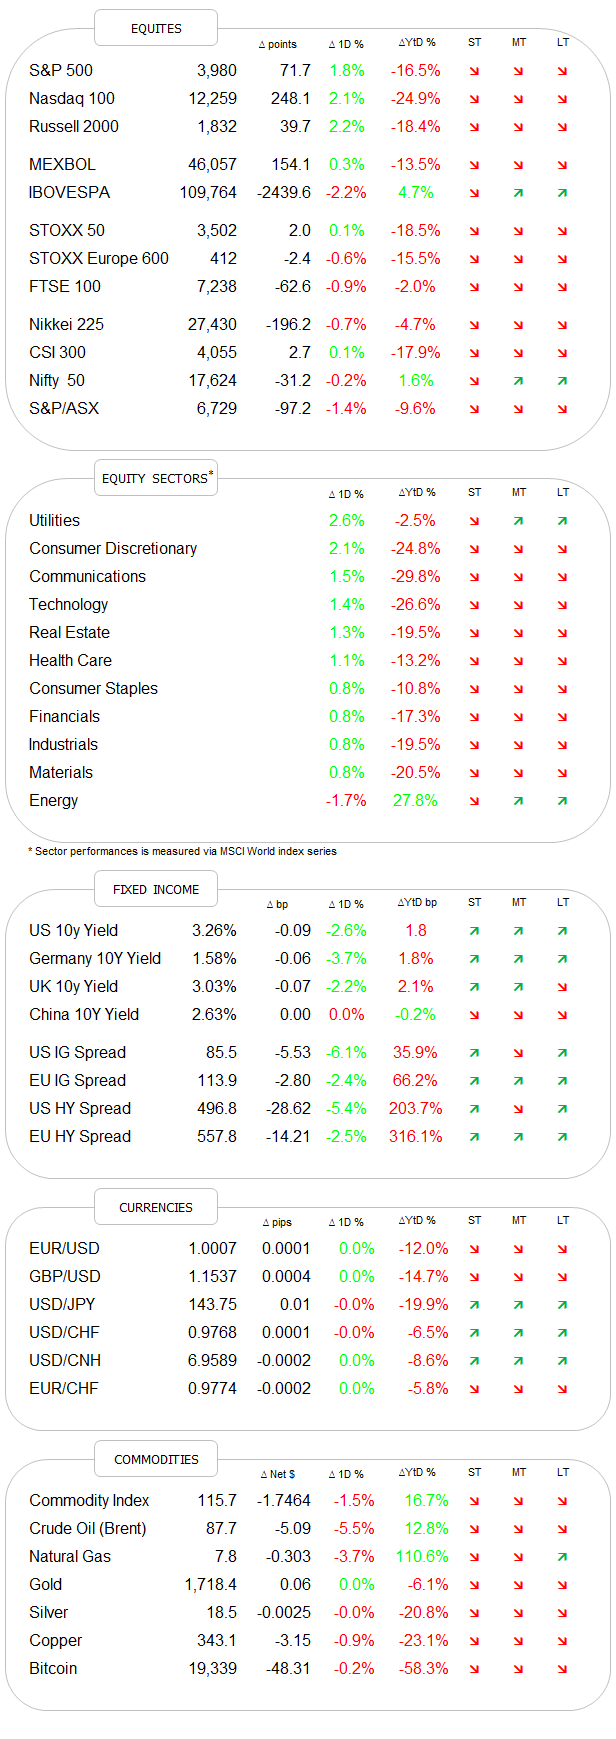
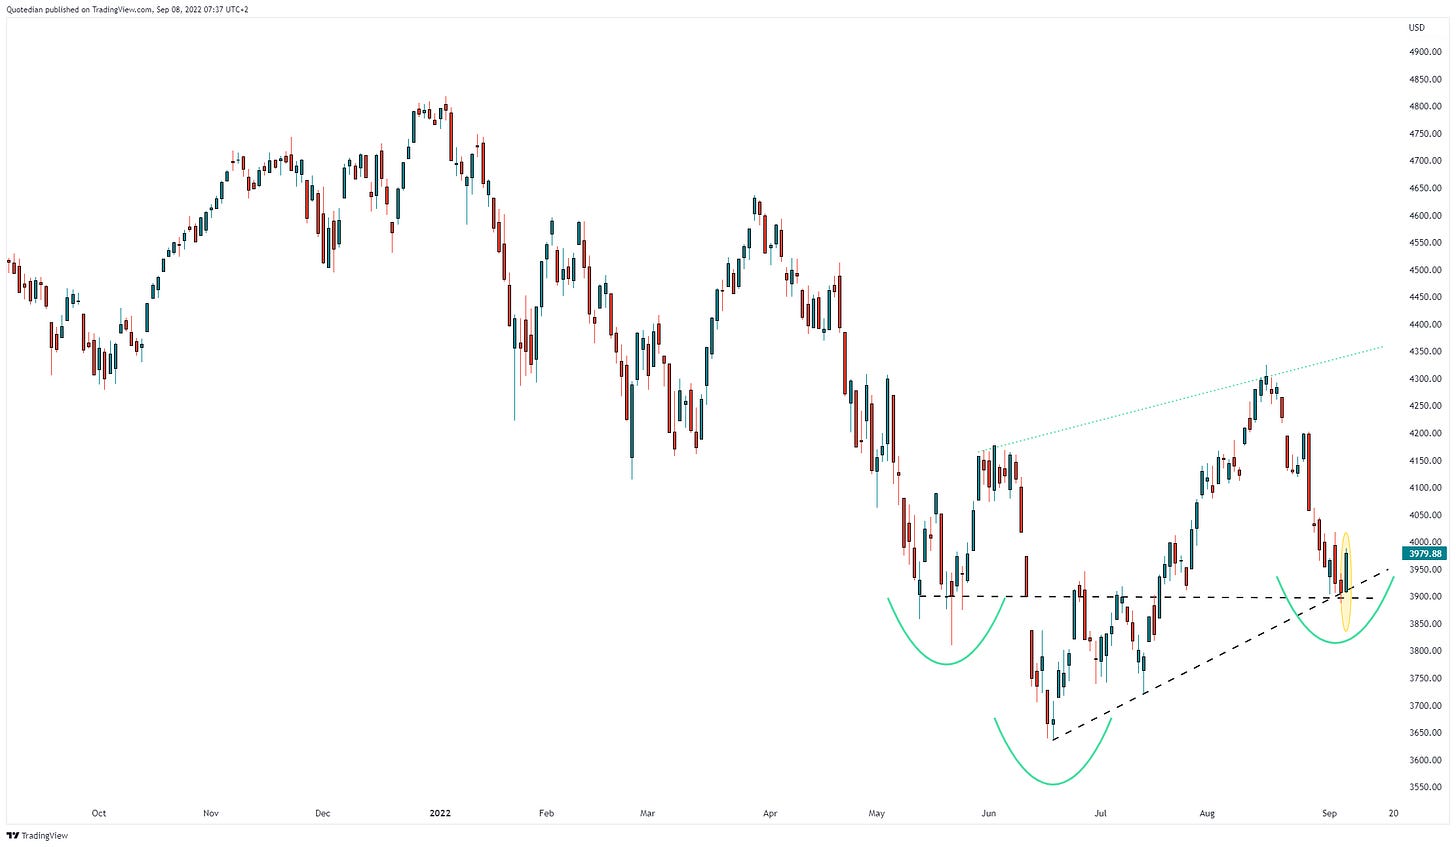
It seems the market participants all got around to read yesterday’s “The Quotedian” and decided that the chart we showed arguing for a possible rebound at current levels made sense and hence started a collective buying spree.
Either that or a sharply falling oil price leading to sharply lower inflation expectations leading to sharply lower bond yields leading to sharply weaker Dollar motivated bargain hunters to show up … (you will see below, “sharply” has lost some of its thunder)
Whatever the reason, once the stone got rolling in one direction, negative dealer gamma started to kick in, obliging hedgers to buy more and more into an already rising market. The result was a constantly ascending equity market, with the S&P 500 not looking back throughout the entire session, ending up nearly two percent higher:
I will show sector performance in a table below, but the S&P’s market carpet serves as a major spoiler right before that:
Maybe the only surprise comes in form of Utilities being the best performing sector, but then given the rally in bonds (sell-off in yields) not so much really:
The other sector standing out above is of course energy stocks, where the following observation seems warranted:
The gap between energy prices (WTI - green) and energy stocks (XLE - blue) has widened and is likely to close over the coming weeks. This would probably mean another entry point for investors seeking long-term energy stock exposure laying ahead…
Asian markets got only partially infected this morning by the buoyant mood on Wall Street yesterday evening, with Japan’s Nikkei up a decent two percent (don’t forget the weak Yen factor), but the China mainland and Hong Kong stocks lower. European and US index futures are all suggesting a continued rally at today’s opening of cash trading.
Continuing with a look at bond markets, we see here the fore-mentioned dip in yields illustrated:
As a matter of fact, really much ado about nothing for now, but the small downtick seemed to be enough to awaken animal spirits in equity markets, which of course means that we are still far away from capitulation and hence a longer-term bottom…. sigh …
Similarly, the US Dollar corrected, but I would argue that on a longer-term chart, that does not really count (for now):
However, there is some point to be made that the correction in the commodity space is continuing and is on the brink of turning into an outright bear market. Not only is a commodity basket, hereby proxied via the Invesco DB Commodity ETF (DBC), down 20% from its June peak, but it is also on the brink of breaking key support AND is already trading below its 200-day moving average for the first time since November 2020:
Let’s keep a close eye on this.
As ever, it is getting late and it is time to hit the send button!
Enjoy ýour Thursday, enjoy the ECB, and have a drink after both!
André
CHART OF THE DAY
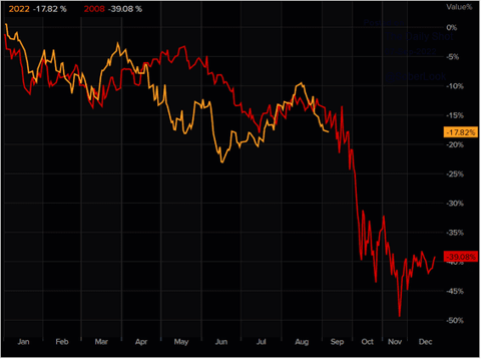
One swallow does not make a summer and one day up on equities does not make a bull market. On the contrary, many market participants are still comparing the current market (orange) to the 2008-2009 sell-off (red), which looks as follows:
Do I agree? Not really, too neat to happen and too many times I saw these parallels break down. But I can probably warm up to following chart:
But first and foremost, always remember, money managers are paid to adapt, not to forecast ;-)
Thanks for reading The Quotedian! Subscribe for free to receive new posts and support my work.
DISCLAIMER
Everything in this document is for educational purposes only (FEPO)
Nothing in this document should be considered investment advice
Past performance is hopefully no indication of future performance


