

The Month that was
The Quotedian - Vol V, Issue 118

“At the bottom, stocks will be cheap and no one will care.”
— Bob Farrell
DASHBOARD

AGENDA

CROSS-ASSET DELIBERATIONS
Today’s letter will print probably substantially longer than the average one, but fret not, as most of it will be nice, colourful pictures as we walk through the monthly and year-to-date performance data and also have a look at some very looooong-term monthly candlestick charts. As a reminder for long-time Quotedian readers and an introduction to newer members, the thick bars on the following statistical graphs are the one-month percentage performance, whilst the thinner bars represent the year-to-date percentage performance of the underlying instrument. All tables are sorted by monthly performance, largest to smallest. Let’s dive right in then!
Starting our monthly review with equities, August was a tale of two stories, with quite precisely the first half of the month showing some solid gains for stocks, whilst during the second half, they gave back all those gains and then some, with losses accelerating in the last four sessions. Hence, most global equity benchmark indices, bar a few notable exceptions (e.g. Brazil, India) built on their year-to-date losses in August:
On the monthly candle chart (each candle represents one month), the S&P remains both, firmly in a multi-year (secular) uptrend and a multi-month (cyclical) correction thereof. The target and danger zone for the current correction seems to be around 3,200 - a break of that (not a prediction, but a possibility) would turn the cyclical bear into a secular one.

For European stocks, 400 on the STOXX Europe index (SXXP) seems to be an important pivot point, with a break below increasing the likelihood of a secular bear:

The Nikkei 225 looks comparatively more bullish

as long as you look at it in Yen. When taking the view of an unhedged foreign currency investor (e.g. USD) the most recent development looks less bullish, with key support under threat:

Turning to equity sectors, 2022 remains a year where there is one sector to rule them all:
The crazy thing is when comparing energy stocks (ETF: XLE) to technology stocks (ETF: XLK), in relative terms, there is potentially still so more upside to be had:

Fixed income markets once again offered no shelter during the equity sell-off in August. Quite to the contrary, with the exception of Asian FI, where news has been so bad for so long that investors have grown extra-thick skin, a combination of widening credit spreads and renewed pick up in yields hurt sent most bond benchmarks lower gain, building further on the YTD losses:
The “chart of truth” says it all and there is little or no denying that markets have entered a new era:

Same for European yields, here proxied via the German 10-year Bund:

Ok, time to have a look at currencies, where the US Dollar simply continues to be the least dirty shirt amongst all of them. The following table shows global currencies performances versus the greenback:
Of course there’s the Brazilian Real having a day (year) in the sun, but we should not forget that for now this is still only a consolidation for the BRL within the long-term downtrend:

Looking at the following chart, would you be a buyer or a seller?
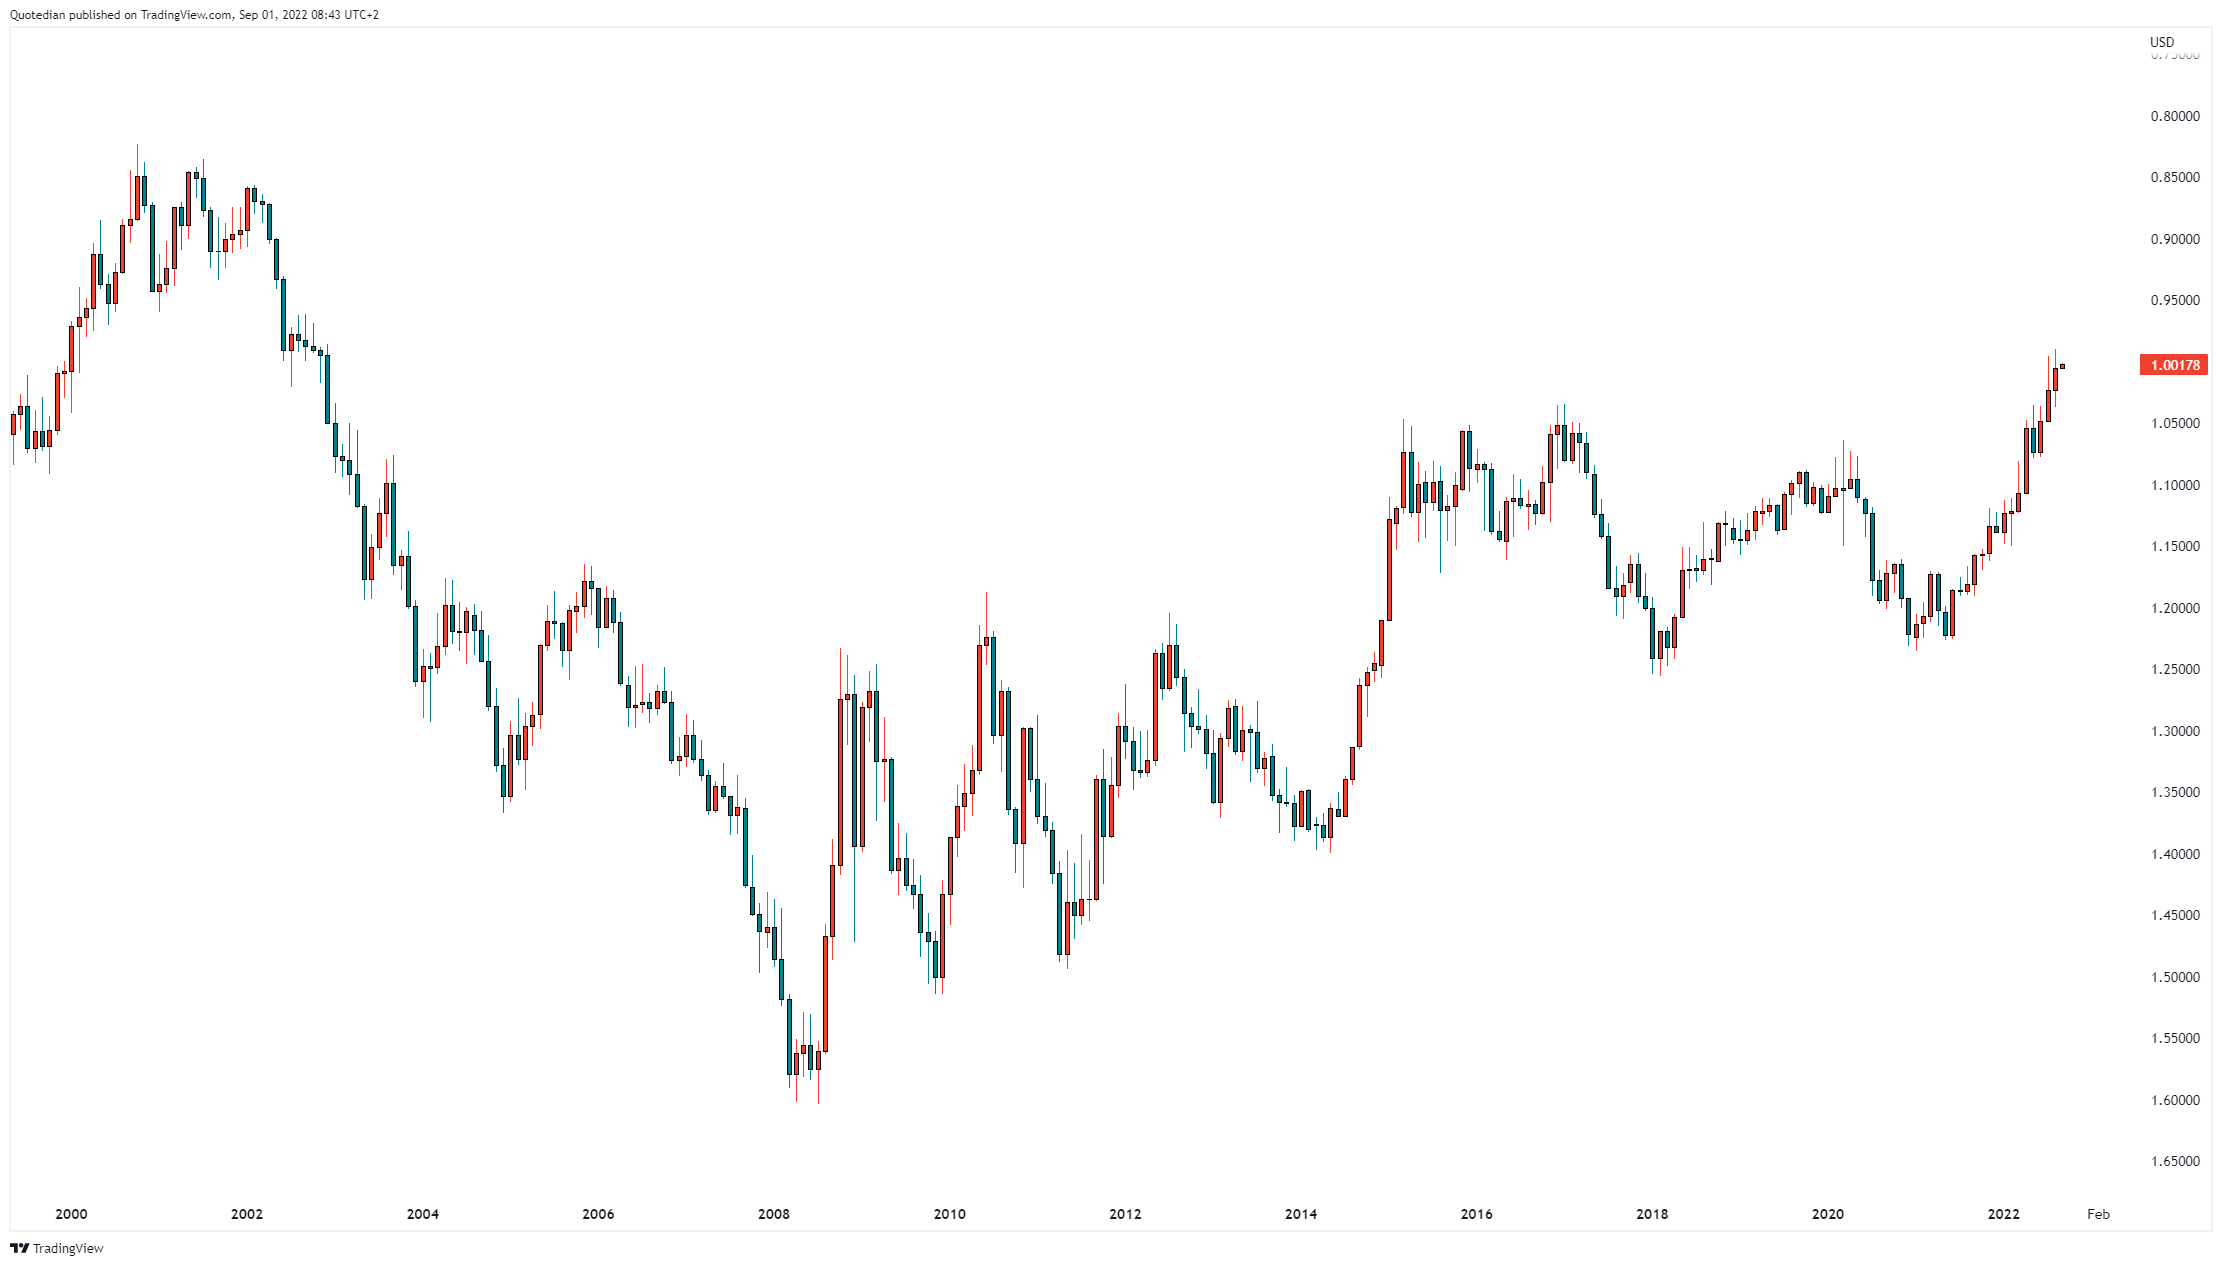
Me, rather a buyer. Of course this is the inverted EUR/USD chart (USD/EUR), here’s the usual way we look at this:
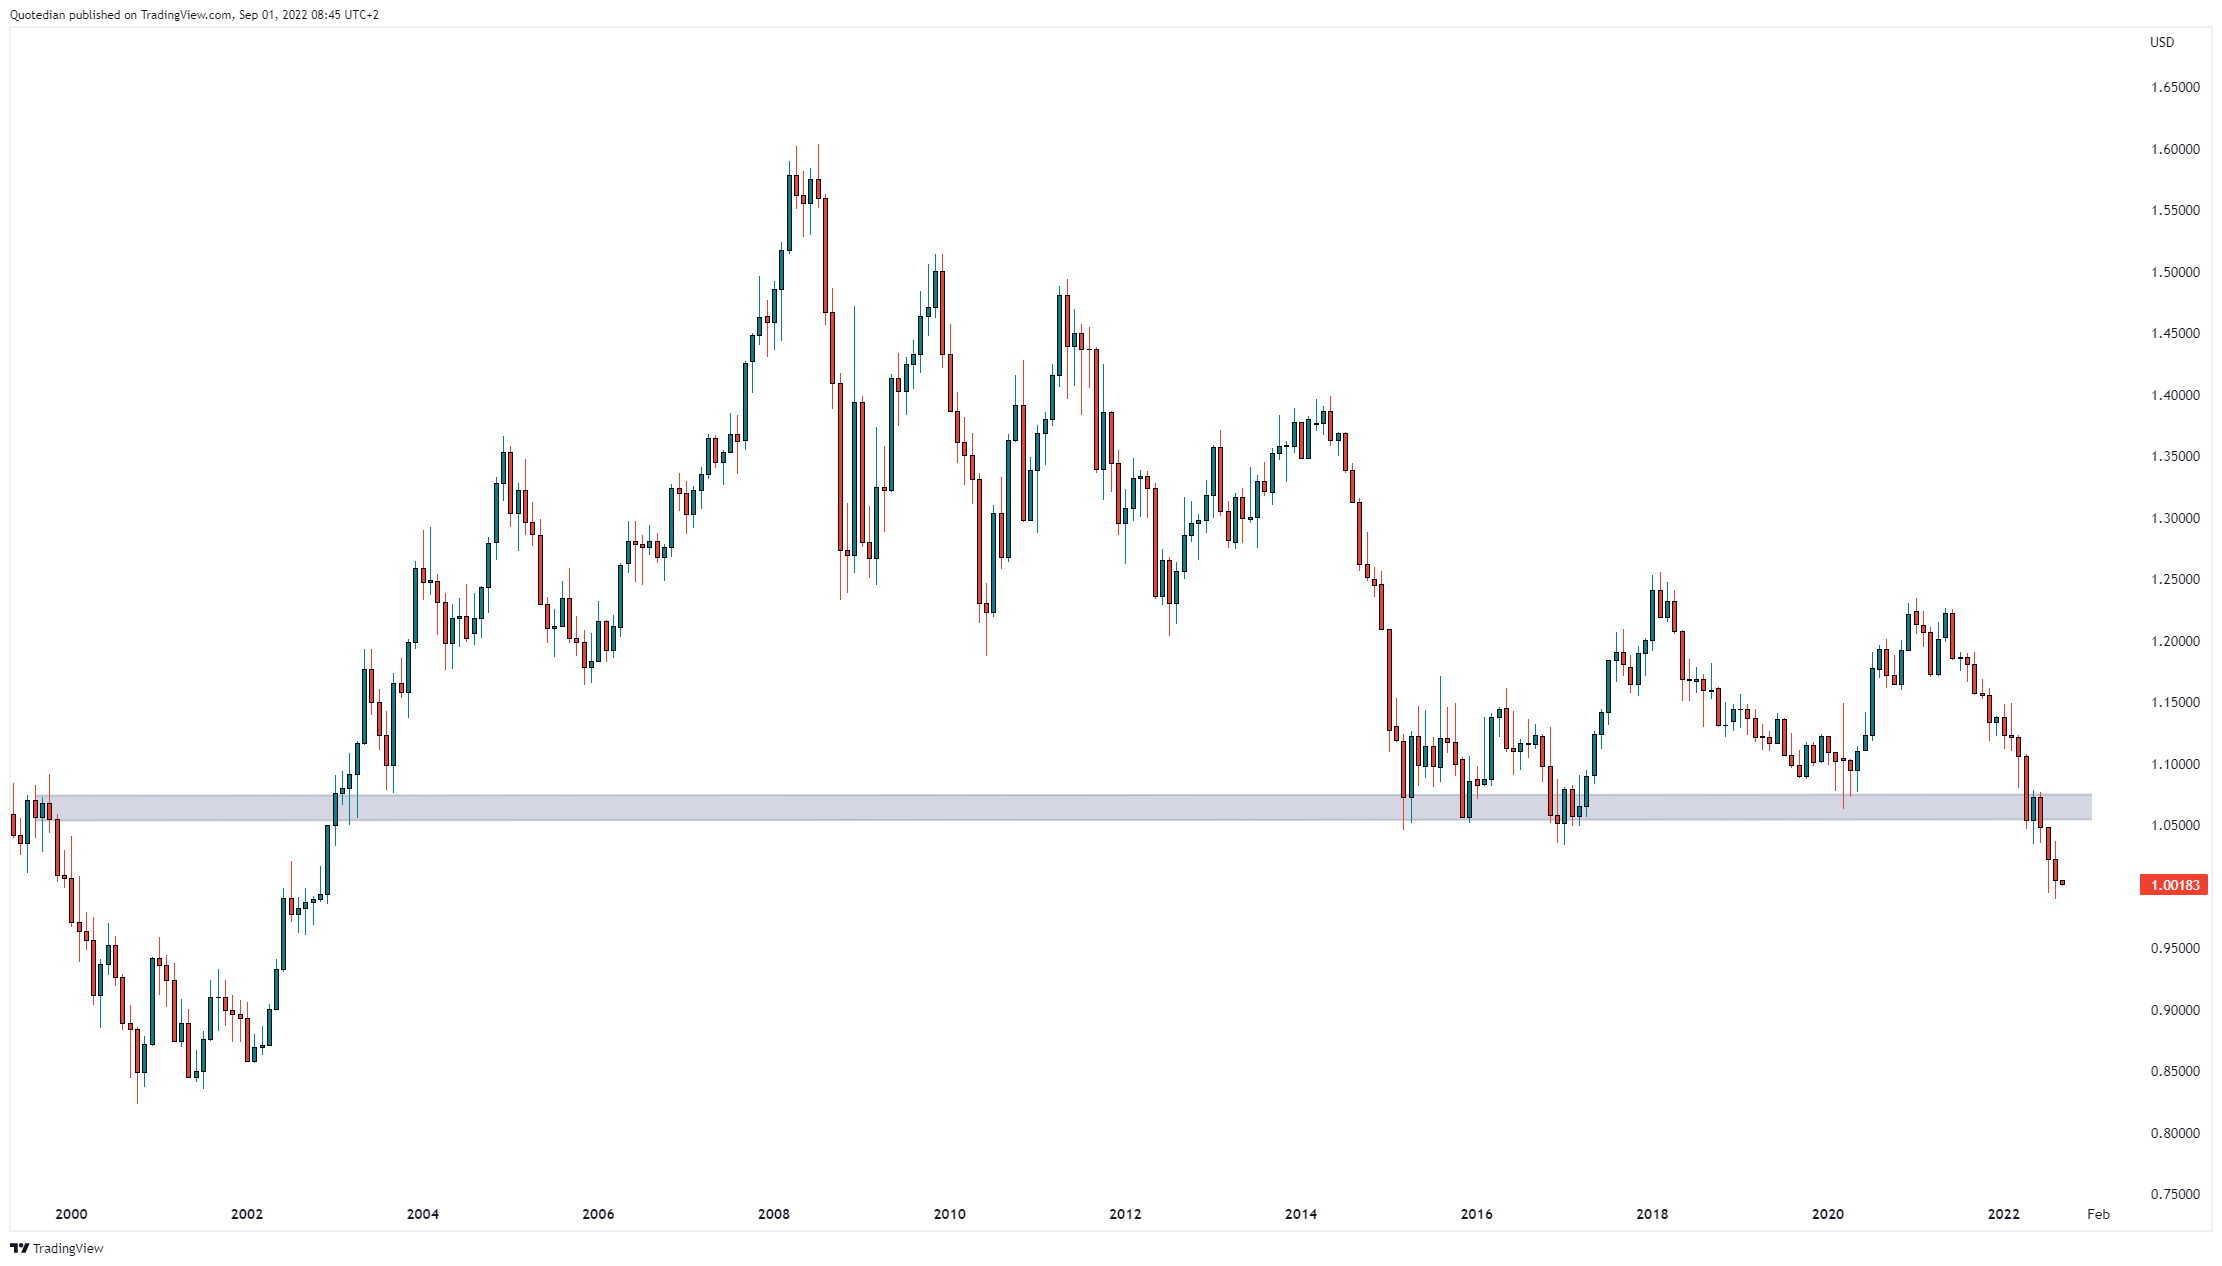
Key support has been broken a few months ago and the trend is clear - no excuses.
And to finish the FX section, here’s a monthly candle chart on the US Dollar to Japanese Yen cross-rate over (nearly) my lifetime:

The currency pair is closing in on the 1997/98 highs (USD highs, JPY lows), a year range that somehow rings a bell.
And finally, commodities had a somewhat mixed month, with some surprising divergences within certain commodity segments:
So where for example within the same energy complex gasoline prices were down 22%, whilst natural gas prices jumped over ten percent (even after discounting a strong correction in the last two sessions of the month).
Let me finish here, as it is getting long and late. There is no shorter-term market update today, but in short, today’s session looks like one of those where we need to close the hatches and buckle up.

Be safe!
André
CHART OF THE DAY
As this email is long enough already, let me just reprint here as the COTD something I tweeted after yesterday’s Eurozone CPI report:

And of course, do not forget to follow The Quotedian on Twitter @TheQuotedian
Thanks!
Thanks for reading The Quotedian! Subscribe for free to receive new posts and support my work.
DISCLAIMER
Everything in this document is for educational purposes only (FEPO)
Nothing in this document should be considered investment advice
Past performance is hopefully no indication of future performance