The Observer
The Quotedian - Vol V, Issue 132
“It is awfully hard work doing nothing.”
— Oscar Wilde
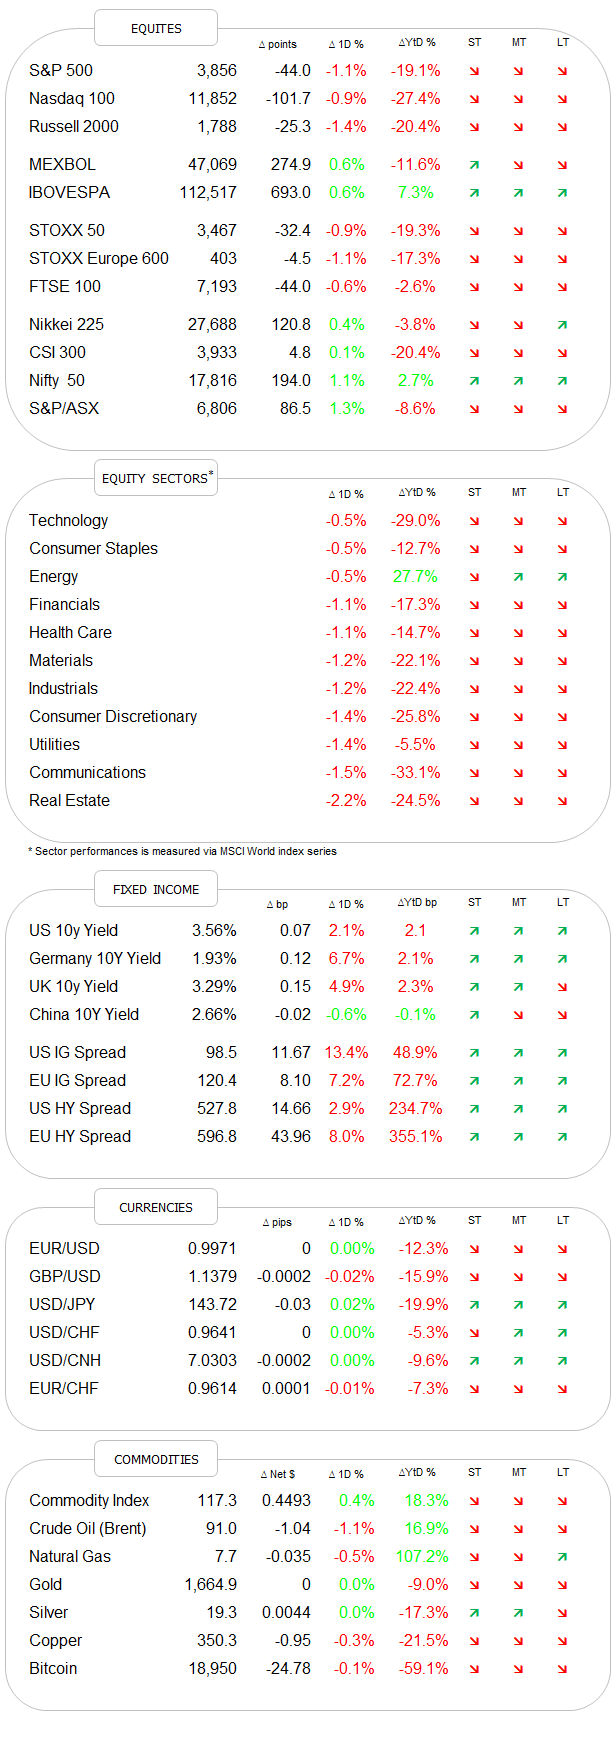
DASHBOARD
AGENDA
CROSS-ASSET DELIBERATIONS
Market action over the past few days has been both conflicting and confusing, especially on the equity side. Last week’s quadruple witching, general month-end rebalancing, profit warnings (Nucor, FedEx), waiting for Godot FOMC and many other factors have made the tealeaves even harder to read than usual. Take the last three to four sessions on the S&P 500 candle chart for example:
Thursday to Friday there was a gap lower below key support - bearish
Friday however itself built a Hammer candle, which is a sign of (downside) exhaustion - potentially bullish.
This was followed by an engulfing patter (2+3) on Monday - bullish
But somehow negated by a lack of follow-through yesterday - potentially bearish
The point is, that markets are short-term torn between the aforementioned factors and we need to take a step back and degrade ourselves to mere OBSERVERS of short-term market action. Medium- to long-term, the bears are in charge (see trend arrows in the Dashboard section) until proven otherwise.
Yesterday’s session was not only weak at the headline level, but looking below the hood did nothing to improve the picture. Less than 6% of the S&P 500 constituents were up on the day, leaving us with this market heatmap:
[As a side observation, without Apple being up 1.5% the overall result for the S&P 500 would have been substantially worse.]
Long-time readers of The Quotedian will also remember that I keep track of statistics, which measure how many stocks are hitting new 52-week highs and lows on a daily basis. Ugly for the US yesterday, armageddon for European stocks:
Asian equity markets are a sea of red this morning, with many of the major benchmark indices in the region down in excess of one percent. This is also about the decline we can expect at the European equity cash opening, as indicated by index futures.
For today, the focus is of course on the FOMC meeting, where we agreed upon in our poll on Friday and yesterday, that the hike will be 75 basis points. Futures markets price in actually a bit more than that and there are still some rumours about a 1% rate hike, but I do not think so. We should 75 plus a pretty hawkish press conference - anything less will trigger a risk asset rally and even delivering the bare minimum just mentioned may do so.
Moving into fixed income markets then, unlike equities, there is not too much uncertainty regarding the short-term trend for yields, particularly at the short end of global yield curves. Here’s the US 2-year treasury as a proxy for the rest:
But the lift in yields has of course between along the entire term structure as the following comparison of yields today (green) to those in existence at the beginning of the year (yellow) shows:
Crossing over to Europe, “things” just look awful. Yesterday’s release of German PPI just crossed with the publishing of the Quotedian, but I did mention it over Twitter:
WOW! This reading has led to a kind of 7-sigma event in the spread between PPI and CPI
and can only mean that a) CPI will rise further, b) bond yields will head higher and c) German (European) corporate profit margins will compress (massively).
And then shortly after, we got the release of the ECB current account balance number, which deserves another WOW!
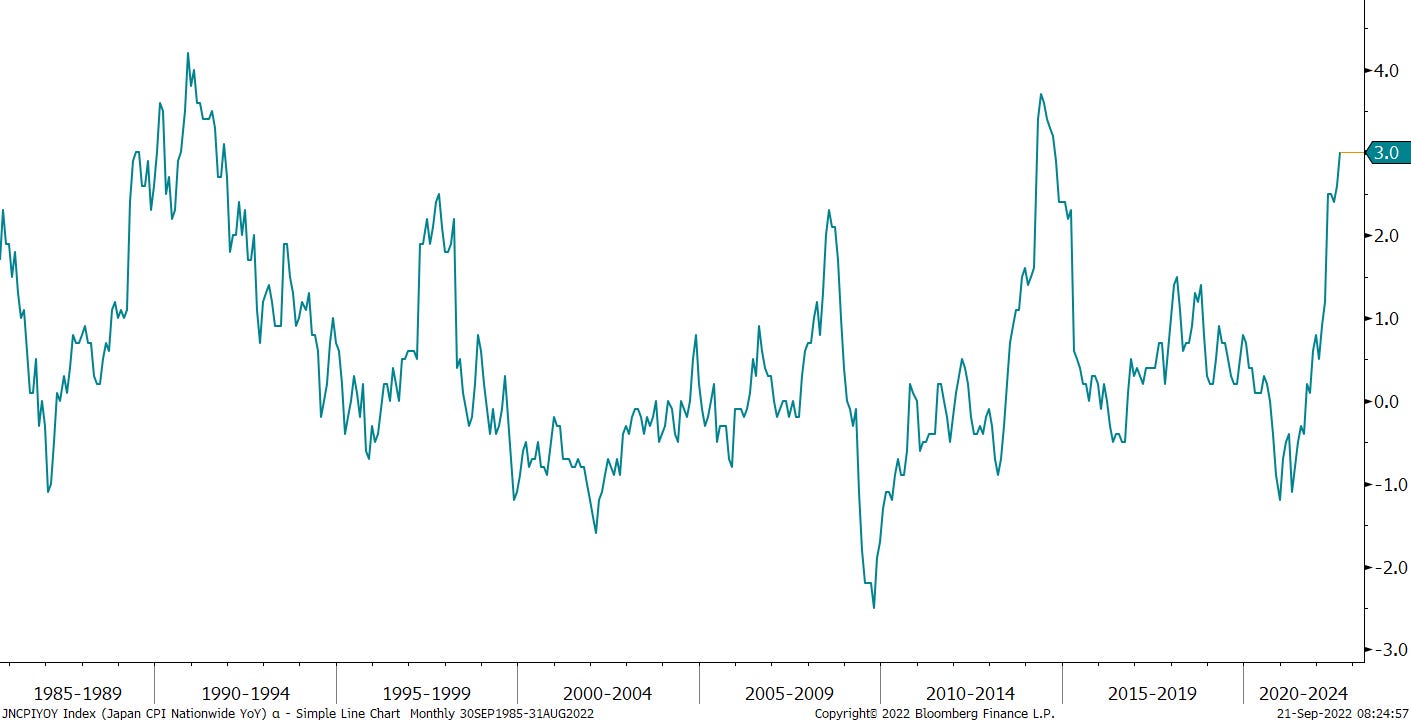
And then there’s Japan … CPI came in at a muted 3% in relative terms, but it is one of the highest readings in that country since the implosion of the asset bubble some 35 years ago:
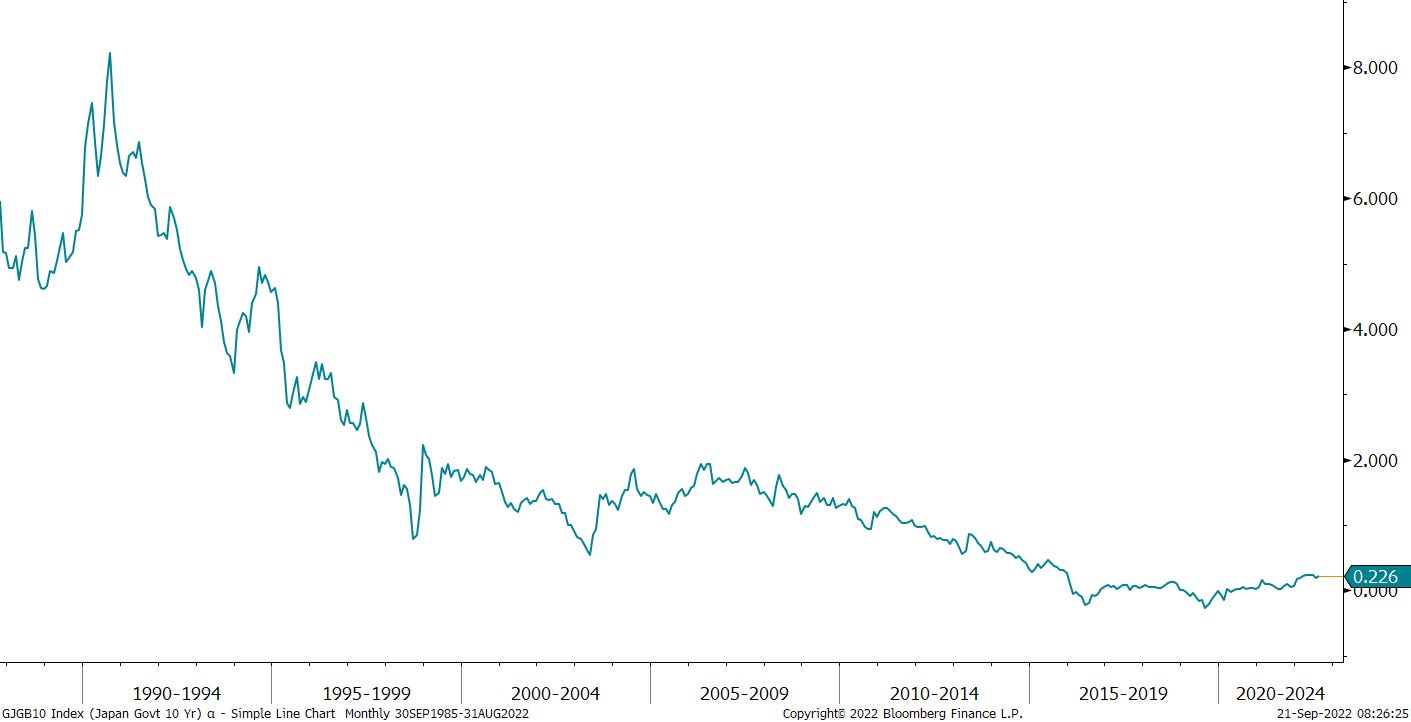
Now let’s compare that to 10-year JGB yields over the same time frame:
Interesting.
And now, let’s compare that to the yield on 30-year issue of the same debt:
Illustrative.
Yield Curve Control at its ‘best’ … And I even read somewhere this morning that the BOJ conducted an unscheduled bond-purchase operation, buying 150 billion yen ($1.04 billion) of debt due in five to 10 years, and 100 billion yen maturing in 10 to 25 years. That's on top of the daily offer to buy an unlimited quantity of 10-year JGBs at 0.25%.
This serves as a segue into currencies, where the pressure on the Yen can only remain through such fore-mentioned central bank activity:
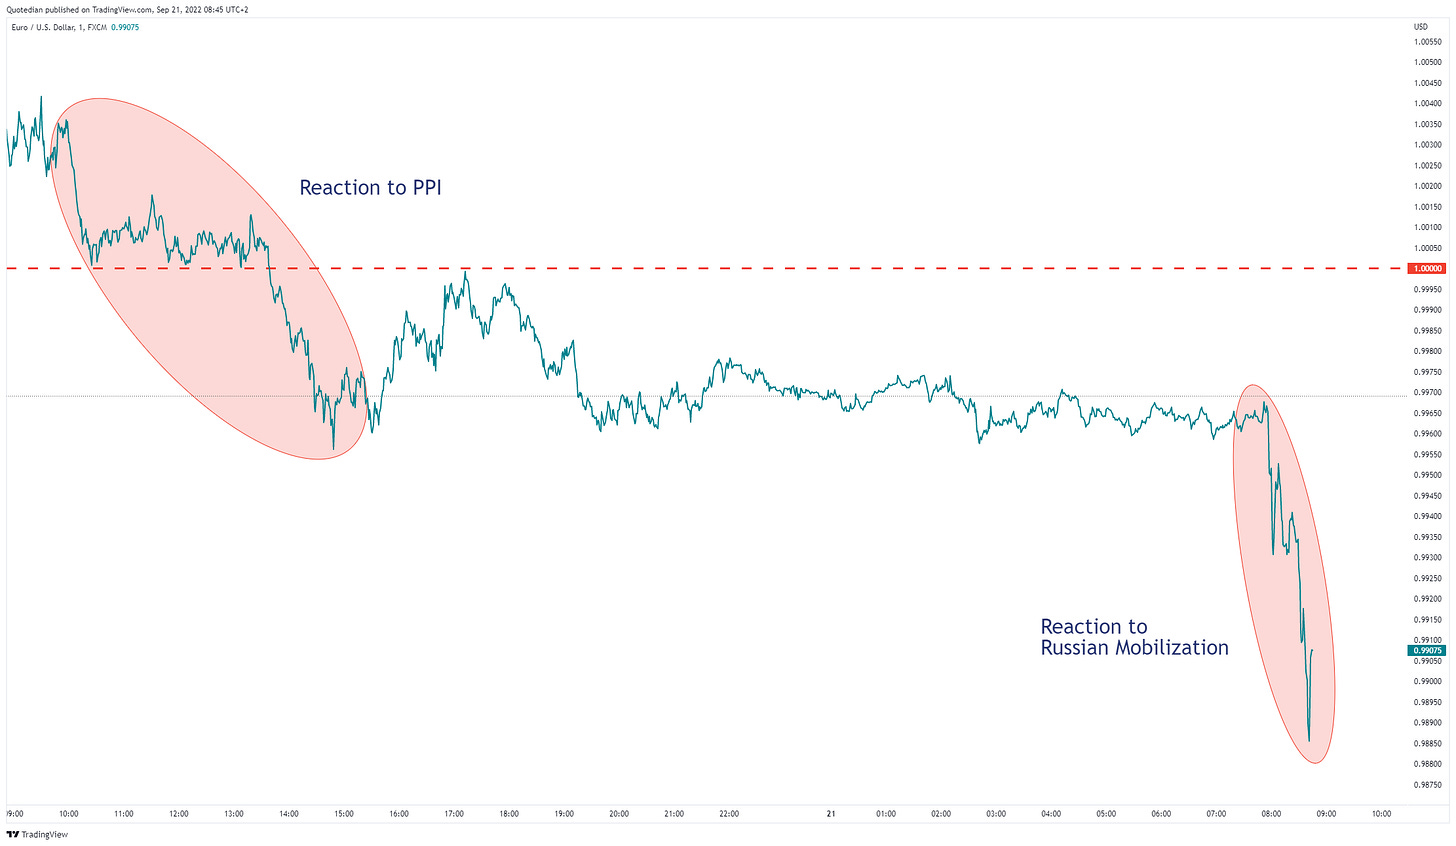
The Euro held its own yesterday, not liking at all the close-to-record negative ECB current account reading and then getting some more stick this morning after this headline:
I have been long wanting to write a special no how I believe WWIII has already started, but it seems I am running out of time…
In any case, the Euro is getting hammered, here’s the chart of the past 24 hours:
On the daily chart, key support is about the broken:
As usual, I am running out of time as we come to the commodity section, so let me just leave you with a brief observation: The first reaction amongst commodity prices to the news out of Russia is unsurprisingly a jump higher, especially in the energy complex. Here’s Brent:
Tailwind for the entire commodity complex should remain formidable (aka commodity super-cylce), let’s have a closer look over one of the coming Quotedians (latest Sunday).
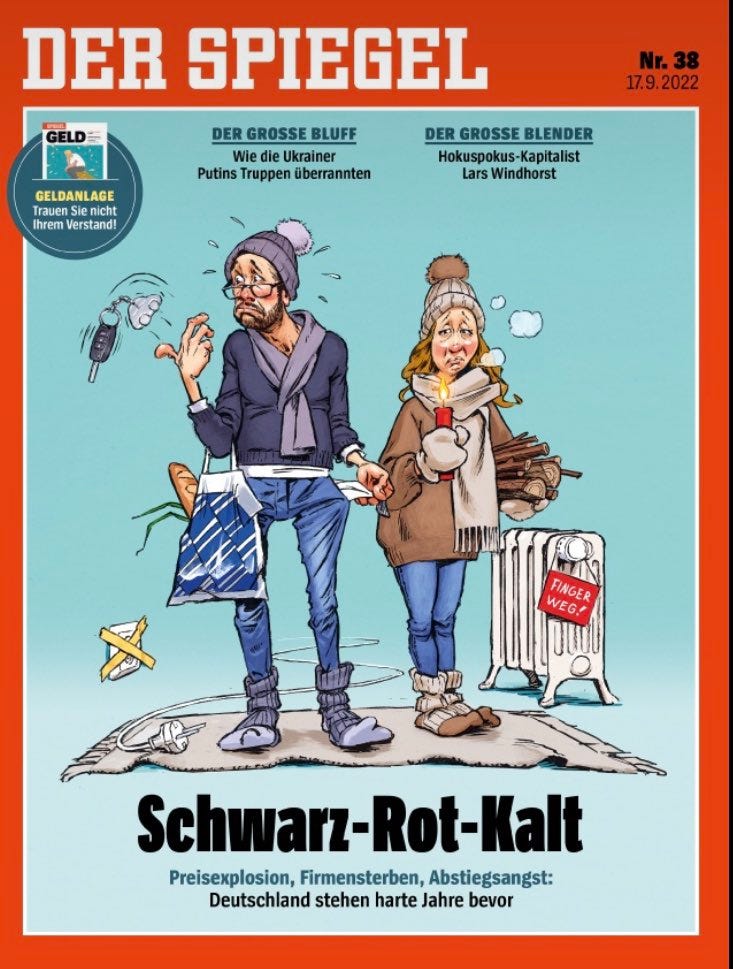
To finish off, here’s the cover page of this week’s “DER SPIEGEL” magazine:
Have a great Wednesday (or at least try to).
André
CHART OF THE DAY
Last week I mentioned a study (which I still have to deliver), which argues that the 10y - 3m yield spread is a better recession indicator as the usually observed 10y - 2y spread. As today’s chart shows, indeed we had 8 out of 8 early warnings, with no false positives!
Today’s rate hike is likely to push this spread once gain into inversion territory. Stay tuned …
Thanks for reading The Quotedian! Subscribe for free to receive new posts and support my work.
DISCLAIMER
Everything in this document is for educational purposes only (FEPO)
Nothing in this document should be considered investment advice
Past performance is hopefully no indication of future performance


