The only easy day was yesterday
The Quotedian - Vol V, Issue 90
“Come what may, all bad fortune is to be conquered by endurance”
— Virgil
DASHBOARD
AGENDA
CROSS-ASSET DELIBERATIONS
Today’s title of this fine publication is of course the motto of the US Navy Seals and seems very fitting to our today’s journey of reviewing the first six months of 2022 with the second quarter ending yesterday. There will be a short market update at the end, so today could make for a potentially longer read.
Please note that on the performance charts to follow, the thicker green/blue bars represent June performance, whilst the thinner red/blue bars of reduced opacity show year-to-date performance. (Still trying to optimize these displays; any design tips welcome!).
Without further ado, let’s dive right in then…
Unless you are like one of those equity analysts which are living with their collective head buried in the sand and to which I alluded yesterday, you have already heard that Q1 2022 has been the worst start for equities as a whole since 1970 (good vintage by the way ;-) ). Global equities largely expanded on their Q1 losses, with especially some of the Russian energy-dependent countries (Germany, Italy) taking the worst hits. Only Chinese stocks (Mainland & HK) bucked the trend, and quite meaningful so. This is of course also leaving some hope for other equities markets around the globe, as China stocks were the first to start tanking well over a year ago (caveat: lead-time of that sell-off was at least six months, so …)
Absolutely nowhere to hide though in terms of equity sectors during the second quarter, as even the last bastions (Energy, Utilities) got hammered. But even given the nearly 15% sell-off in energy stocks, the spread between the best and worst sectors on a YTD basis remains a stunning 42 percent. It’s all about sector allocation …
Which brings us right to the next asset class, fixed income, aka the big frustration of traditional asset allocators. Spoilt by the non-correlation to equities during the sharp downturns in equities over the past decades, bonds this time around failed to provide any shelter whatsoever. Quite to the contrary, in terms of performance, they added insult to injury:
Again, only parts of Asian FI remained flat, after having faced the grunt of the sell-off already last year.
Turning to commodities, the table below beautifully illustrates the concept of “the cure to high prices is higher prices”. As commodities steamed ahead in Q1 of this year, they eventually got to a level that made investors worry over a stagflation/recession and led to a sell-off amongst most commos during Q2. Another factor to be considered is that some of these markets are not huge in relative terms, and financial speculation can hence lead to some outlier moves and the subsequent reversals:
Finally, on the following performance table for currencies (which measures all foreign currencies in USD terms), it should not be surprising to see one currency to rule them all. During times of market distress, the US Dollar is the world’s reserve currency, and hence the ultimate safe haven. But of course, as investors pile into the USD they actually further exacerbate the sell-off in other assets:
Ok, so much for the June and H1/2022 review, just a couple of observations and comments on yesterday’s session:
Stocks dropped around the globe, though ended mostly off their intraday lows; here’s the 1-day price action of the s&P 500 for example:
One thing that really caught my eye was the 11% drop in RH (aka Restauration Hardware - a maker of mostly luxury furniture) and especially the company’s CEO comments (on Wednesday after market close and upon release of guidance):
"The deteriorating macro-economic environment has resulted in lower than expected demand since our prior forecast...With mortgage rates double last year's levels, luxury home sales down 18% in the first quarter, and the Federal Reserve's forecast for another 175 bp increase to the Fed Funds Rate by year end, our expectation is that demand will continue to slow throughout the year."
This is yet another confirmation of where we should the E in PE to head in the coming quarters (as already indicated by other ‘retailers’ such as Walmart and ‘Target).
This morning, starting the second half of this already forgettable year, stocks in Asia continue under pressure and European and US index futures also indicate little good to come at the opening of cash markets.
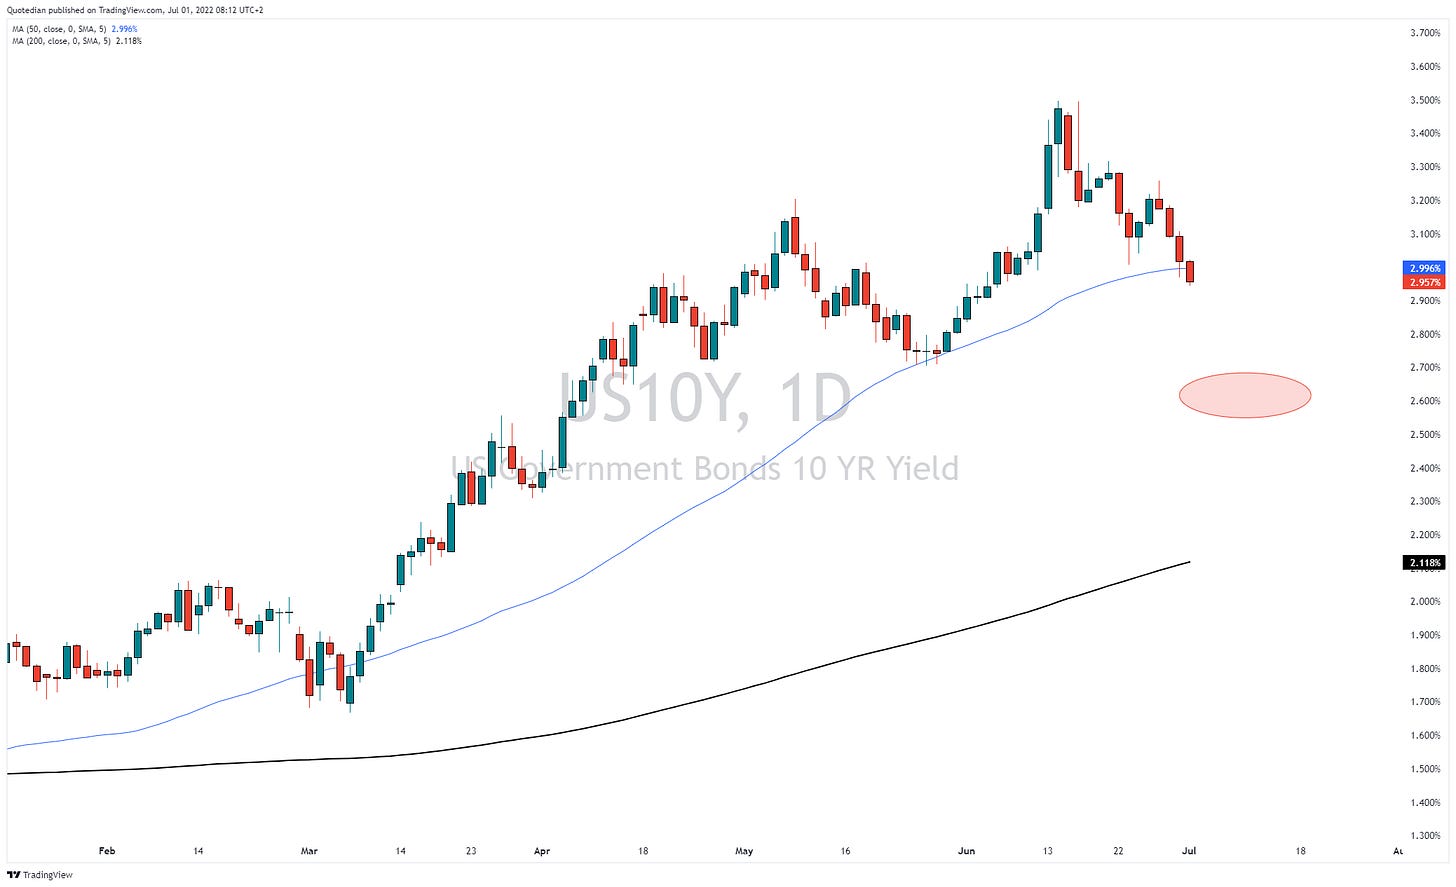
On a somewhat ‘positive’ note, at least bonds are now starting to react with yields dropping, providing some cushioning to equity sell-off. US 10-year yields have dropped below three percent (2.95%), whilst the German Bund trades at its lowest since early June. I could see the Tens drop below 2.70%
and the Bund even trading briefly below 1% again:
But of course, this would likely mean that stocks are trading substantially lower…
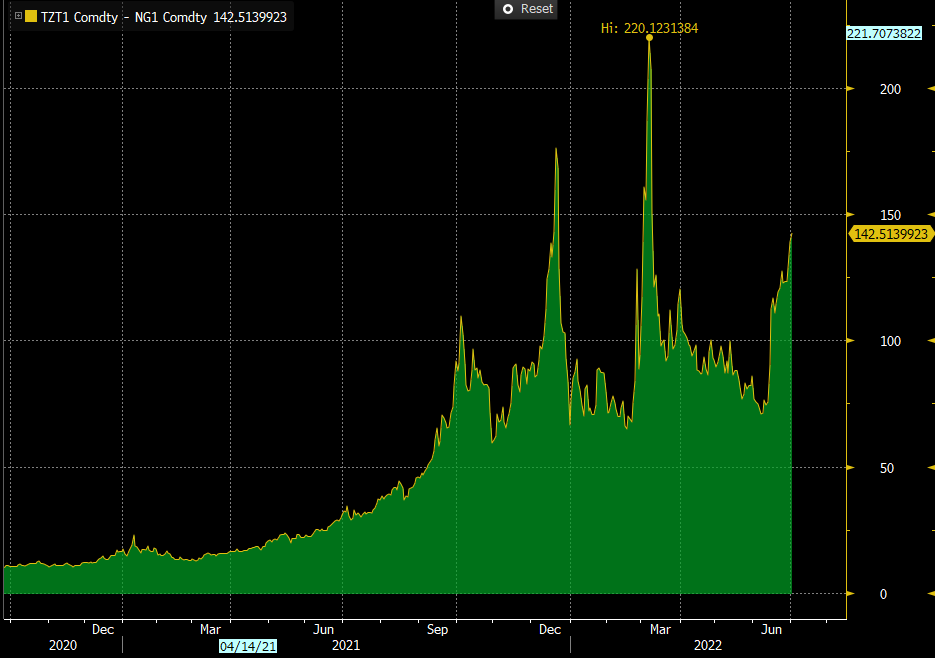
One more observation of yesterday’s price action and then I (nearly) let you go: US natural gas futures (NG1) yesterday dropped 16%, whilst its European counterpart (TZT1) has risen 10% over the past two sessions, leading to the spread between to two to reach marching North again:
‘Nuff said.
Today’s focus: US ISM numbers
CHART OF THE DAY
We use today’s COTD section to visually update our now-month-old, magazine cover-based investment idea of long Chinese equity (FXI) and short Indian equity (PIN). The top chart shows the performance of FXI, the middle chart the one of PIN and finally the bottom chart shows the performance of the ratio between the two since idea inception:
INVESTMENT RADAR
In this new section, I will periodically (monthly? Bi-weekly) update how I would allocate a classical balanced but truly actively managed portfolio. Here’s the currently suggested allocation in comparison to the 60/40 benchmark:
Also in this space, I will update from time to time our opportunistic ideas portfolio:
Like this new section? Leave your comment here:
Love The Quotedian? Don’t forget to share the love!
FRIDAY FUN
And now to something complety different … in today’s Section “Good Question” we have the following:
Enjoy your weekend folks!


