The Quotedian
Vol V, Issue 86
Money Managers Aren’t Paid to Forecast; They’re Paid to Adapt
—Louis Gave
DASHBOARD
CALENDAR
CROSS-ASSET DELIBERATIONS
Yesterday, the investing collective clicked their heels together three times and said 'There's no day like Turnaround Tuesday' and the magic happened once again! After stocks being down six out of the eight previous sessions for a combined loss of over 12% equities finally had a first meaningful rally day, with the S&P 500 for example advancing close to two and a half percent.
This of course comes on a day where even bullish icons such as Goldman Sachs or Cathie Woods joined the cohort of seers starting to talk about recession possibilities. Let me make a quick recount of how many spoke about a recession at the beginning of the year when stocks where 20% higher …… approx. zero.
Anyway, yesterday we got this:
On the chart above, please note (not only the dead cat bouncing) that even after yesterday’s jump, there is still 8% for the index to reach its 50-day moving average and some 17% to touch the 200-day moving average. If this is indeed the fourth bear market bounce developing as indicated by the orange line and numbers, then we could use the 2008 and 2002 bear markets as templates. By sheer coincidence, the 4th wave bounces were around the 20%-mark each time then. Just saying …
It was a day where close to 90% of stocks within the S&P 500 where up on the day, leaving a the market carpet resembling a sea of green:
This nearly 90%-up day follows after a record amount of 90%-down days:
Unsurprisingly also, given the heatmap above, was sector performance one-way yesterday:
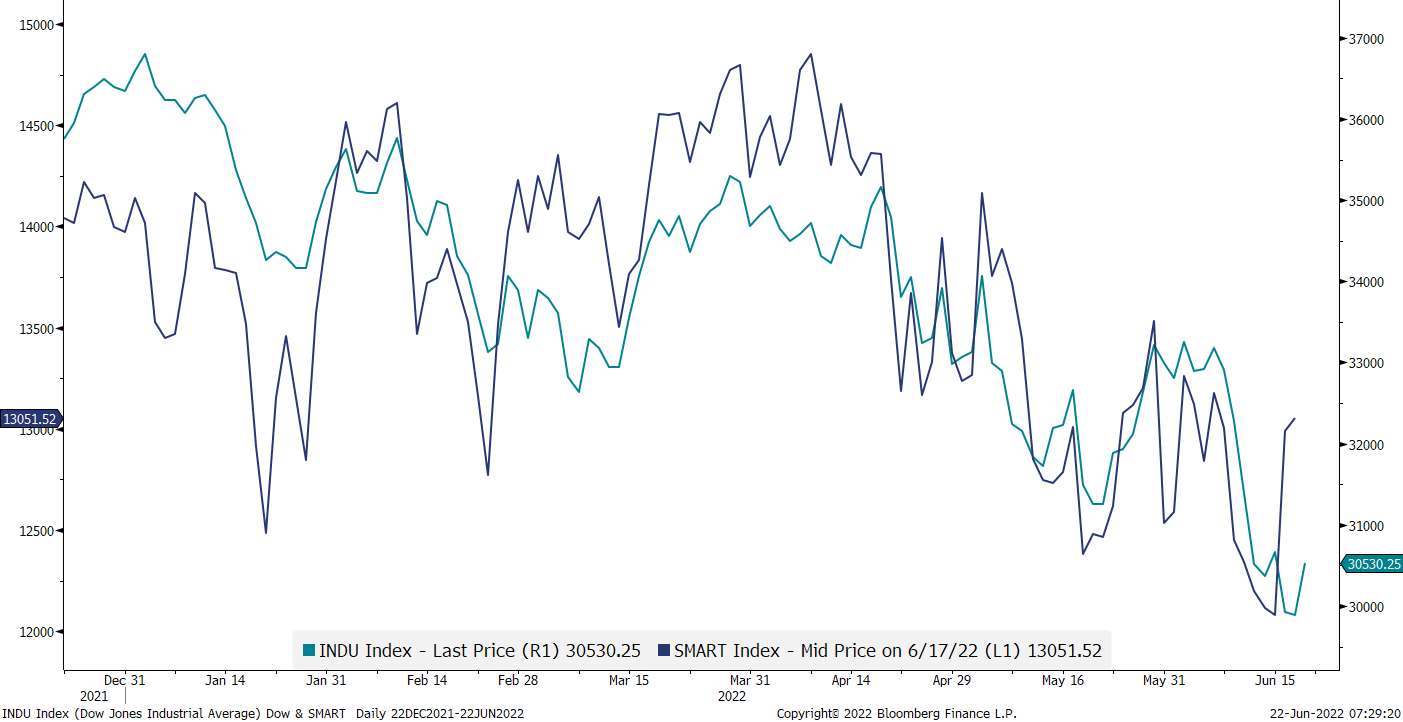
One interesting development is that smart money, i.e. supposedly the investors which buy or sell towards the end of the session (as compared to the emotional guys who buy at the beginning of a trading day) have been accumulating recently, as the blue line below shows:
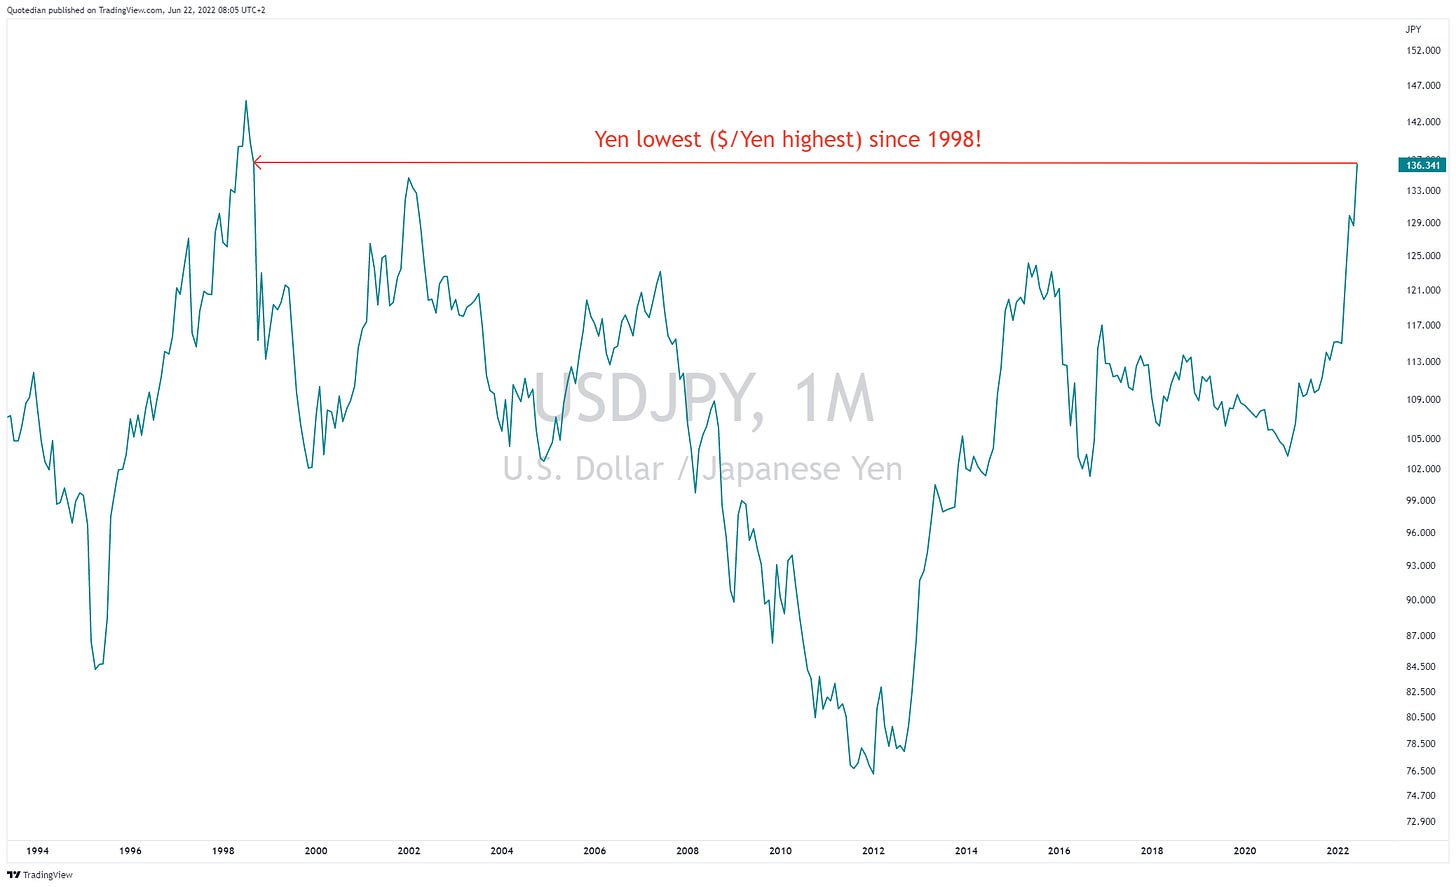
However, after all this ‘goodness’ of yesterday’s session, investors already seem a bit less convinced about further advances this morning, with most Asian indices giving back early gains. As a matter of fact, declines have become already quite meaningful in countries such as Korea or Taiwan, where the benchmark indices are down by two percent this Wednesday. Japanese stocks are the region’s relative outperformer, with the TOPIX showing a tiny green print. This is probably on the back of the country’s currency hitting a 24-year low this morning (more on this below).
Moving into the fixed income space, the renewed strength in bond yields after a recent consolidation period could be the explanation for wobbling equity markets this morning. The 10-year US Treasury yield is trading back at 3.26% after hitting a post-Fed hike low of 3.16%, whilst the German equivalent (Bund) is showing no mercy and is grinding higher by the day (1.77% now):
It is also interesting to observe, that neither credit spreads (BofA High Yield OAS Index)
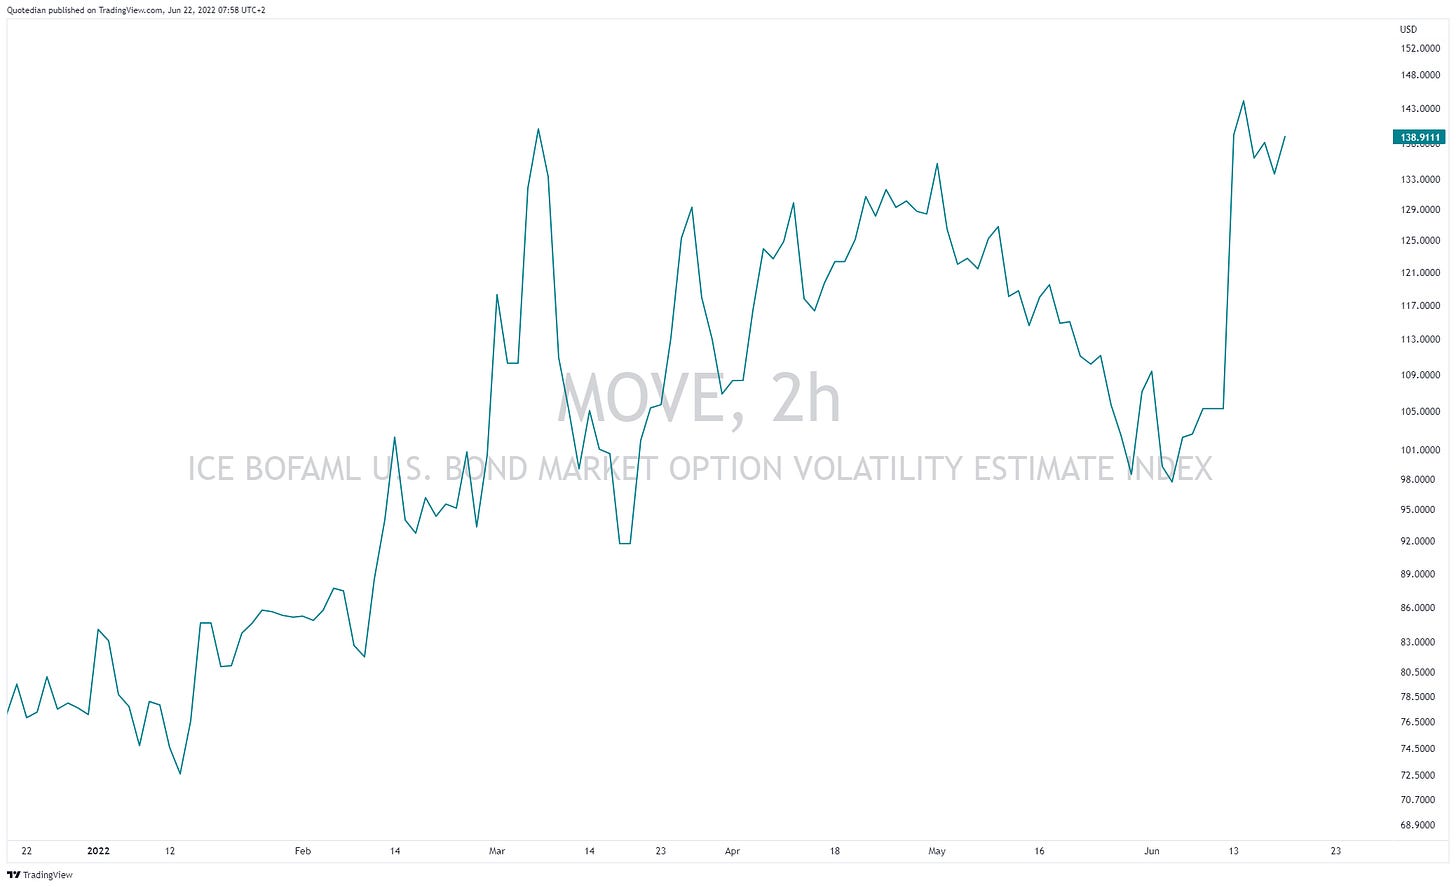
nor the bond volatility index (MOVE)
be
believed in yesterday’s equity rally.
As fore-mentioned, on currency markets, the Japanese Yen is attracting most of the attention, after the BoJ decided last week to become an island amongst central banks by not hiking, or better said, by insisting on yield curve control and not increasing the 0.25% ceiling on their 10-year JGBs. The Yen is accordingly taking the grunt of this decision:
The following chart illustrates just how much bond buying the BoJ has to do in order to defend their ceiling:
It will not end well… be short some JGBs, counting on the BoJ to give up over the next three months (the Australian Central Bank gave up doing the same a few months after saying that they will continue YCC until 2024 minimum). In the meantime, you can also continue to short some Yen, but be nimble (FX interventions?).
Amongst cryptocurrencies, Bitcoin held on a interesting level two days ago, with the rebound on the level which was the top in 2017 kind of highlighting the polarity principle of technical analysis:
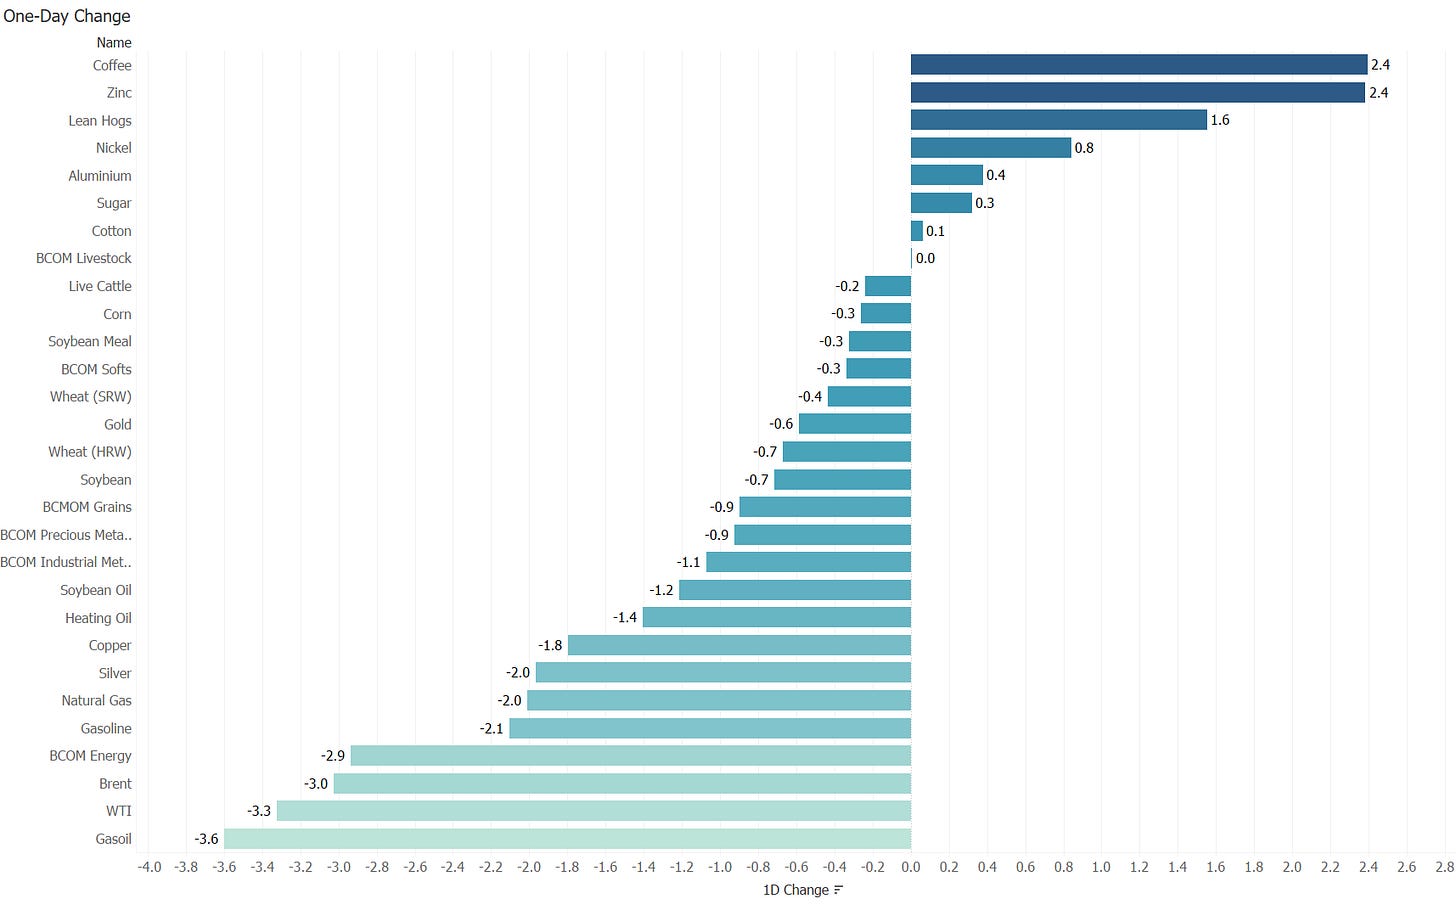
And finally, amongst the commodity space, some more profit-taking seems to be taking hold. Here are the one-day returns on some major commodities and commodity sectors:
Not so European Natural Gas though, which is up over 50% over the past few days, as the riff-raff between Europe and Russia is slowly turning into an outright declaration of war :-(
It is one of these days where there’s more stuff to talk about than time available, so time has come to hit the send button. “Speak” to you probably not before next Tuesday. Be safe!
CHART OF THE DAY
Whilst the Copper-to-Gold ratio and the US 10-year yield usually move into the same direction, there has been a strong decoupling over the past few weeks. Is it that yields are too high given the economic slowdown indicated by copper? Or is it simply another indicator that stops working in a secular inflationary environment? Stay tuned …


A nice one André, thanks for sharing this via substack !
I'd trust the credit markets on my side...
Saludos,
Jacques