

The X-Factor
Vol VIII, Issue 32 | Powered by NPB Neue Privat Bank AG

“The most contrarian thing of all is not to oppose the crowd but to think for yourself.”
— Peter Thiel
Enjoying The Quotedian but not yet signed up for The QuiCQ? What are you waiting for?!!

Since the market bottomed out in mid-October 2022, post the inflation-shock bear market, we all know how much the Magnificent Seven have outperformed the rest of the stock market. In the chart below, we expand the Mag 7 to the Top 10 stocks (dark grey) in the S&P 500 (light grey) to include other behemoths such as Broadcom:
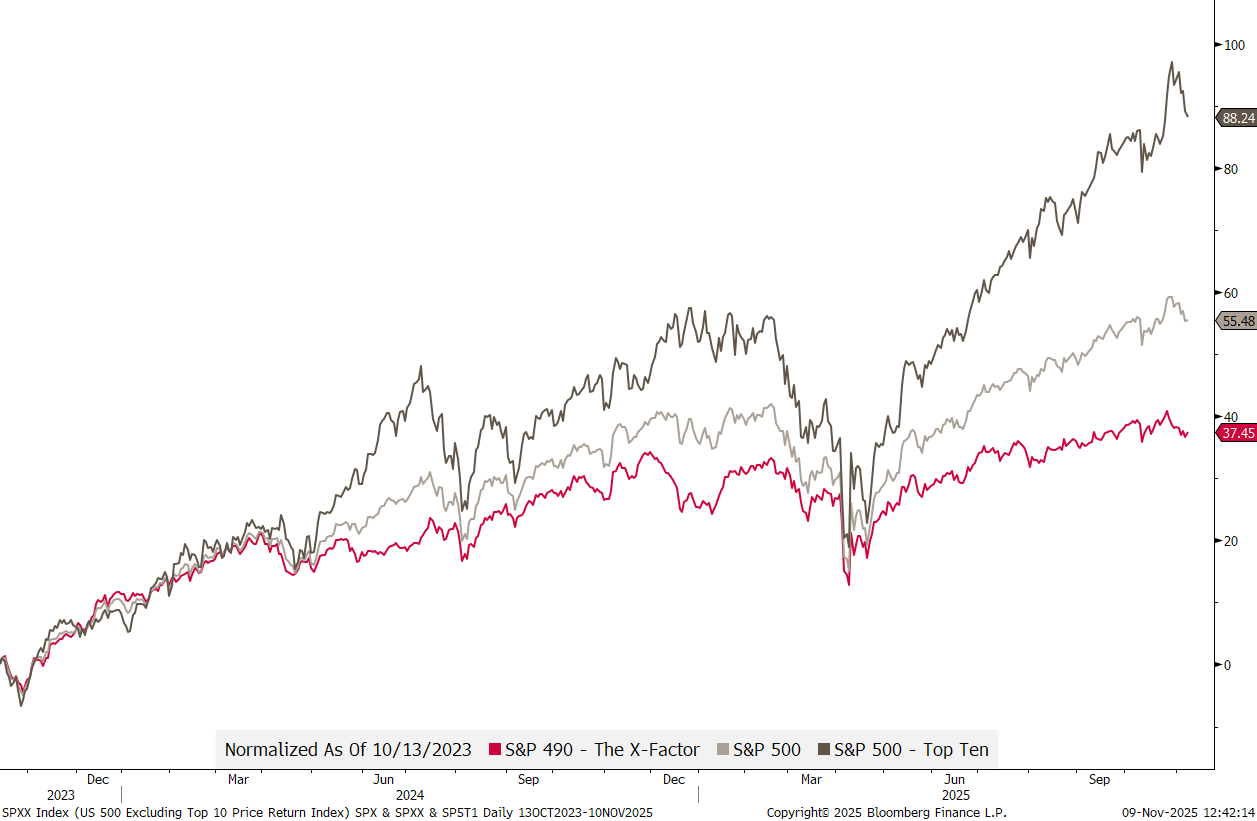
The red line is the S&P 500 excluding those top ten stocks, hence the S&P 490, or, let’s call it the X-Factor from now on …

Hence, indeed, the Top 10 have outperformed the other 490 stocks more than double over the past two years.
Now, since the Fed did its hawkish rate cut on October 29th, stocks have been wobbling:
The question then is, have stocks topped out, and is it time to sell or hedge?
Outright selling or reducing equity exposure to us always seems a dangerous undertaking, because if you’re wrong and stocks turn higher again, you will find all kinds of excuses NOT to follow the rally and reinvest again. That’s just how we humans psychologically work.
Hedging equity exposure via options is equally difficult, though for different reasons. Your timing has to be pretty accurate; otherwise, you pay a lot of “insurance” money, with no accident happening. And once the accident happened, it is typically too late, as volatility has already exploded and hedging cost become prohibitively expensive.
Three case studies this year:
April 2, Liberation Day: VIX +144%
October 10, China Tariff threat: VIX +54%
October 29, FOMC rate cut: VIX +15%
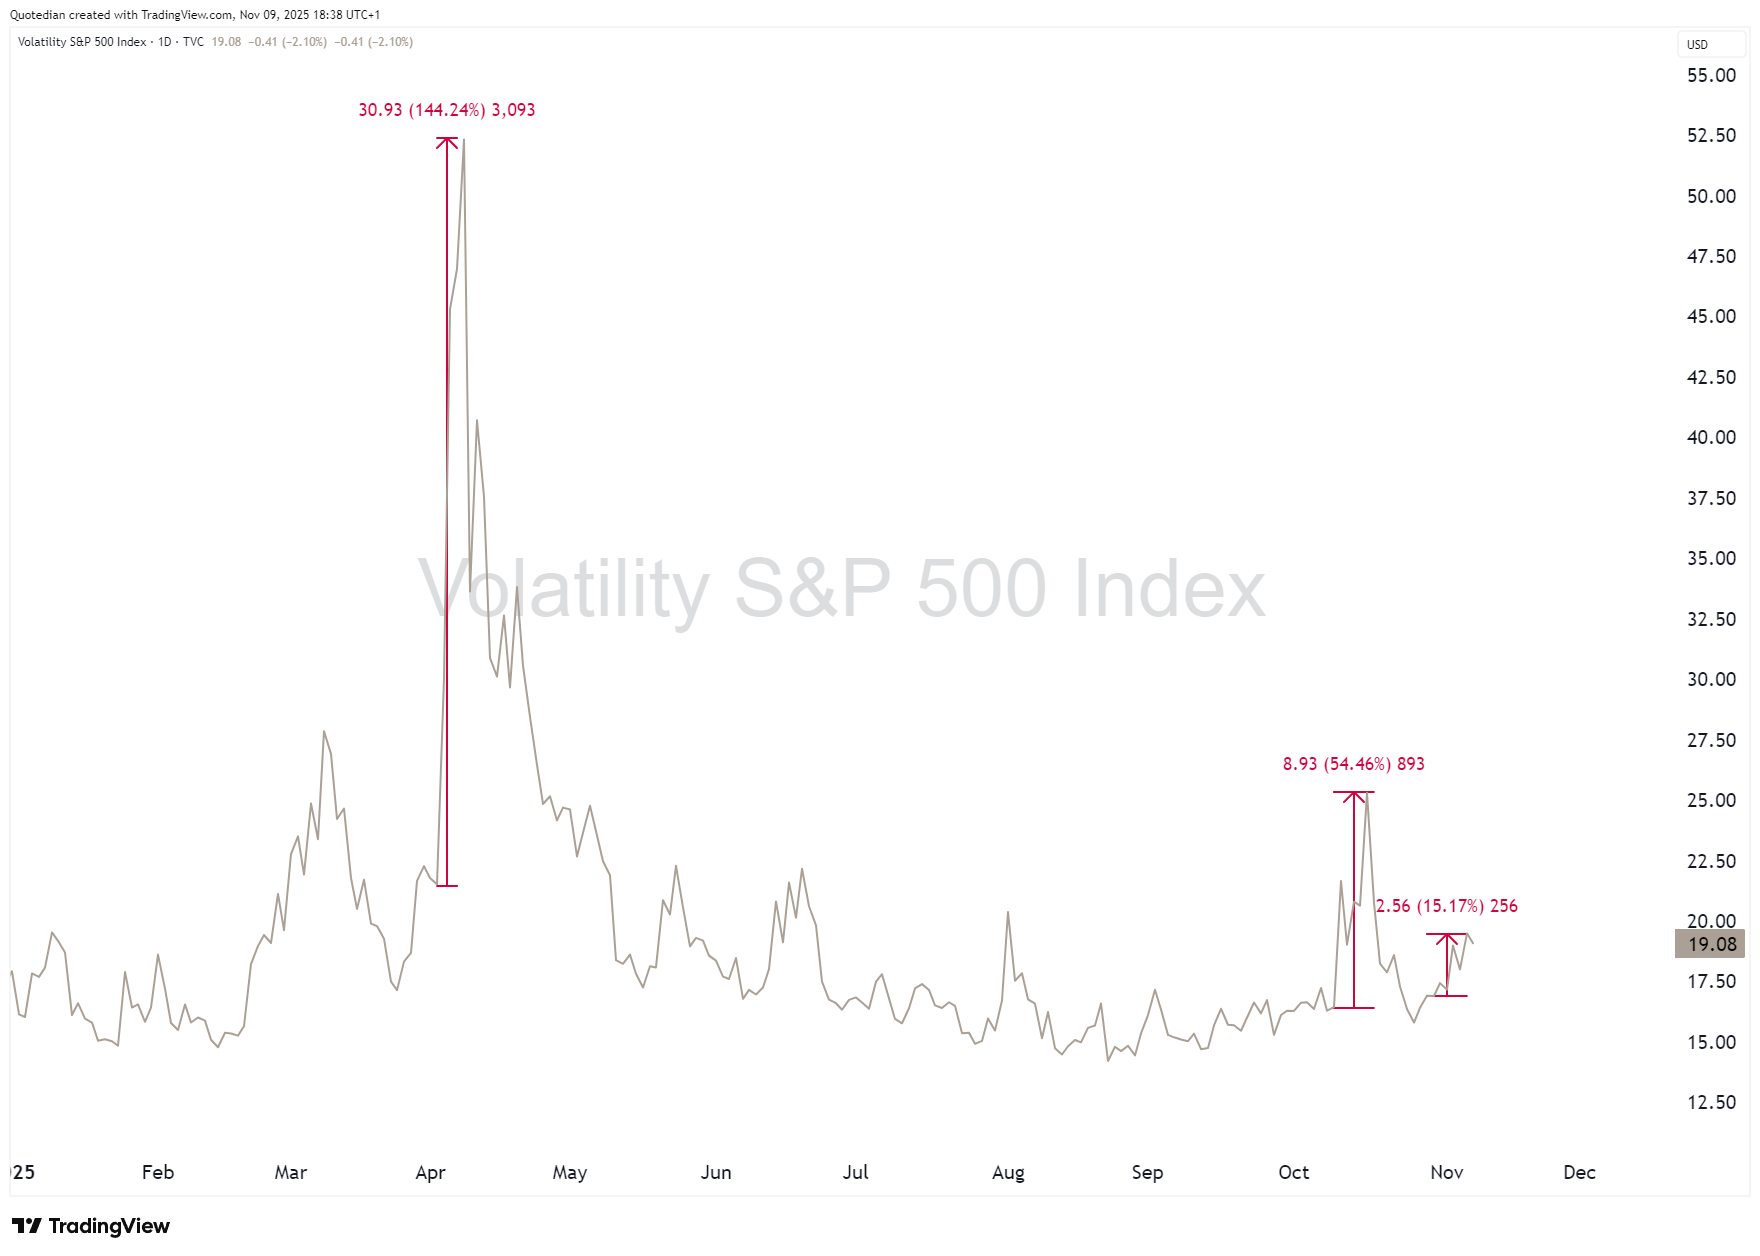
Do not underestimate those volatility pickups - they truly alter your hedging cost and tend to be meaningfully mean-reverting (pun absolutely intended).
However, if you believe that the secular bull is still underway, ROTATION, rather than HEDGING, may be your solution.
Let’s look at the that X-Factor again. Say, for however short-lived the effect was, you had switched from the top 10 stocks into the other 490 shortly a few weeks before Liberation day, just as the “war” drums started to be noisier, you would have done in relative terms, pretty well:
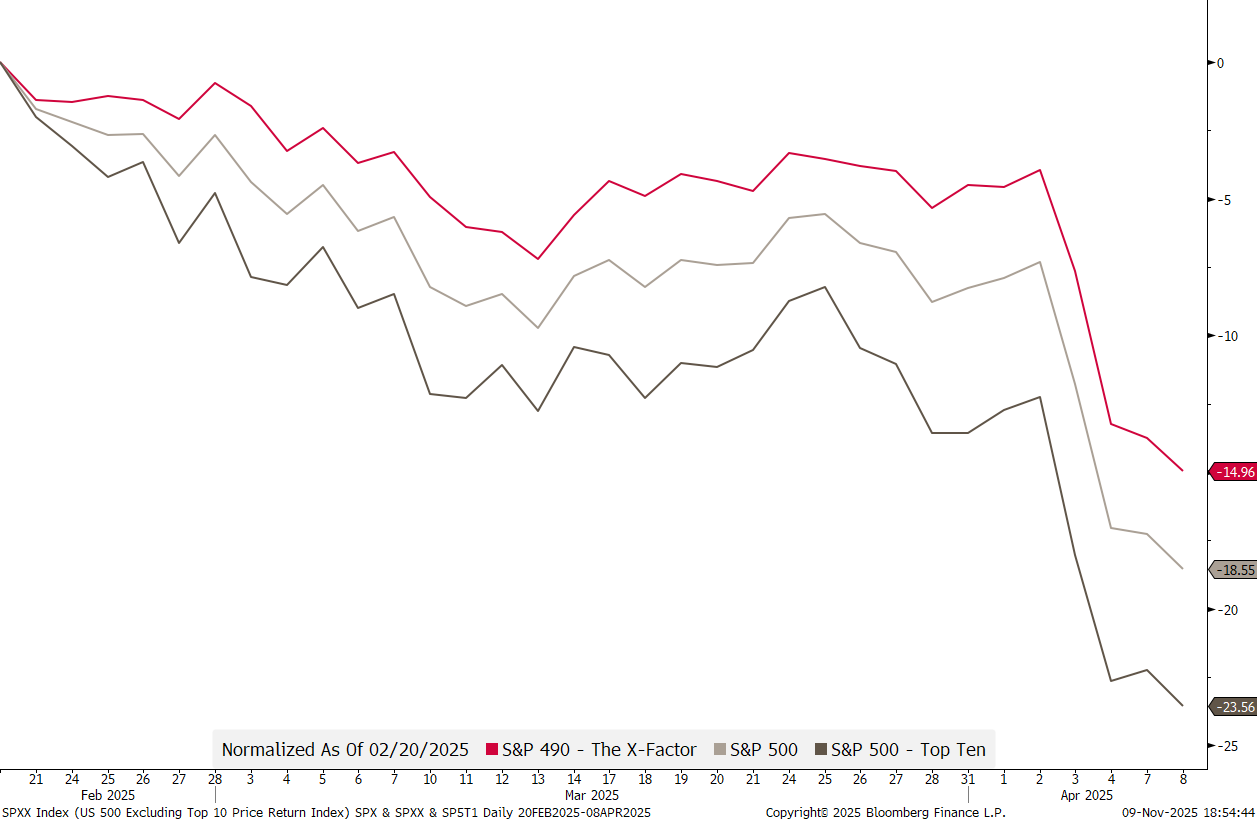
And now again, since the hawkish FOMC cut two weeks ago, which coincided with more scepticism regarding the profitability of AI investments, investing in the X-Factor stocks would have saved you from a lot of pain so far:
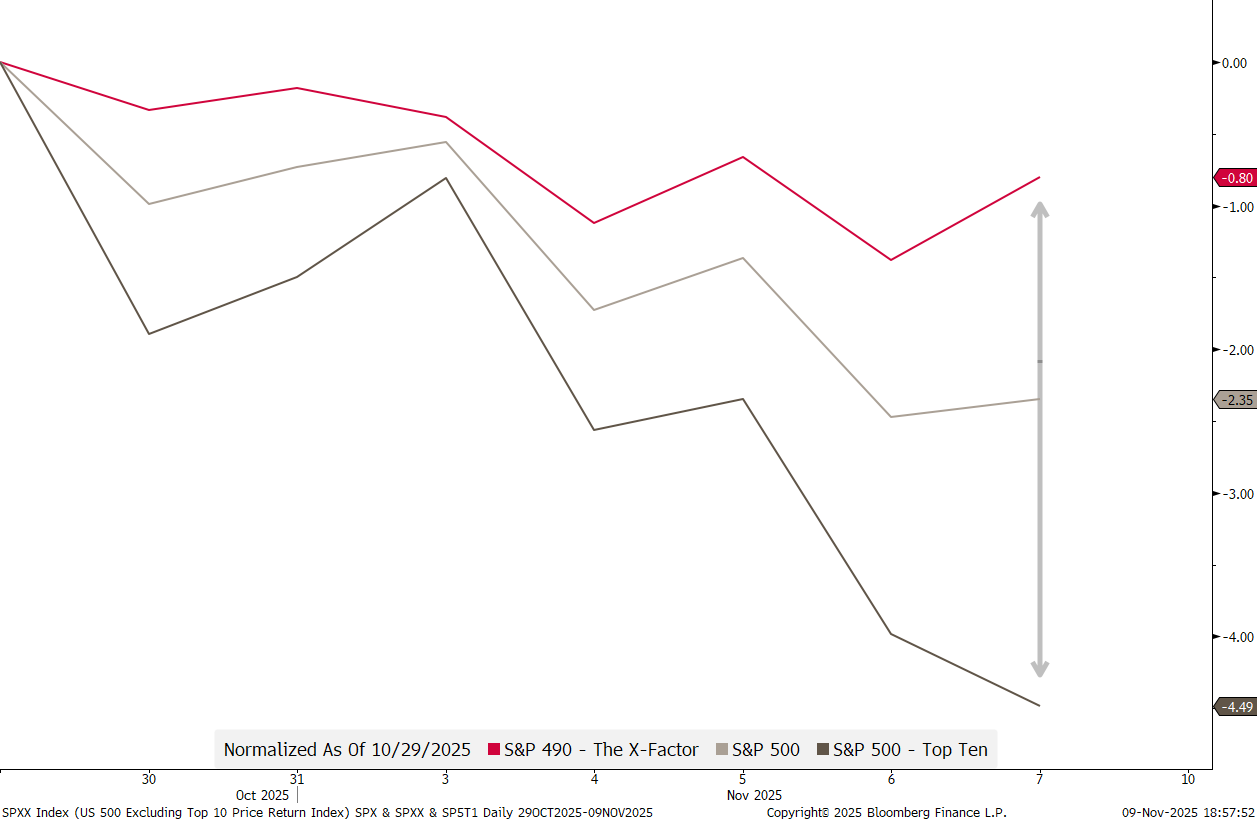
Hence, again, if you think the next few weeks could be a bit bumpy, but not outright bearish, which by sheer coincidence is also our view, it may be time to shun those gargantuan top 10 stocks and reach for the X-Factor (S&P 490)…


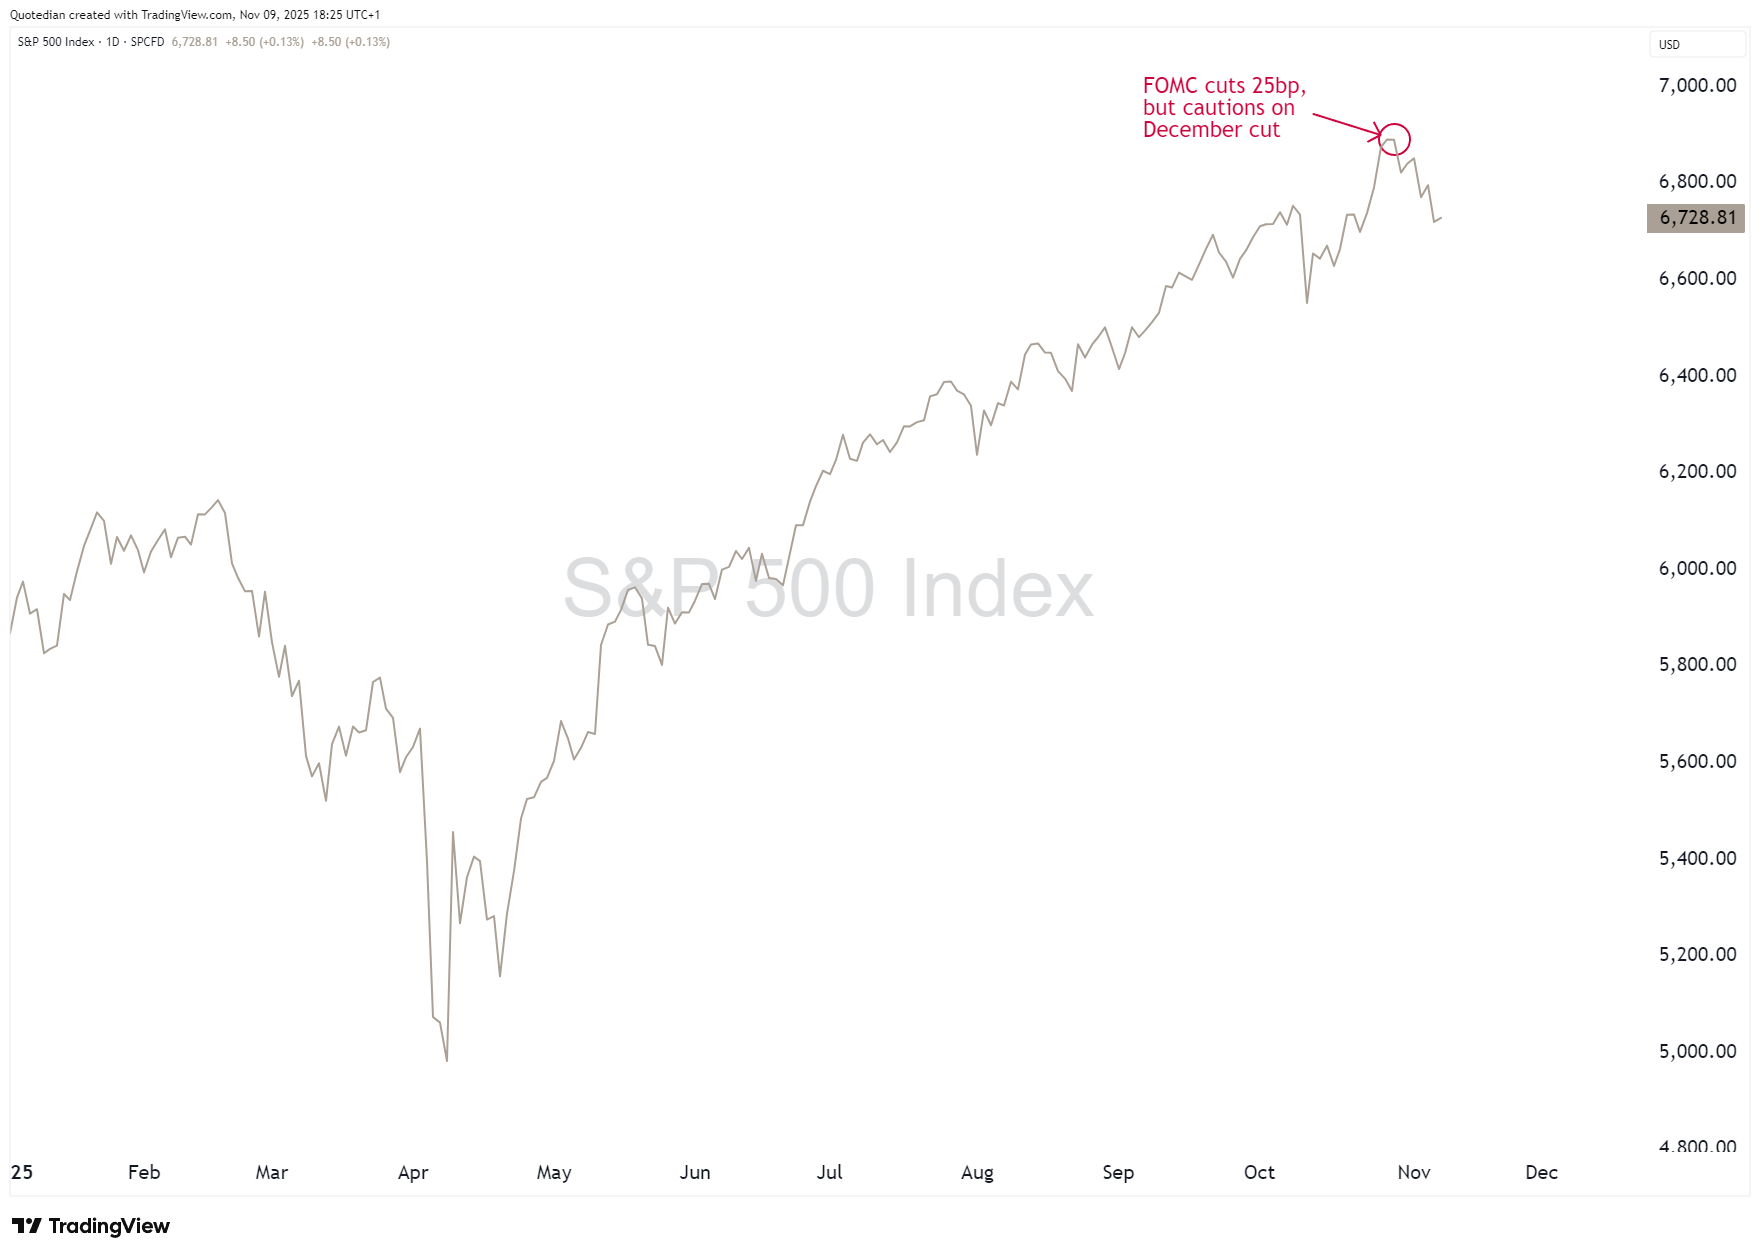
As mentioned above, equities topped out right after the 25 basis points rate cut by the FOMC, which was followed by some hawkish comments by Fed Chair Powell regarding the possibility of another cut in December, exactly one month from today:
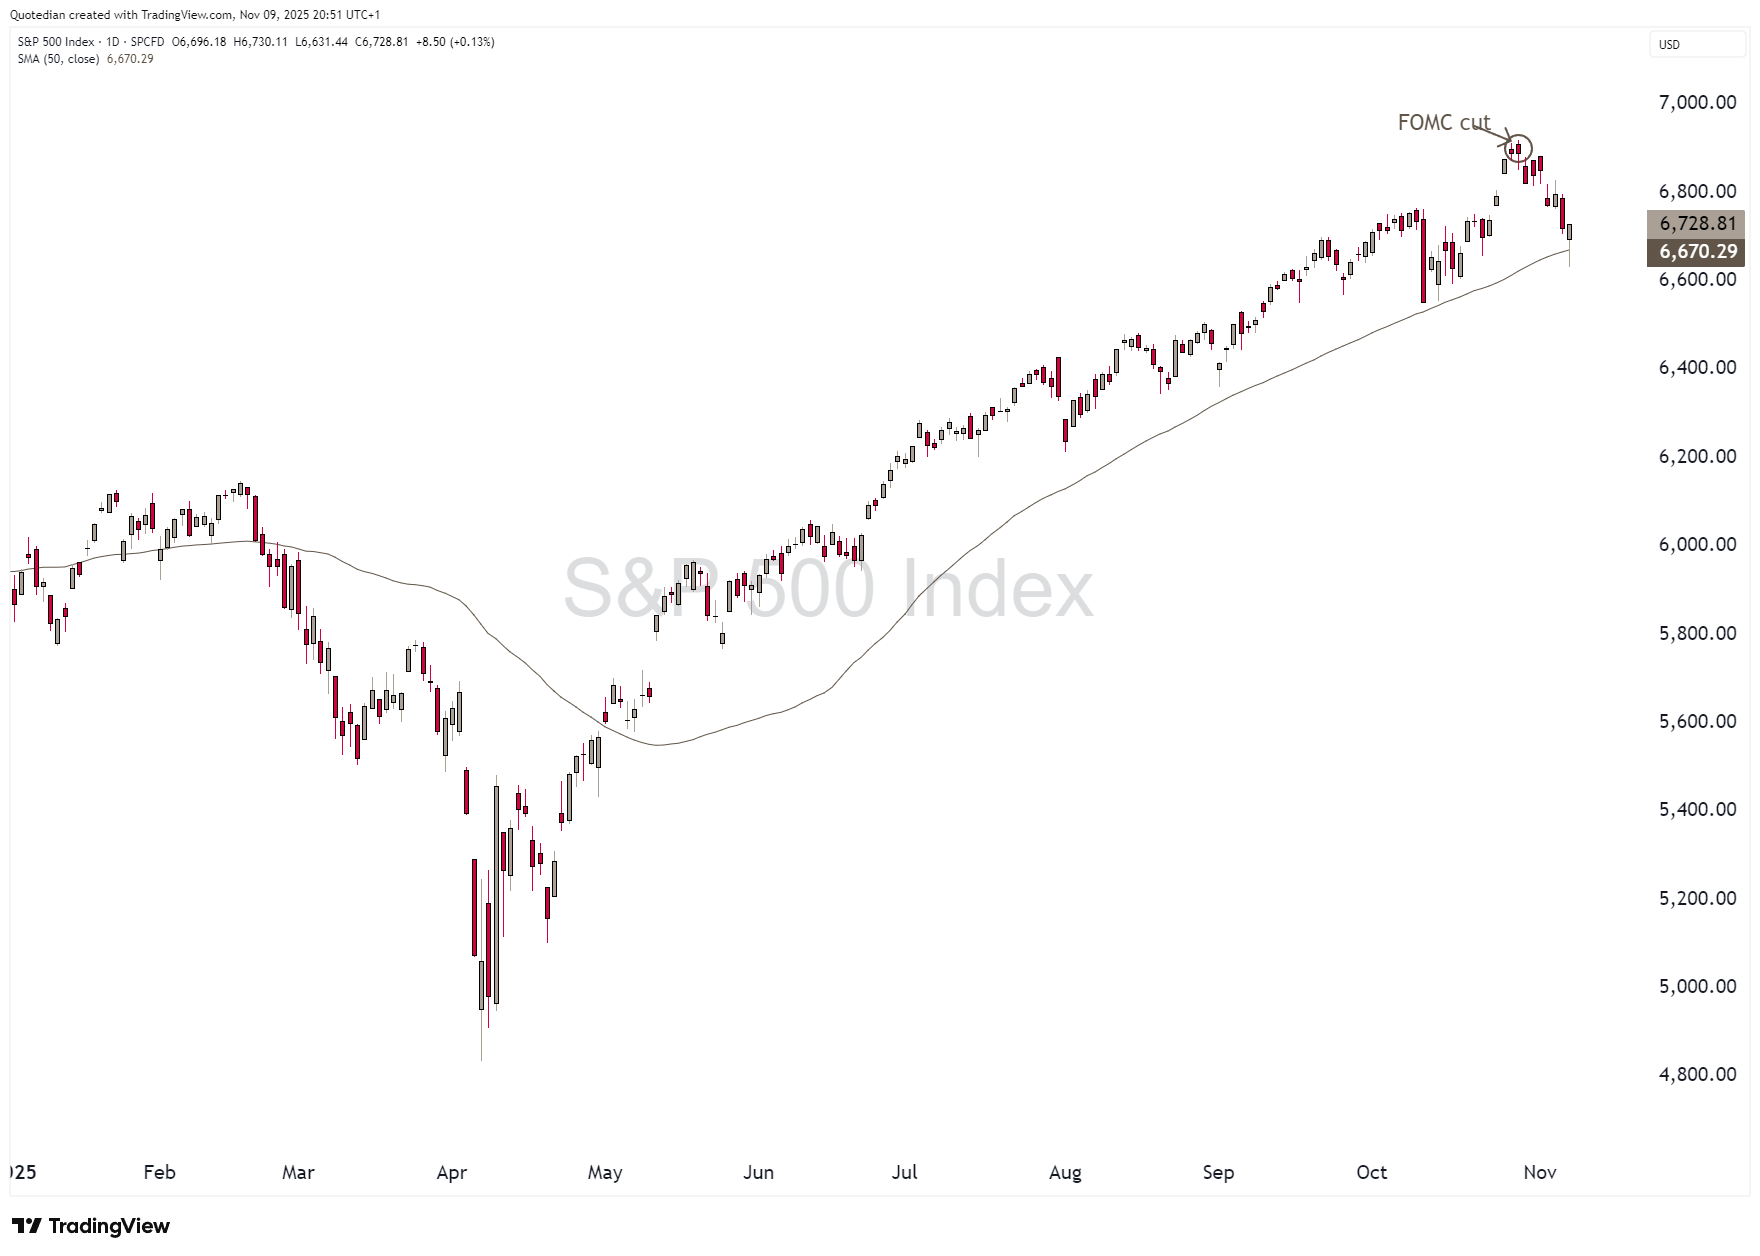
The sell-off accelerated last week, with a 1.5% intraday sell-off during the “darkest hour” on Friday. However, shortly after the European market close, the market started to recover as bargain hunting (nowadays aka FOMO) set-in towards market close.
Hence, as can be observed on the chart above , the S&P 500 once again managed to recover at its 50-day moving average (grey, smoothed line) and even left us with a potential bottom-forming “hammer” candlestick pattern.
Hence, we ask: was this it for the sell-off? Was this the “Hammer”-Time?

In the following few lines and charts, we’ll try to gather some evidence on whether this was the end of the sell-off or whether there is more to come. (Disappointing) Spoiler Alert: Evidence is not conclusive…
For starters, the S&P 500 continues (just about) its 4th-longest streak trading above the 50-day moving average over the past thirty years:
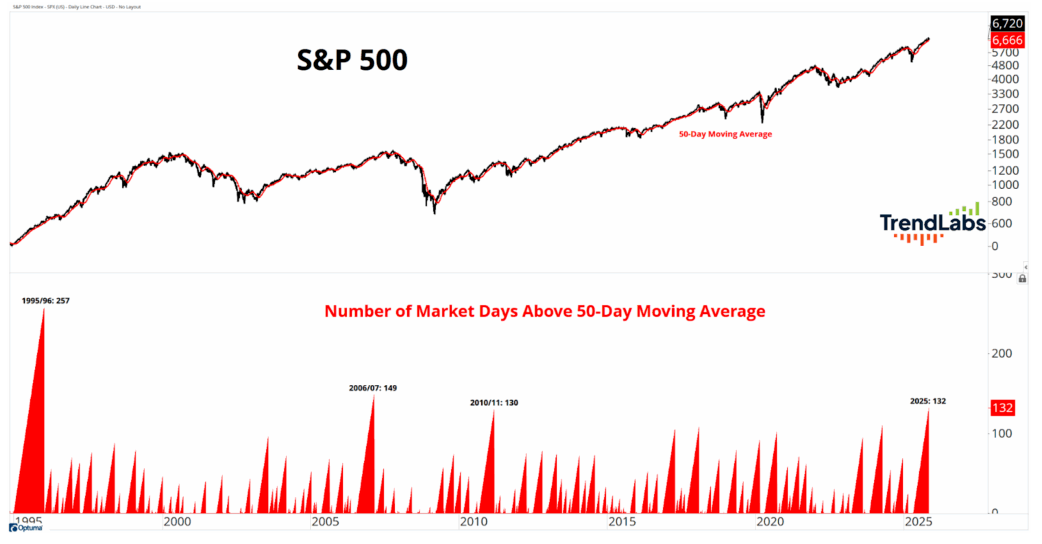
In other words, odds are increasing for that streak to end. And then, again, so what?
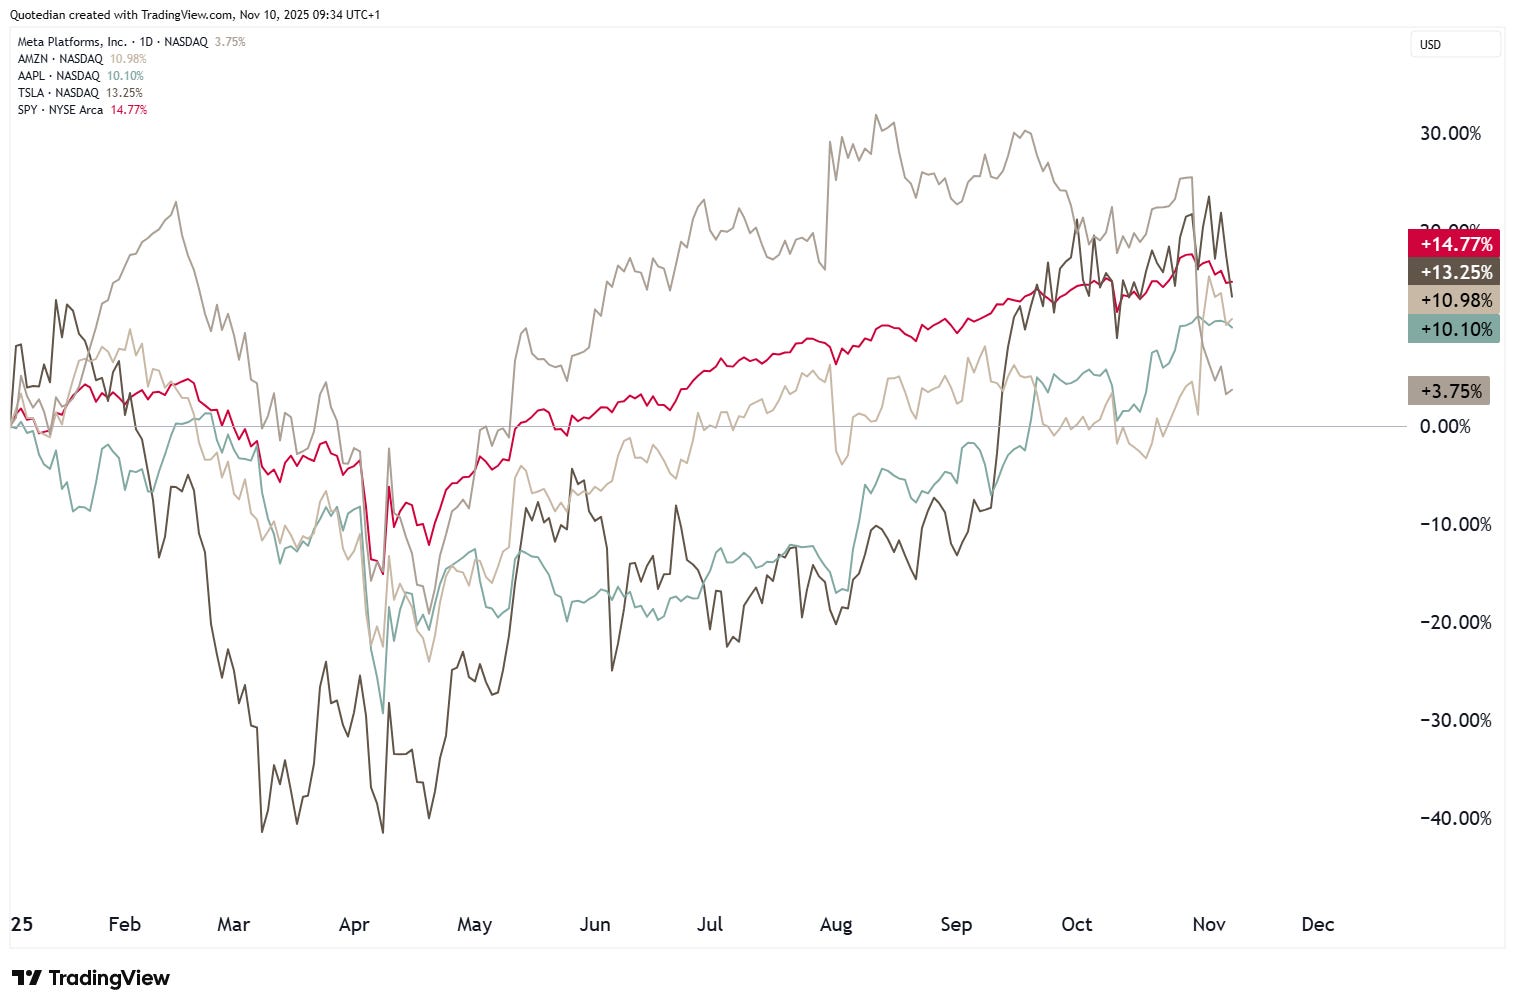
Maybe more of a tell-sign and an indication that switching to the X-Factor may not be the worst of ideas, is that of the Mag 7, four (AMZN, META, AAPL, TSLA) are performing less than the overall market (SPY, red) on a year-to-date basis:
Bitcoin (BTC, red) had been warning via a divergence (arrows) of an impeding sell-off possibility in tech stocks (QQQ, grey):
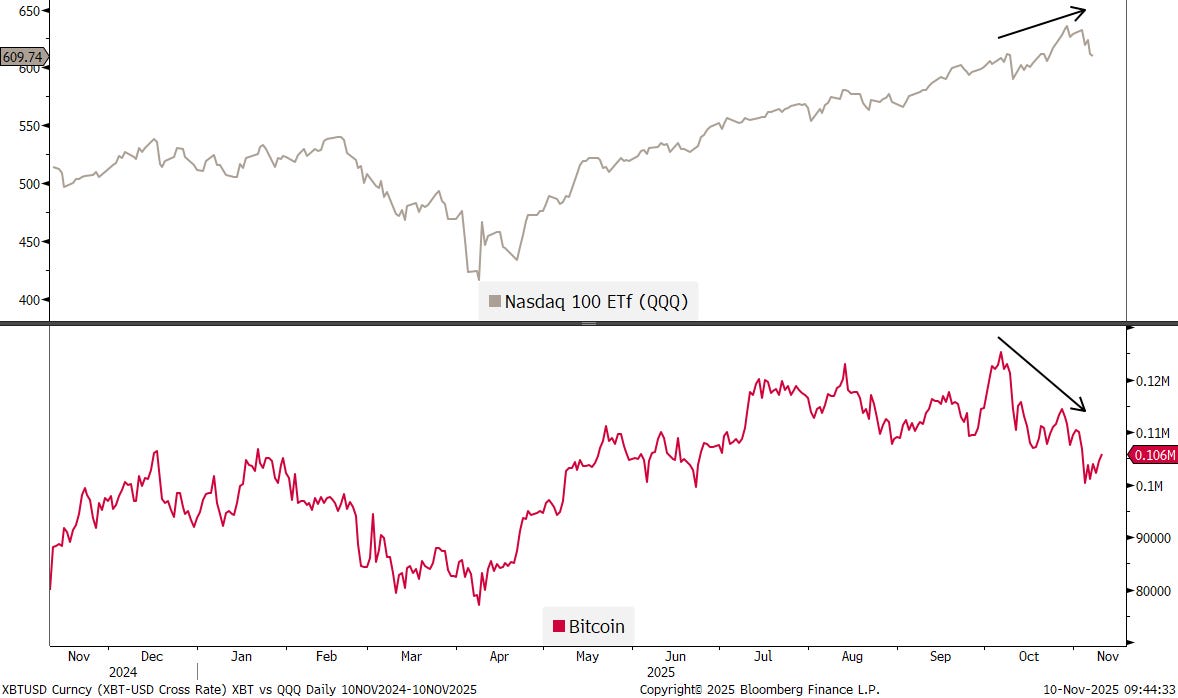
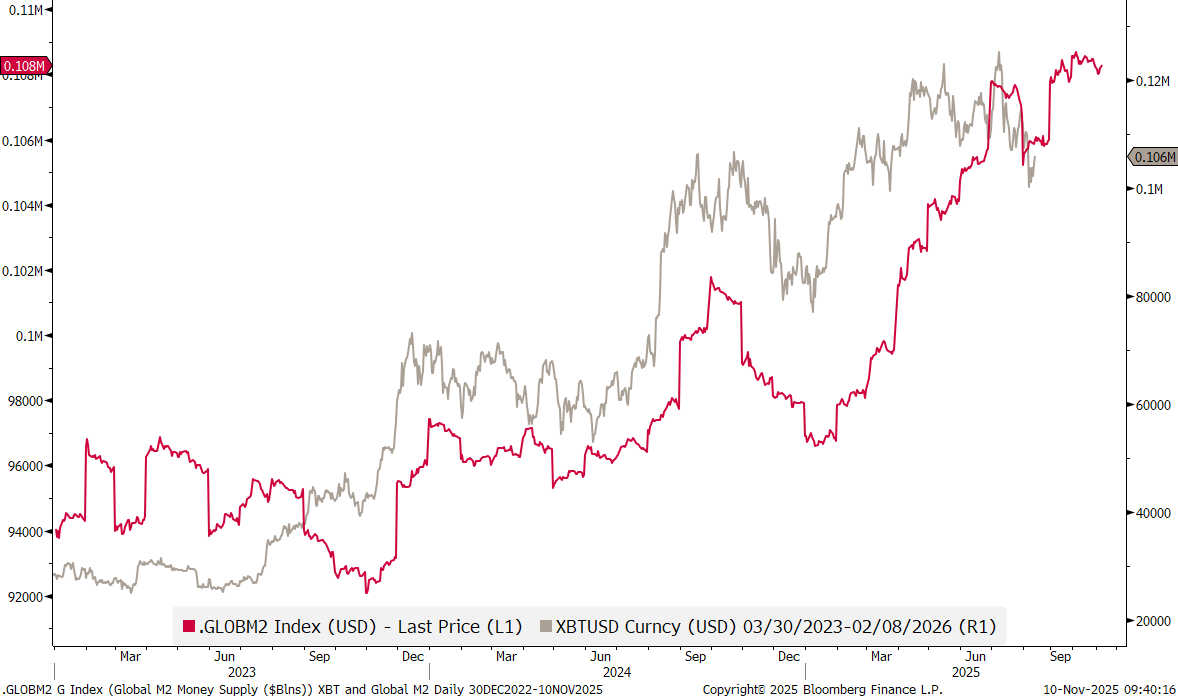
However, if the correlation between Bitcoin (grey below) and our proprietary Global liquidity indicator (red below) is to hold up, Bitcoin may soon move higher again:
Other, market derived indicators, such as the ratio between discretionary (XLY) and staples stocks (XLP),
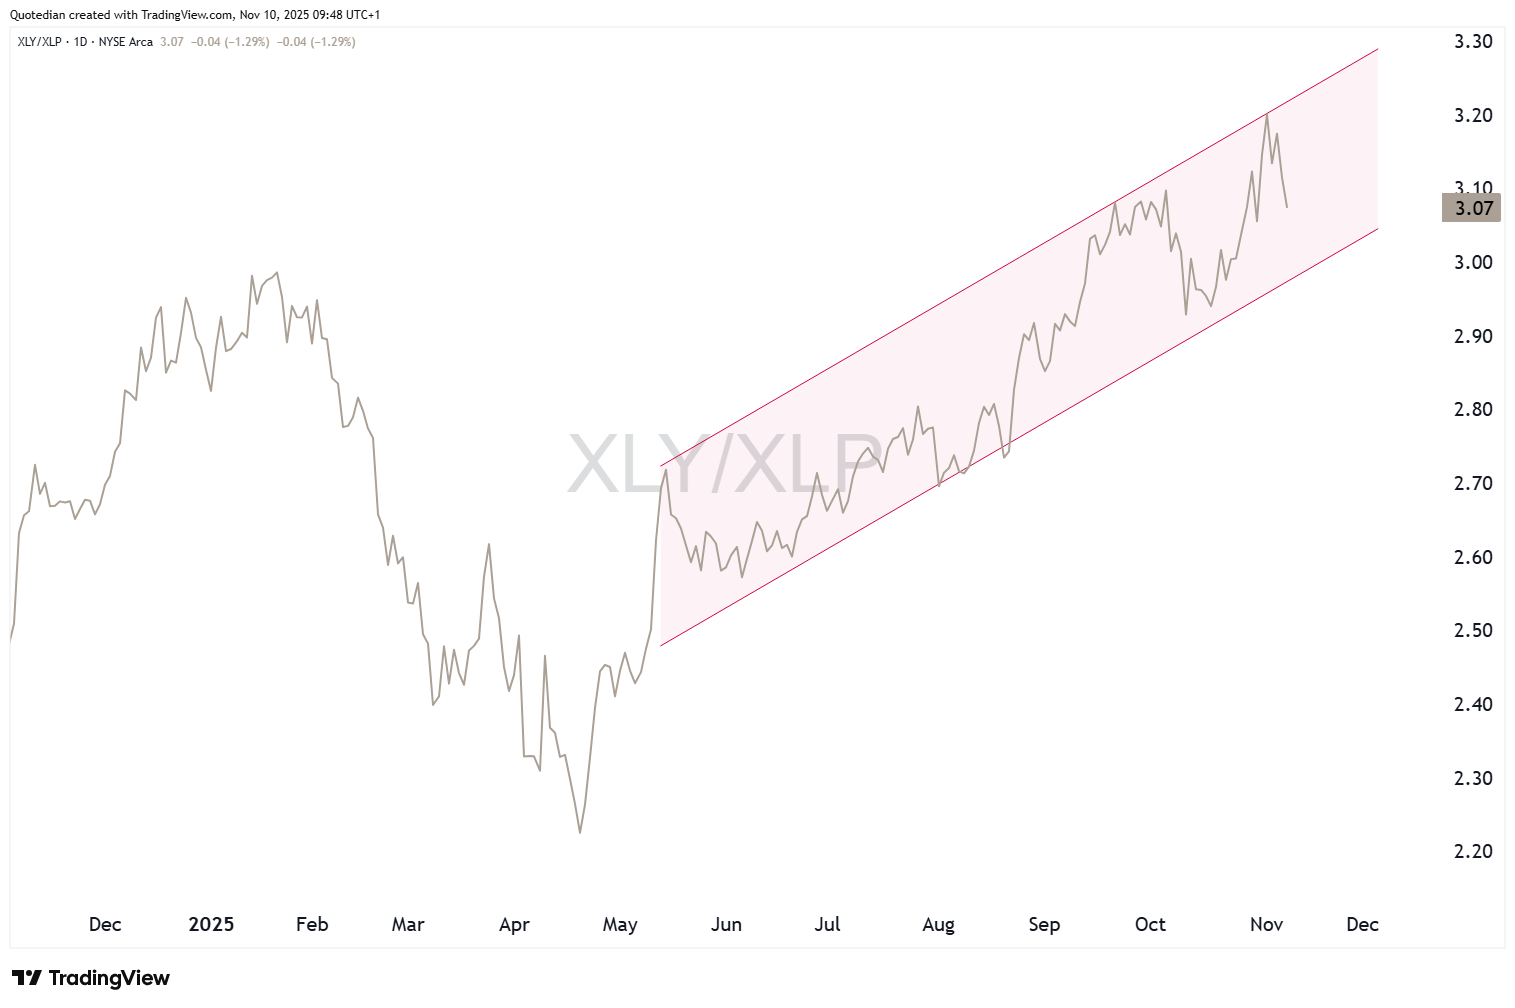
or the ratio between high beta (SPHB) and low volatility (SPLV) stocks,
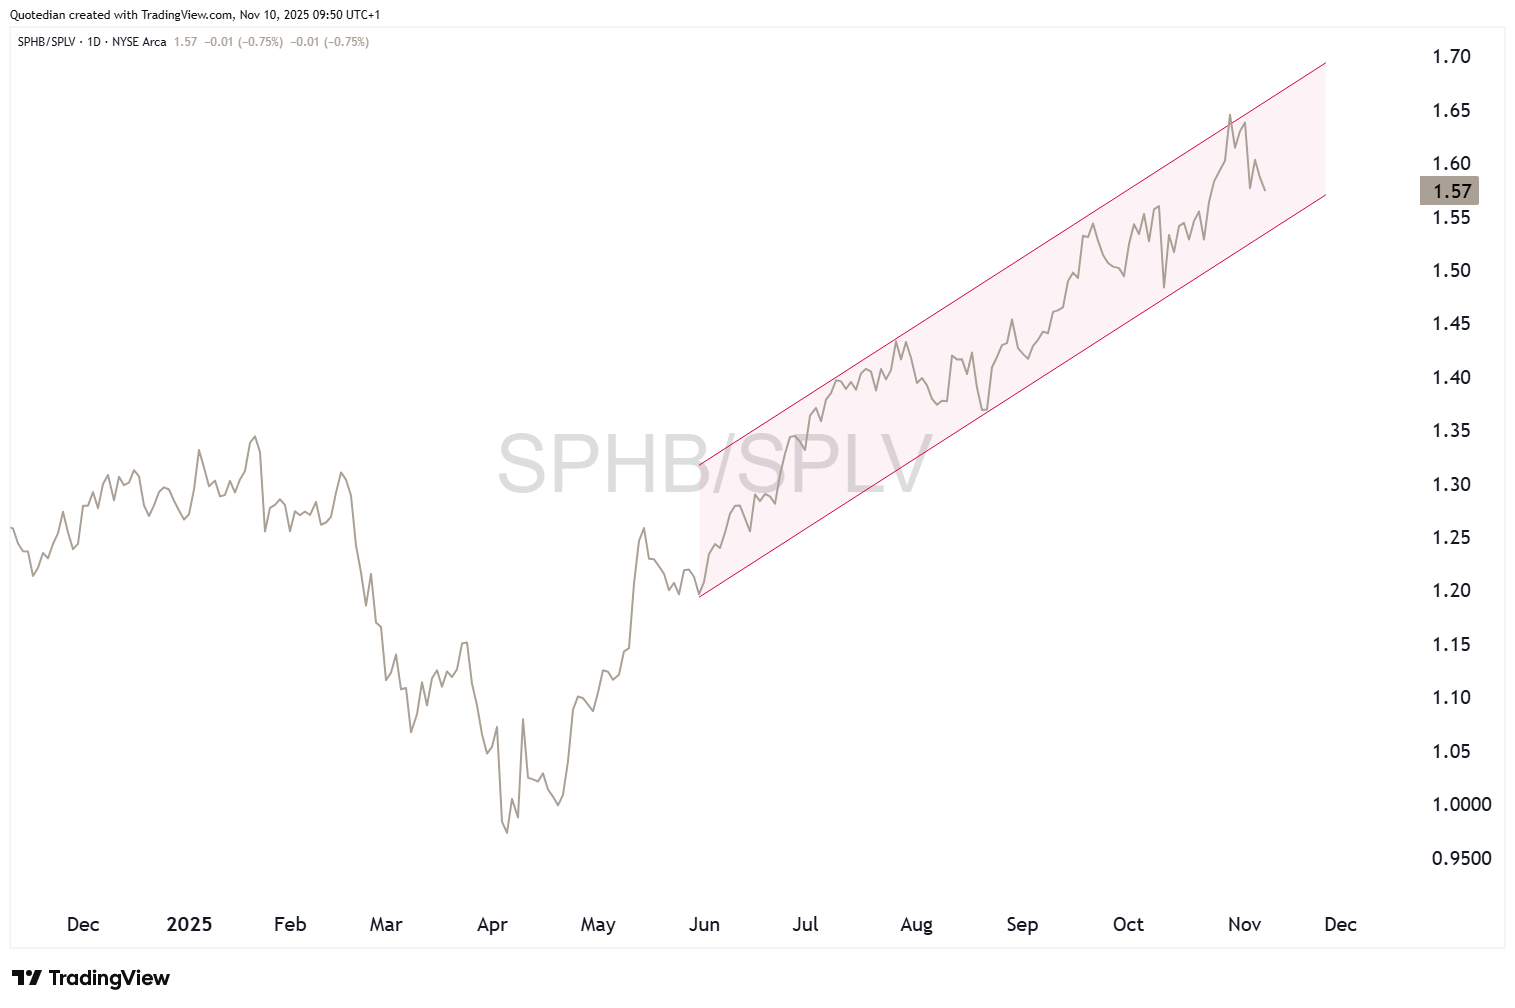
continue in their respective uptrends (red channels), i.e. have not given a reversal signal yet, and risk remains “on”.
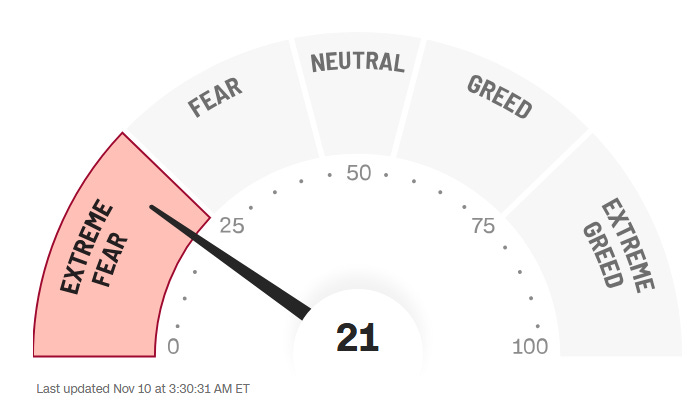
From a sentiment point of view, at least as indicated by CNN’s Fear and Greed index (click here for details), stocks may indeed have ‘hammered’ in a bottom on Friday:
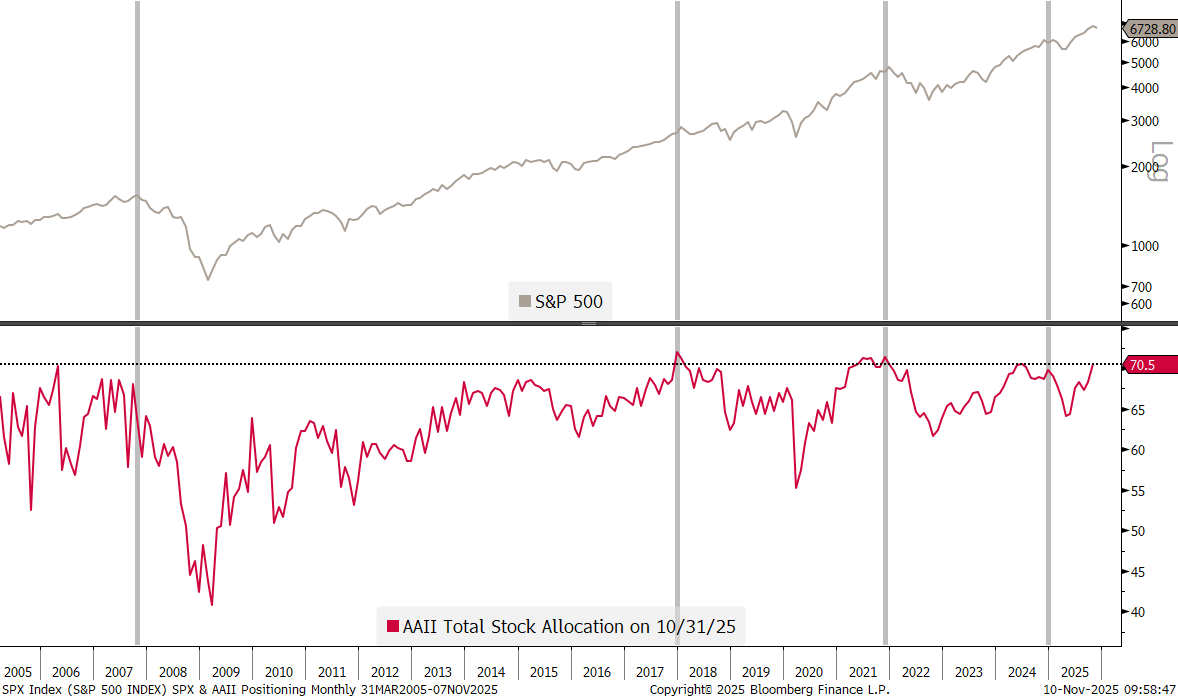
In stark contrast to this (short-term) sentiment indicator signalling fear amongst investors, stands the most recent monthly update of the American Association of Individual Investors (AAII - a retail investor association), which shows one of the highest allocation to stocks by retail investors over the past years:
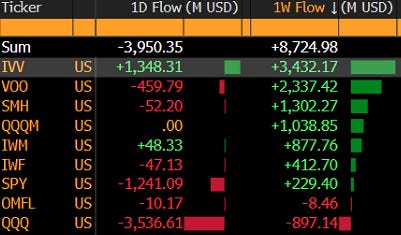
Down those same lines, we note that even if CNN’s market-data based indicator is flashing ‘extreme fear’ this is not necessarily how investors reacted during last week’s sell-off. The table below shows in- and out-flows into some of the most popular (US) equity ETFs, suggesting some healthy buying the whole week, with maybe a little of capitulation on Friday:
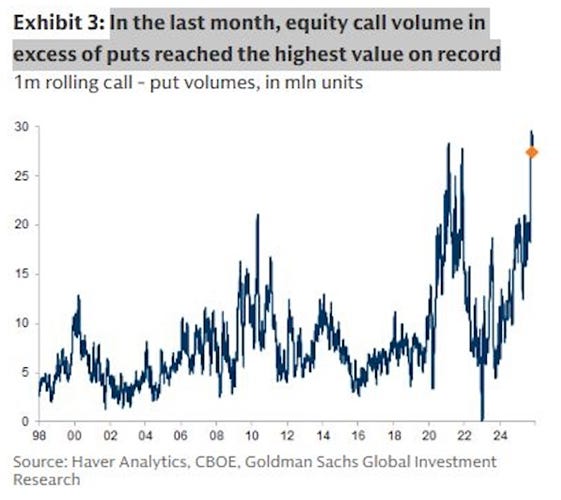
To “finalize” the bull-bear debate, here are two interesting, more bearish leaning charts, but none of them should be used as timing tool.
First, this call/put ratio chart from GS shows that investors are skewed towards call at one of the highest ratios ever:
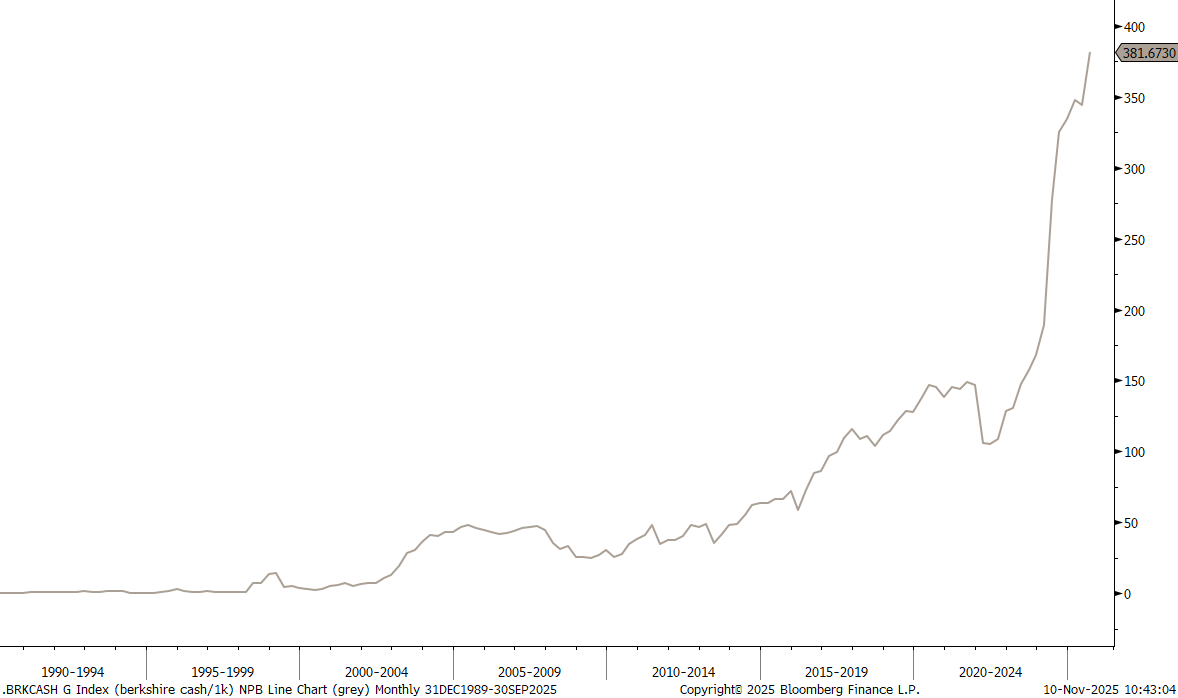
Secondly, it seems Mr Buffet has ran out of ideas or does not trust the current market environment - or both. Berkshire has now amased USD382 billion in cash, cash equivalents and US Treasury bills:
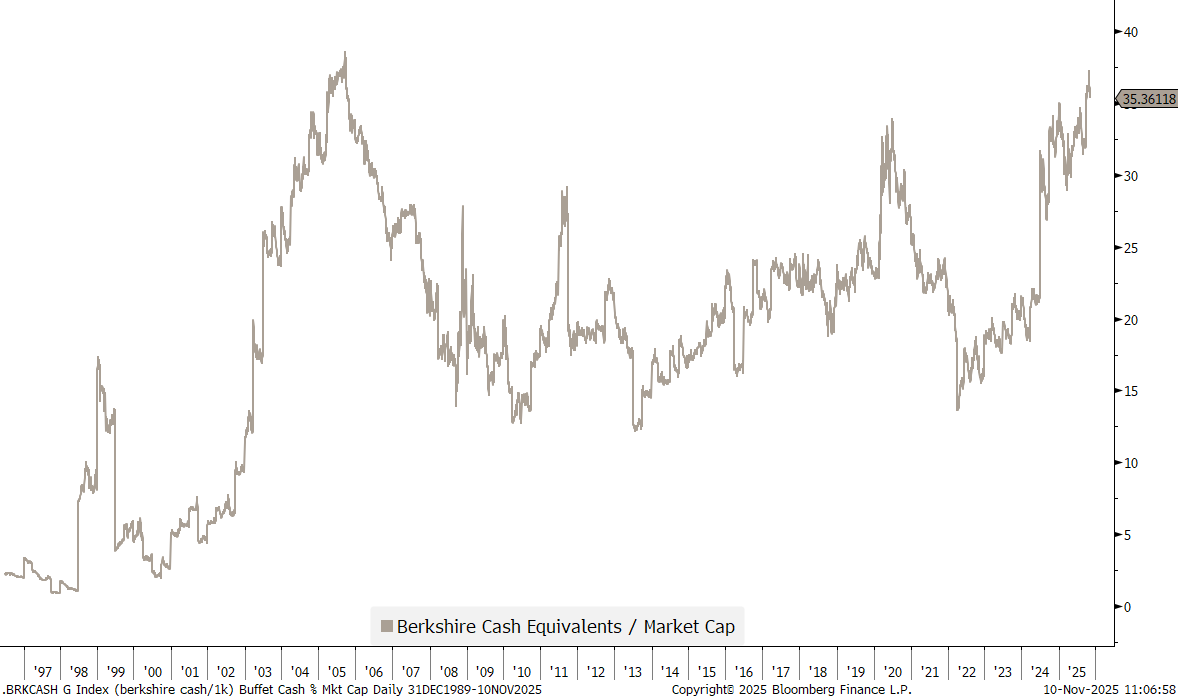
Which in relation to Berkshire Hathaway’s market cap is at about the highest since shortly before the GFC:
To wrap up the equity section for this week, here’s our usual glance at the best performing equities on a year-to-date basis and how they have fared over the past five sessions.
First, US large cap names:
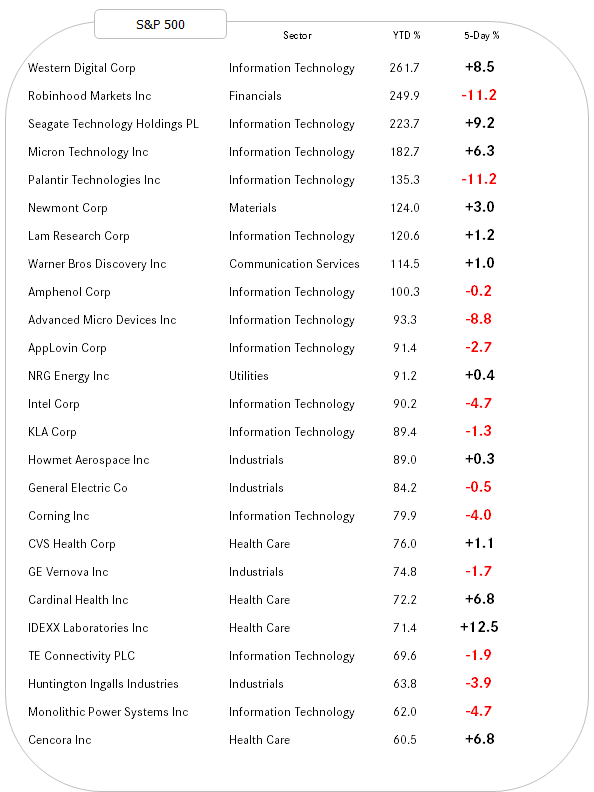
Quite precisely half of the stocks in the above table continued to add to their already healthy YTD gains last week. Those weaker on the week probably offer an interesting entry opportunity.
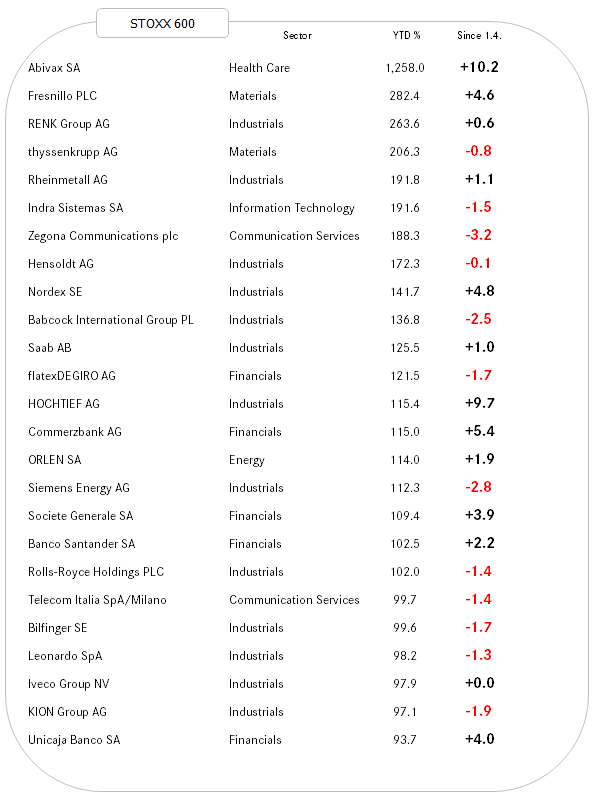
And we get a very similar winners/losers ratio for last week on European markets:

The AI/Mag 7/Hyperscaler trade discussed in the equity section is also gaining relevance in fixed income markets.
For example, consider this BofA chart, showing the pick-up in borrowing needs by some of the companies trying to be involved in the AI/data centre build out:
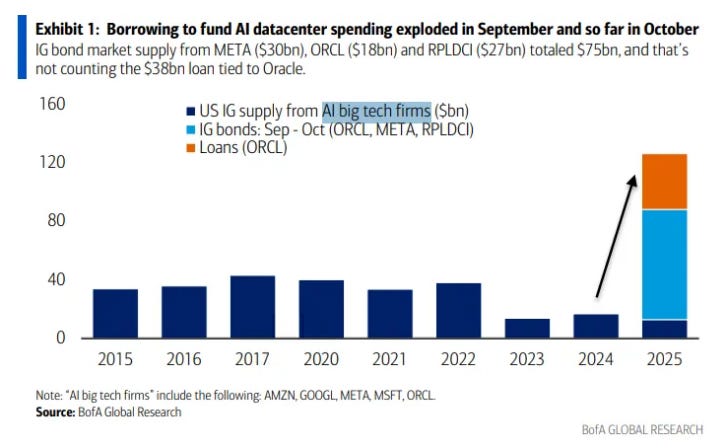
Massive comes to mind. Or shocking.
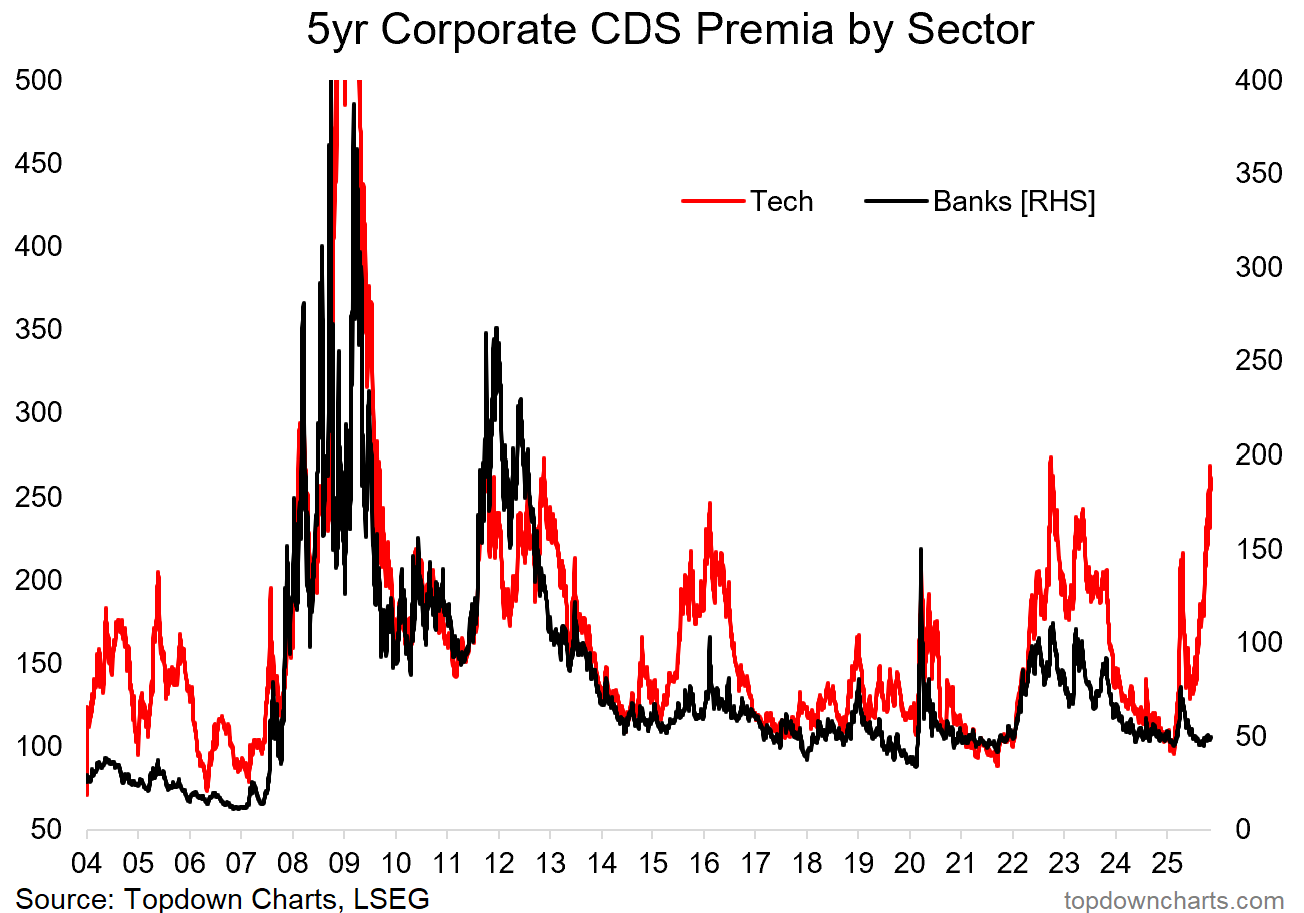
And the market did not take long to react to this increase in issuance, as demonstrated by the following chart:
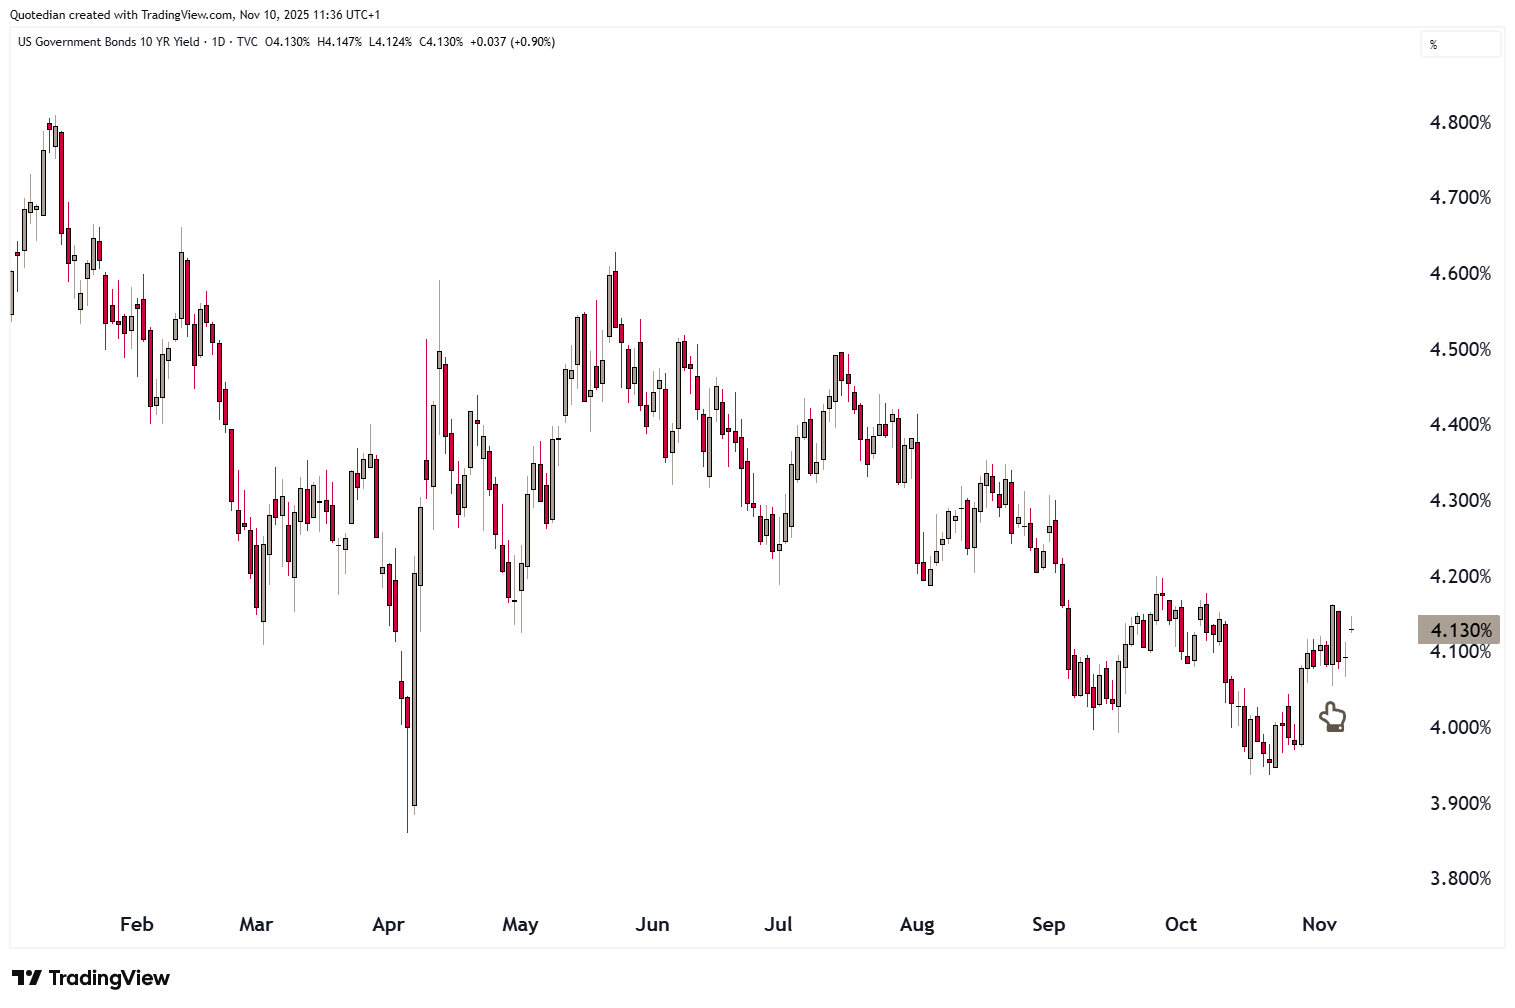
In the government bond market, US yields saw a jump higher last week, after the US Supreme Court considered the legality of Trump’s tariffs and a possible reversing of those would lead to less income for the US treasury. Here’s the cart of US 10-year treasury yield:
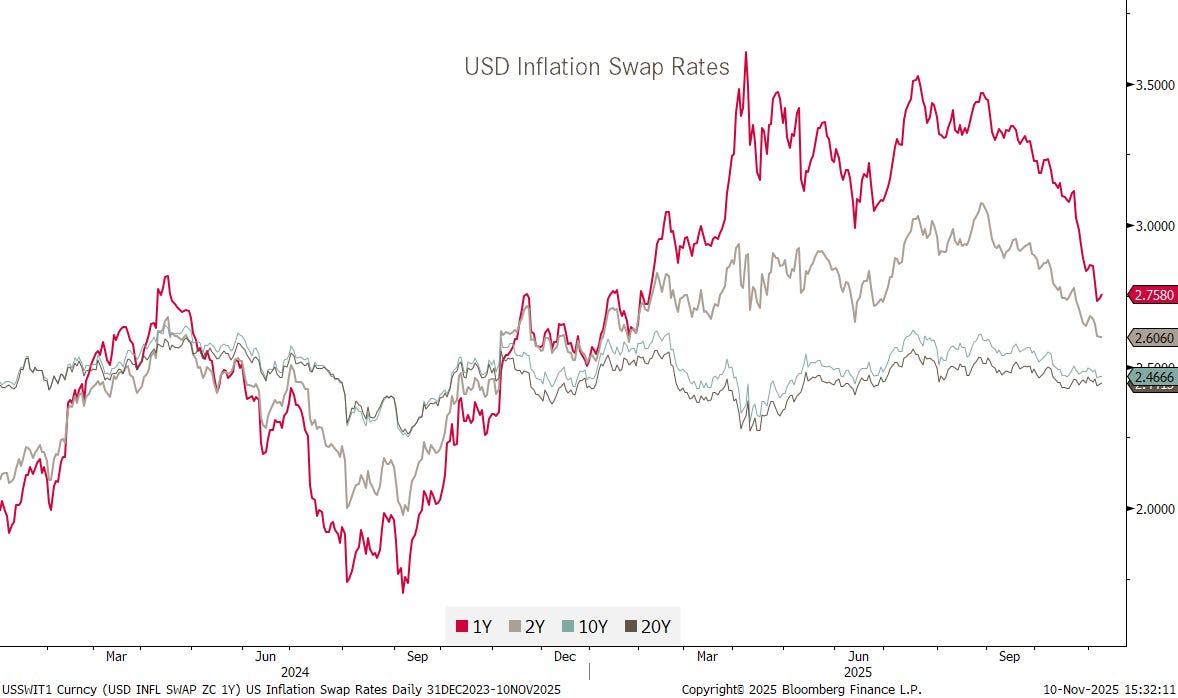
Contrary to the pick-up in yields related to “balance sheet” worries at the treasury described above, inflation expectations have actually been falling noticeably since late summer:
Two more charts to keep an eye on - not only for implications in the fixed income space:
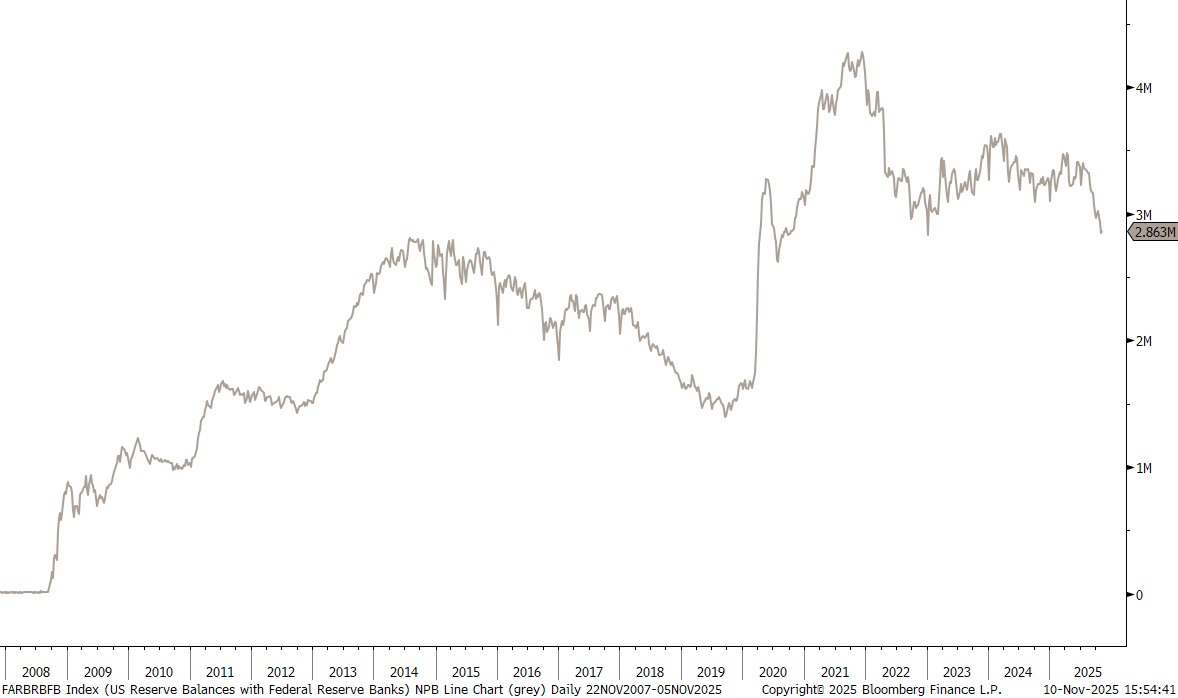
The US Reserve Balances with Federal Reserve Banks - this could be a bumpy ride until QT ends in December 1st:

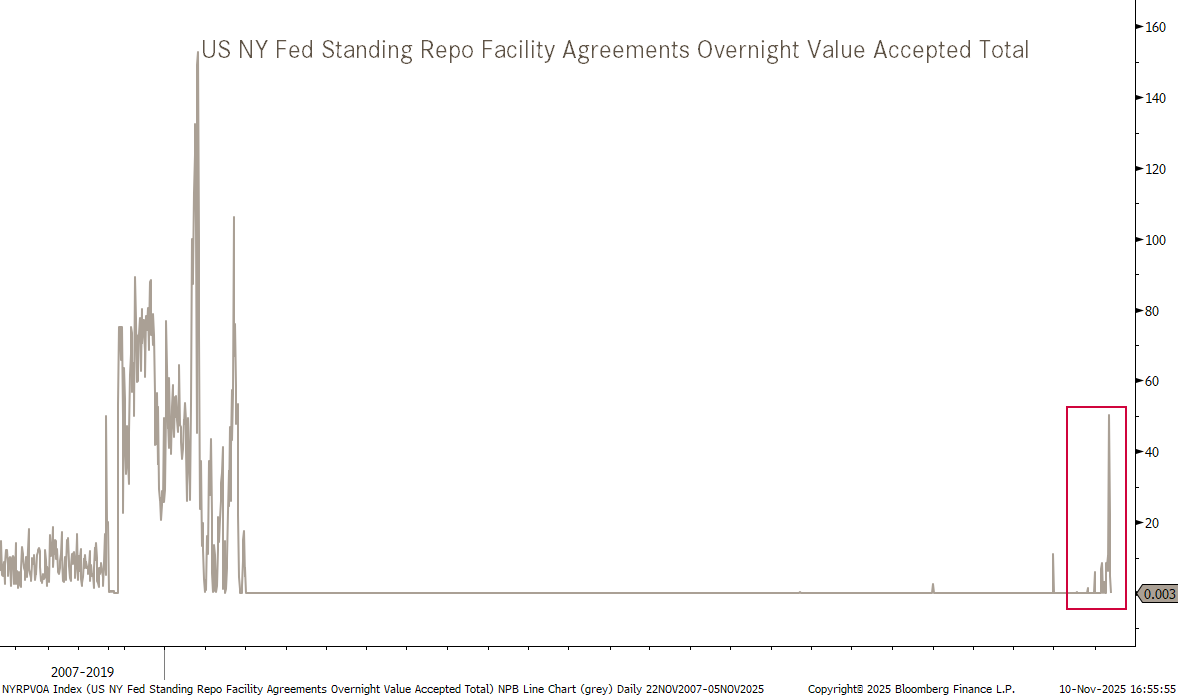
I am not a repo-specialist, far from it, but the recent ticks higher, first since 2020, could be an indication that something is wrong in the (US) financial plumbing world:


G10 currency markets were quiet over the past week or so,
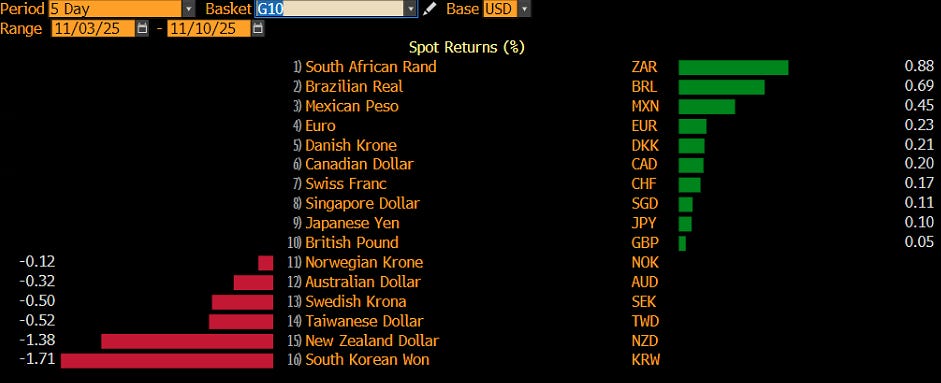
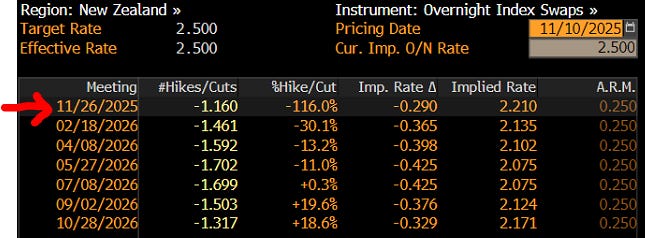
unless you have a vested interest in the New Zealand Dollar (NZD), which dropped to 7-month lows
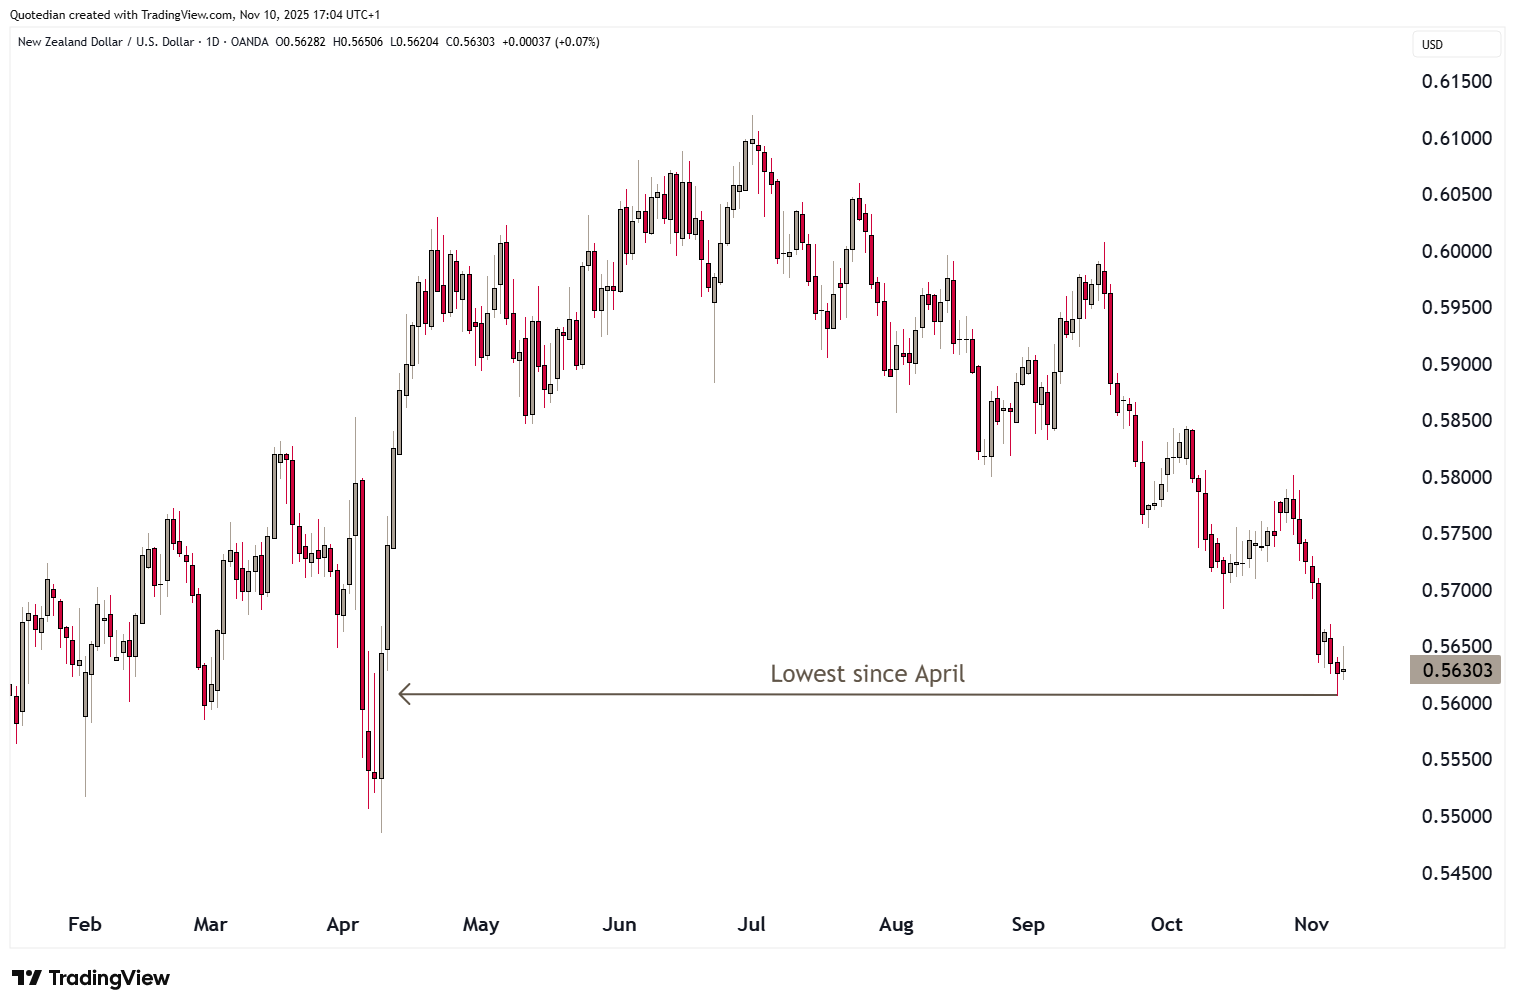
after data showed the jobless rate climbed to 5.3%, the highest in nine years, underscoring mounting economic weakness and increasing the chances for a 25 basis point rate cut later this month:
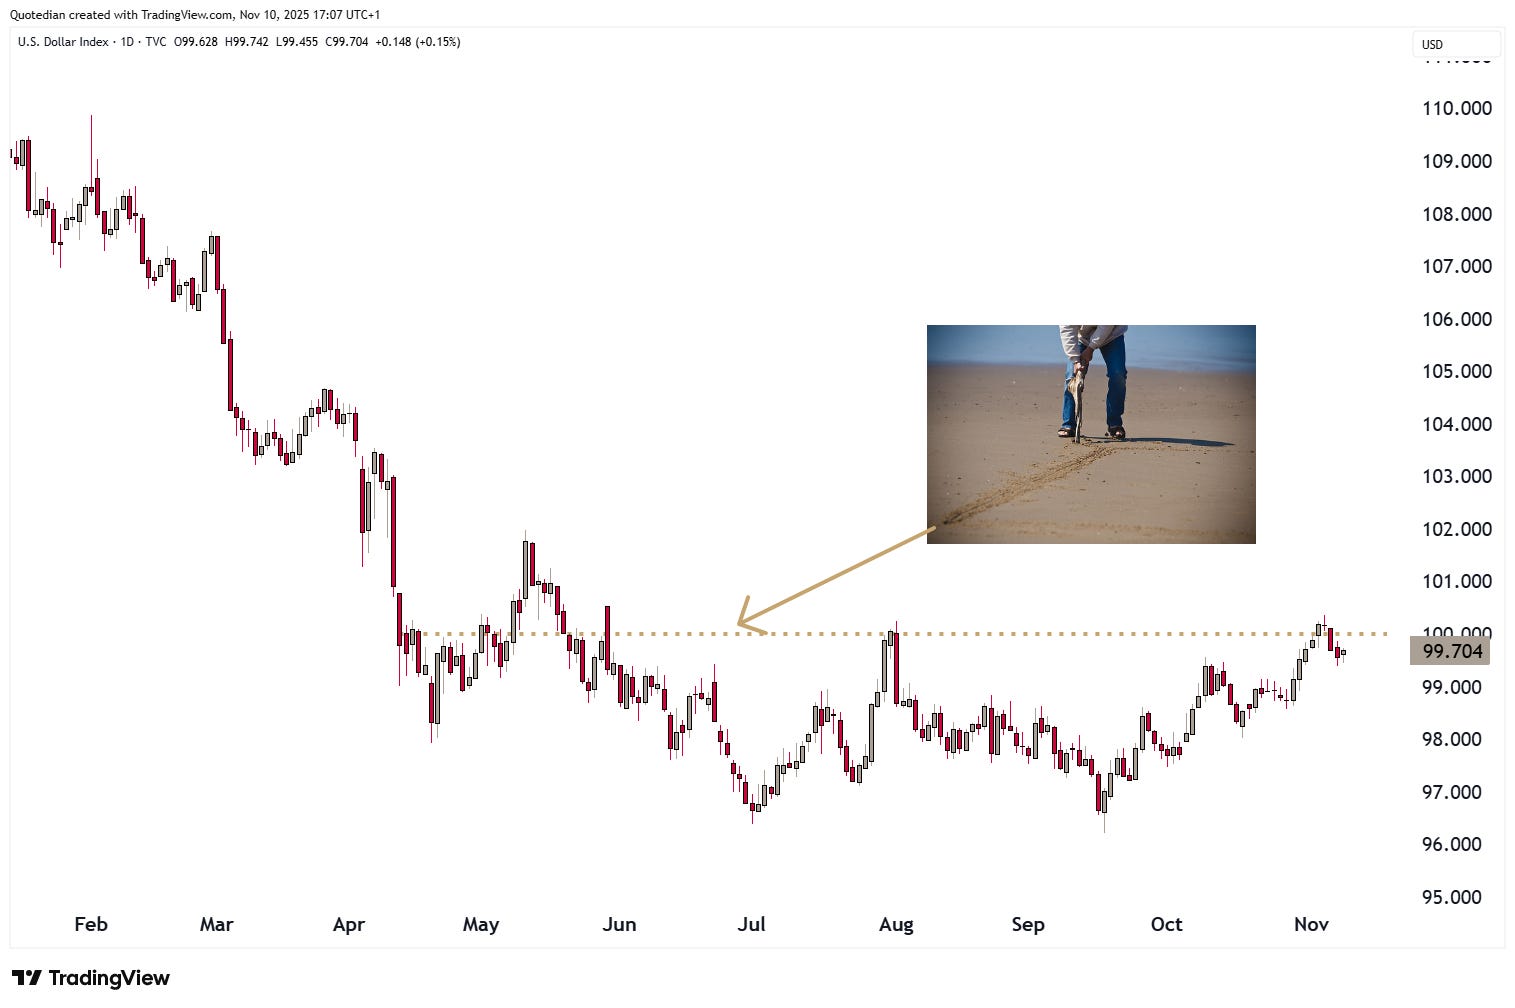
The Dollar Index itself briefly moved above our “line in the Sand” (aka key resistance), where we would have to review our bearish outlook on the Greenback, but failed to hold above and has been retreating again over the past few sessions:
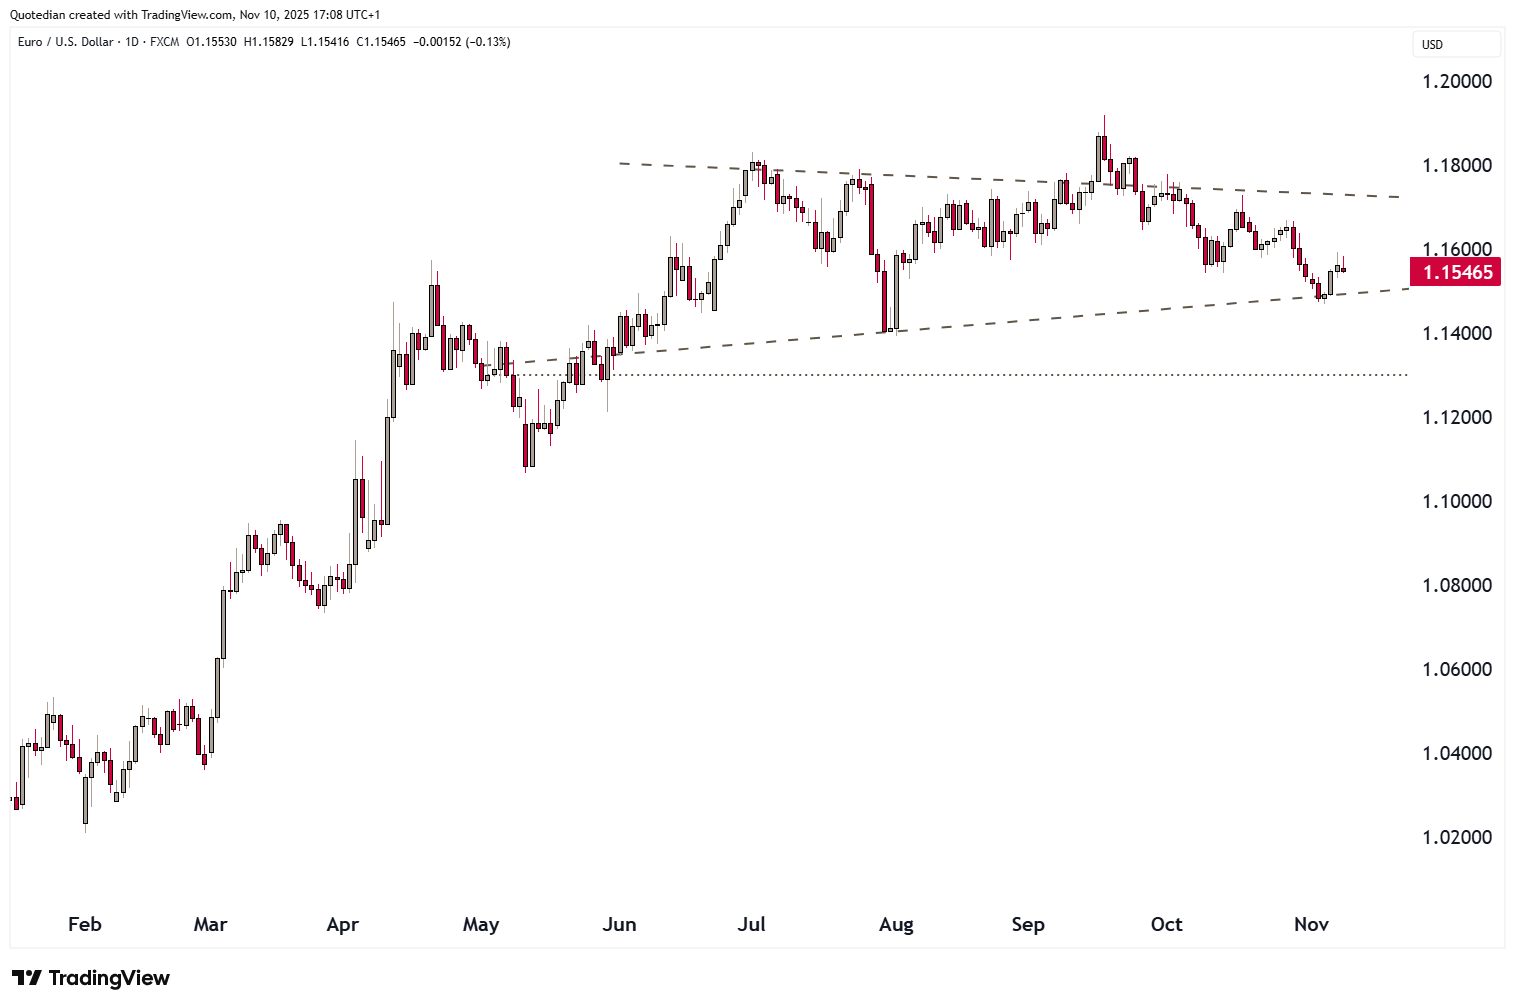
The EUR/USD cross also rebounded where it had to (dashed line), but even a break there would not make us bearish on the currency pair, unless 1.1300 (dotted line) gives:
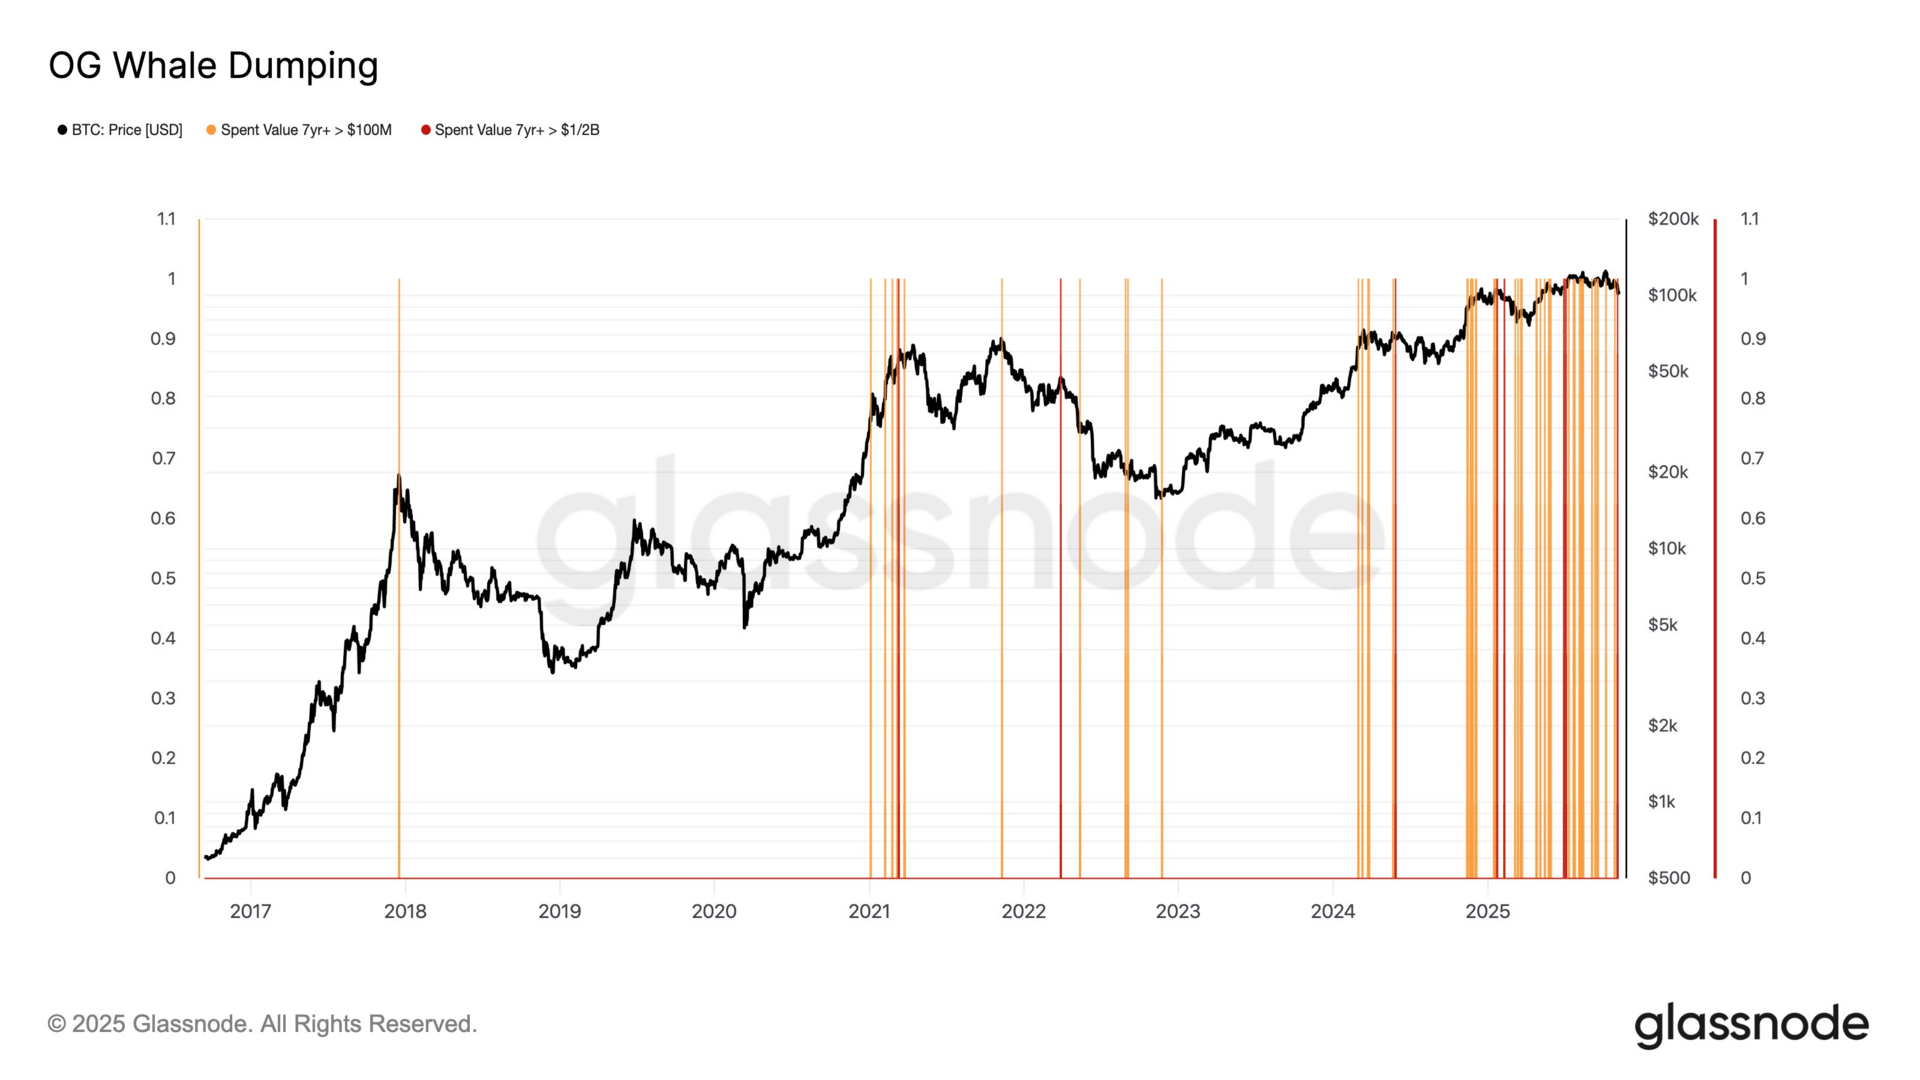
In the equity section above we showed a chart which made a bullish argument on Bitcoin, based on increasing global liquidity.
The counterargument (it is never easy, isn’t it) would be the chart below, which shows OG Whales (Original Gangsters, i.e. early large Bitcoin holders) have been increasingly dumping the Bitcoin positions (click here for story):
We’ll keep it simple here … as usual…
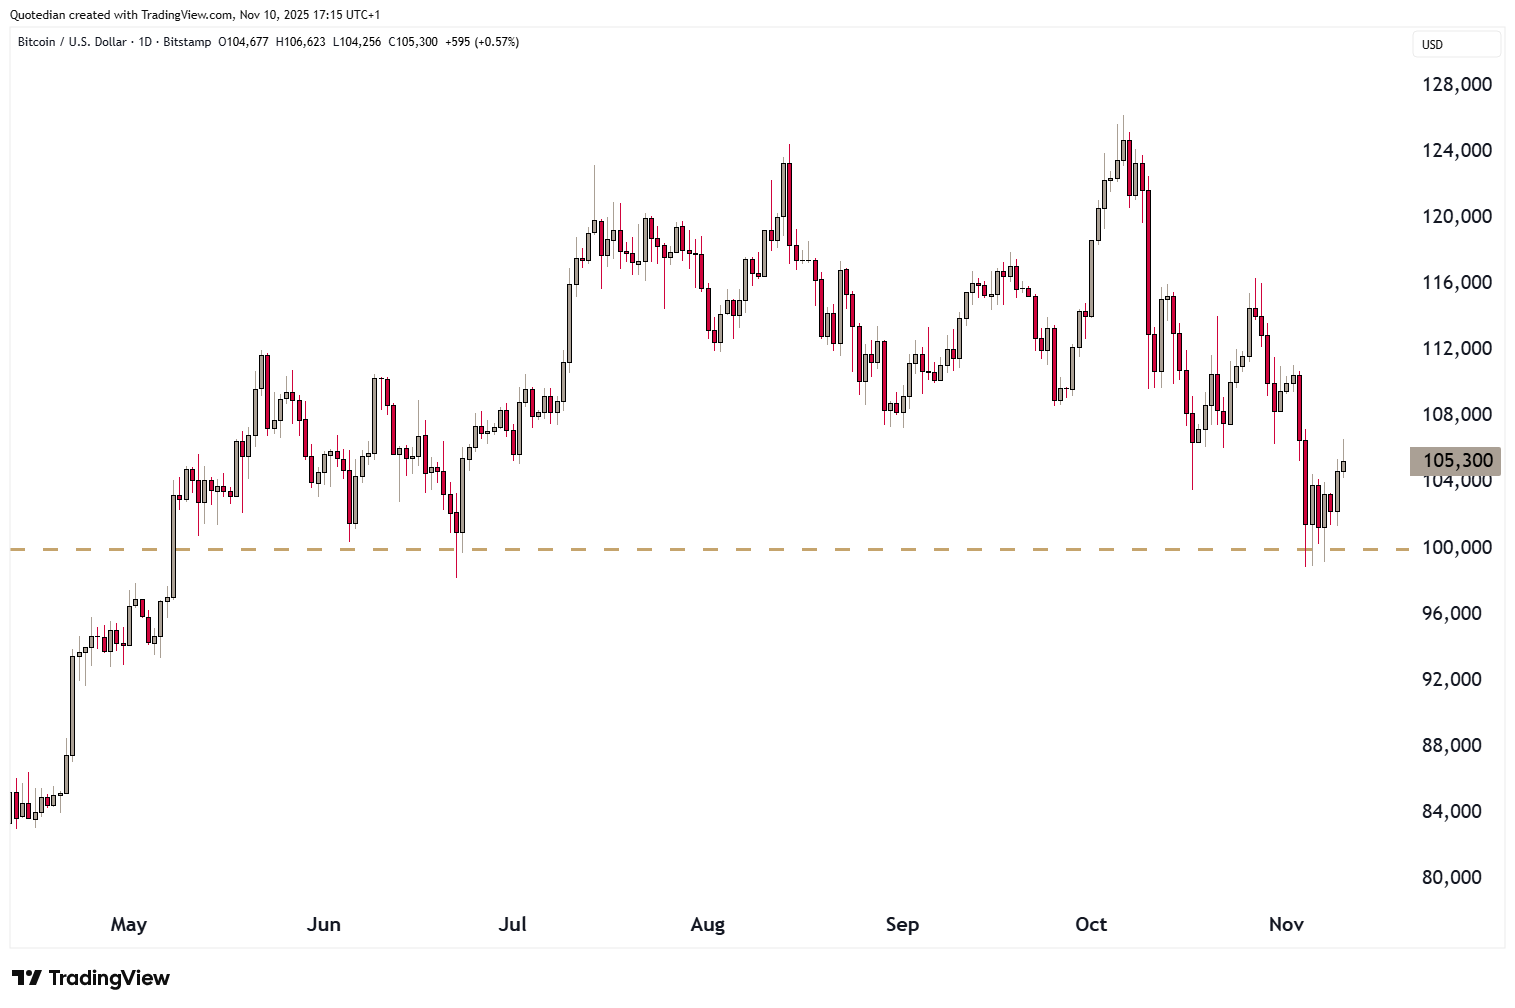
XBT/USD =>100k … stay long
XBT/USD <100k … danger of drop to 75k, underweight

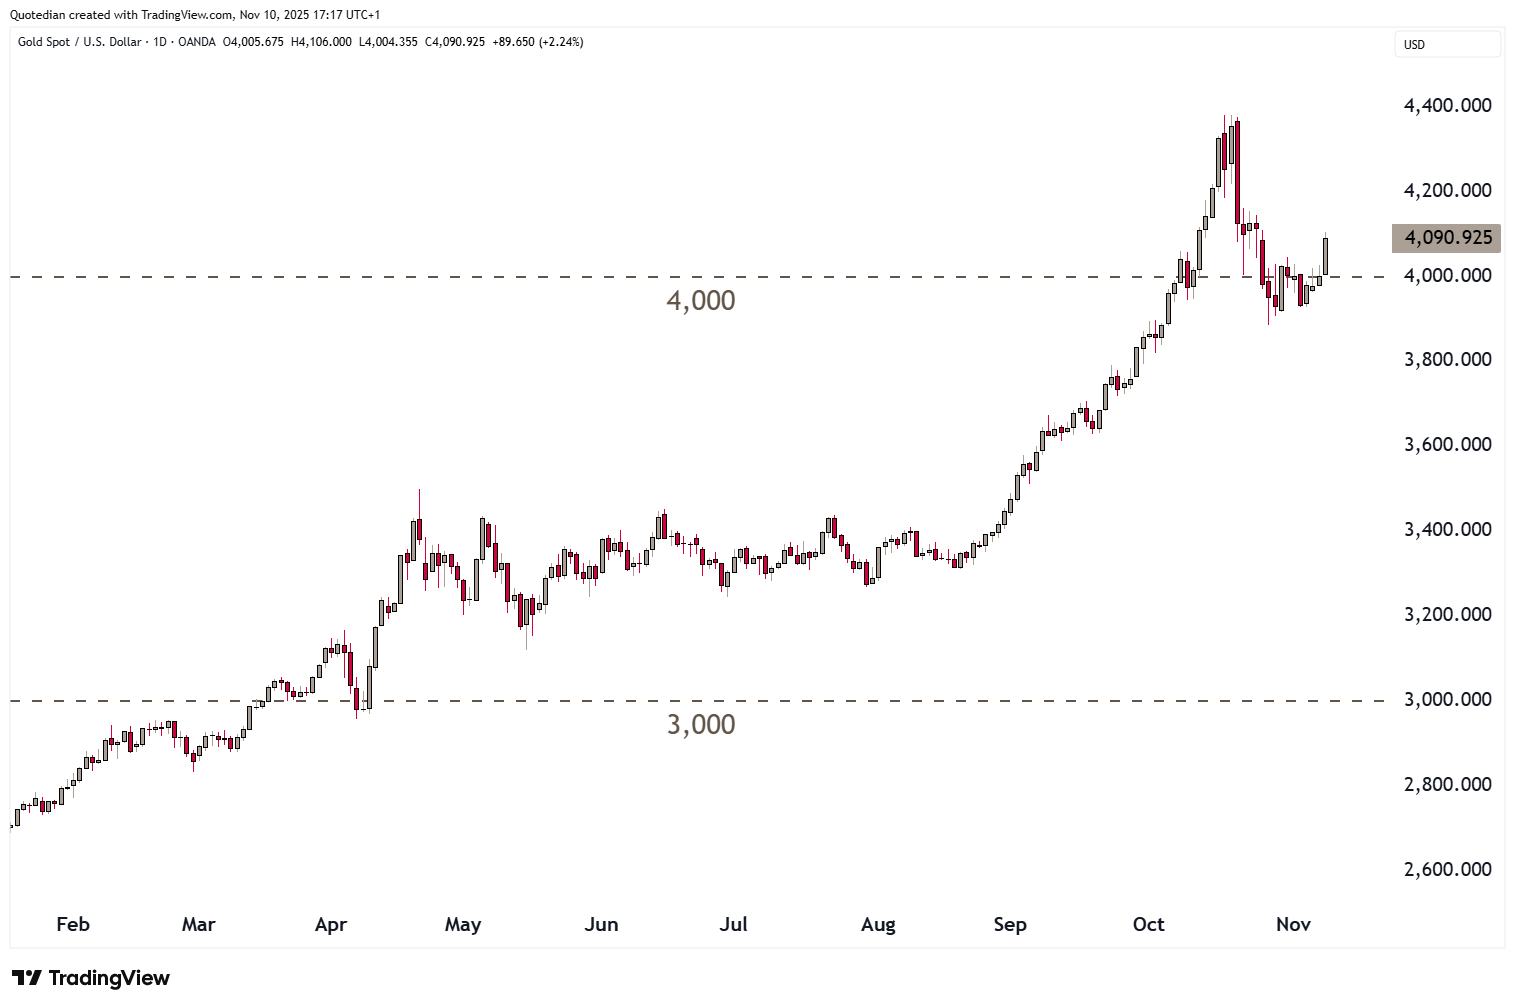
Is the correction in Gold already over? I think so:
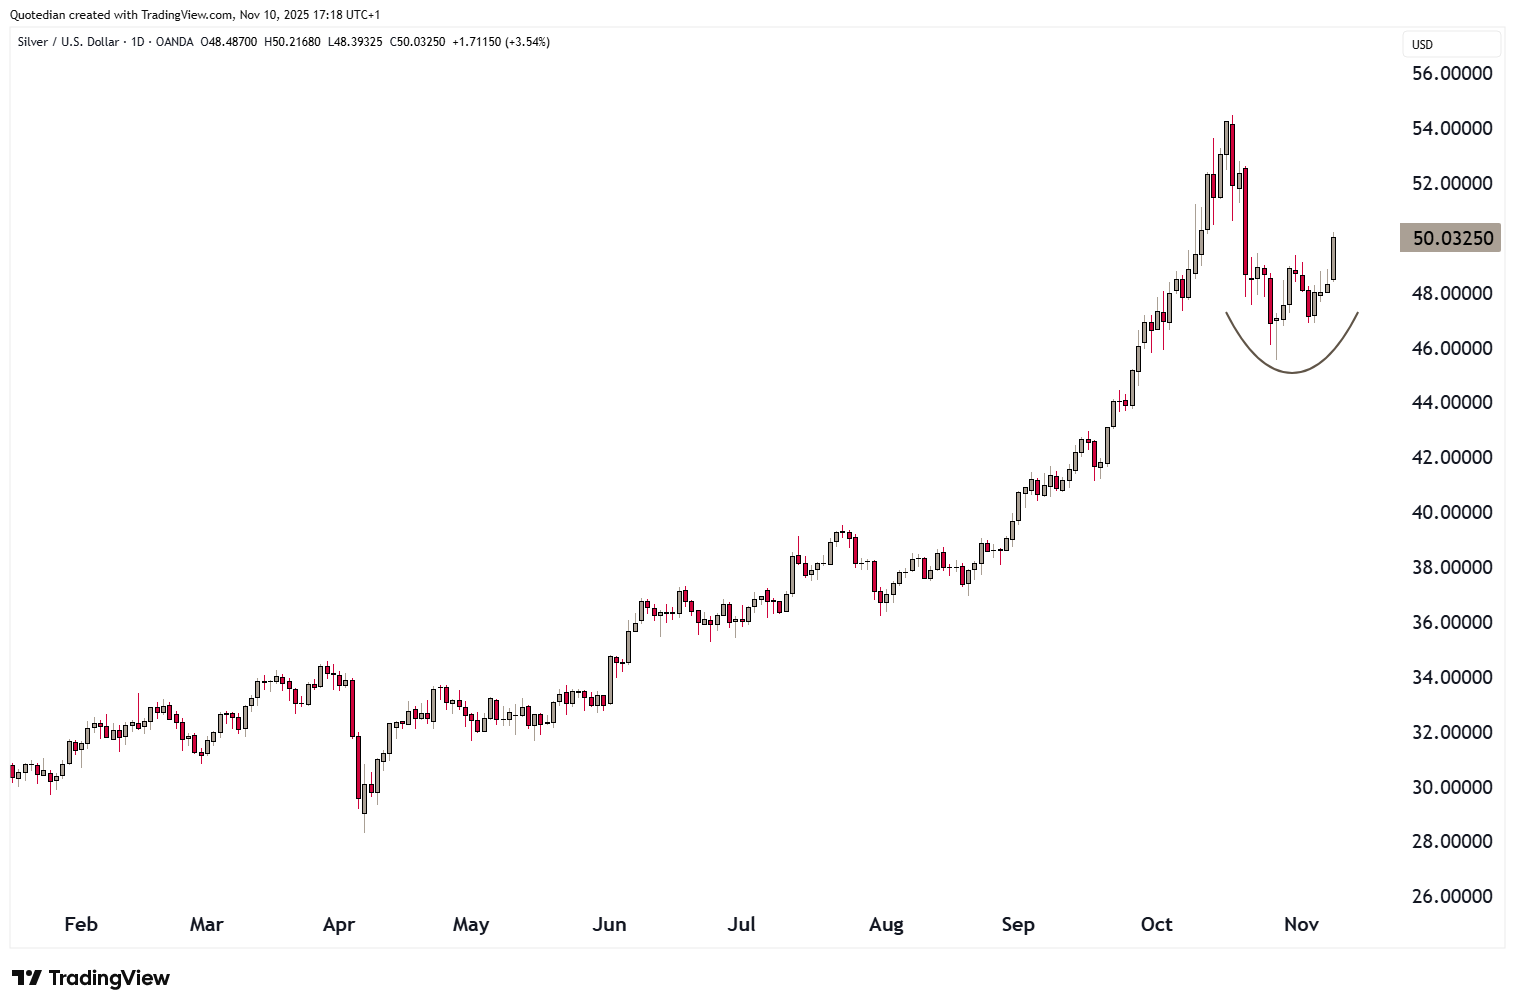
Ditto for Silver:
And one more - do not count out (crude) oil just yet … but more on this in a QUICQ to come later this week …. YES, teaser alert!

Have a great week,
André

In reality, you need no other Disclaimer than the one above, but just in case:
Everything in this document is for educational purposes only (FEPO)
Nothing in this document should be considered investment advice
Investing real money can be costly; don’t do stupid shit
Leave politics at the door—markets don’t care.
Past performance is hopefully no indication of future performance
The views expressed in this document may differ from the views published by Neue Private Bank AG