Think Again
Vol VIII, Issue 7 | Powered by NPB Neue Privat Bank AG
“It ain't what you don't know that gets you into trouble. It's what you know for sure that just ain't so.”
— Mark Twain
Enjoying The Quotedian but not yet signed up for The QuiCQ? What are you waiting for?!!
So you heard about that possibility of peace talks between Russia and the Ukraine, brokered by Trump & the Gang. What was your first though?
Those f…ing Russians!
That cheeky Zelensky!
That gr&@%!!# Trump!
Poor Europeans …
Any of those?
Well, THINK AGAIN, because what you should have thought is (note that invasion date (ID) = 24/2/2022):
Access to cheaper Gas again —> Who will profit?
Energy intensive companies in Germany, such as BASF, Laxess, Wacker Chemie, othersReconstruction of Ukraine —> which construction companies should I buy?
Construction companies, preferably in close by countries, such as Strabag, Wienerberger, othersDefense companies —> less (or more) needed?
Time to sell Rheinmetall (up 460% since ID), Leonardo (up 350% since ID), othersMany other connected long & short thoughts …
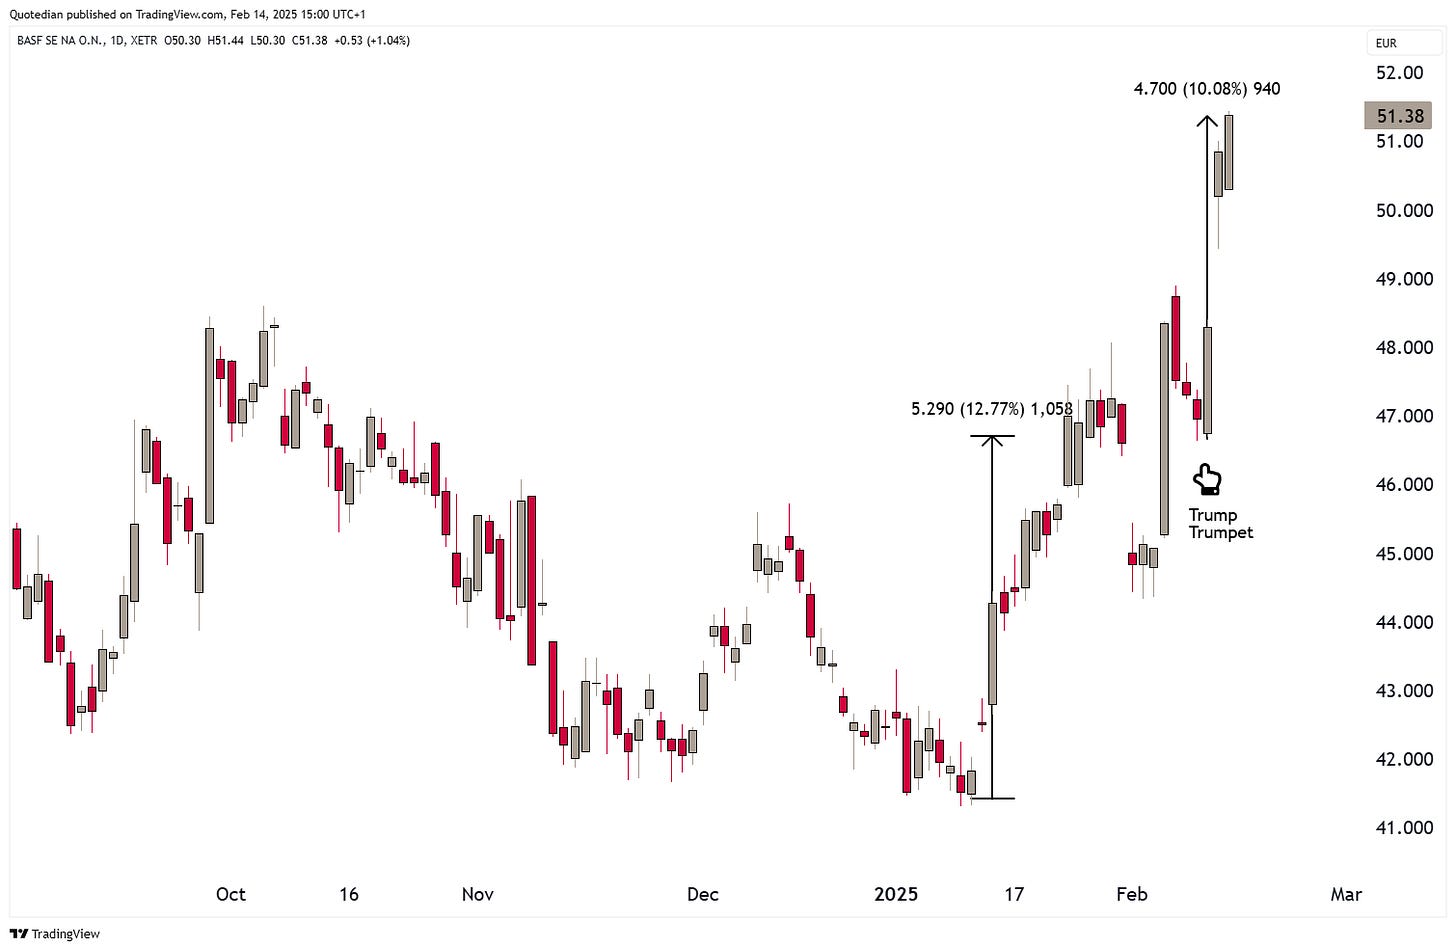
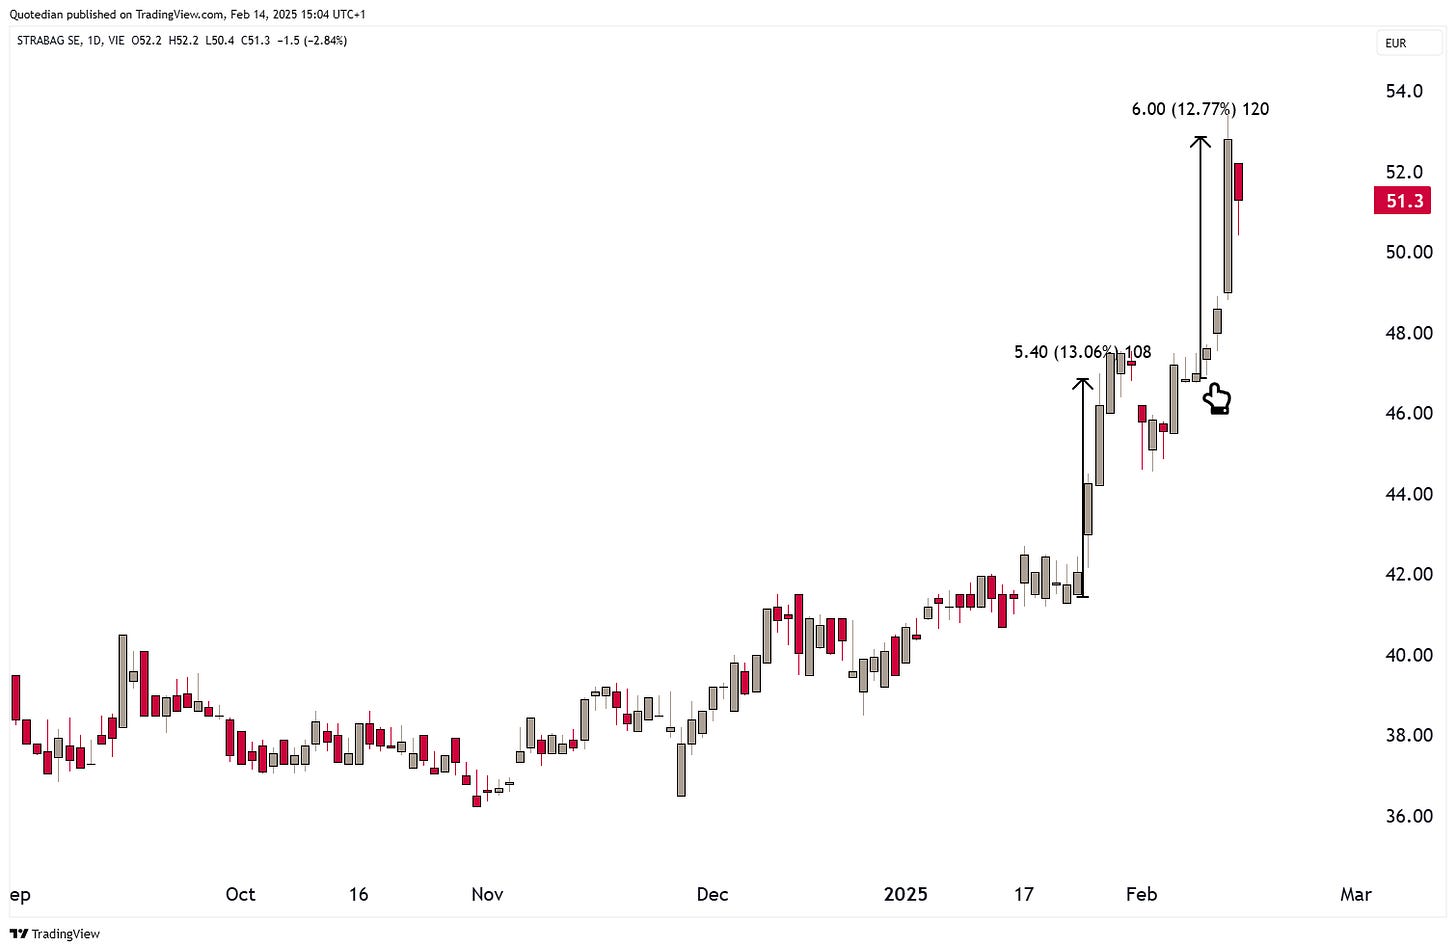
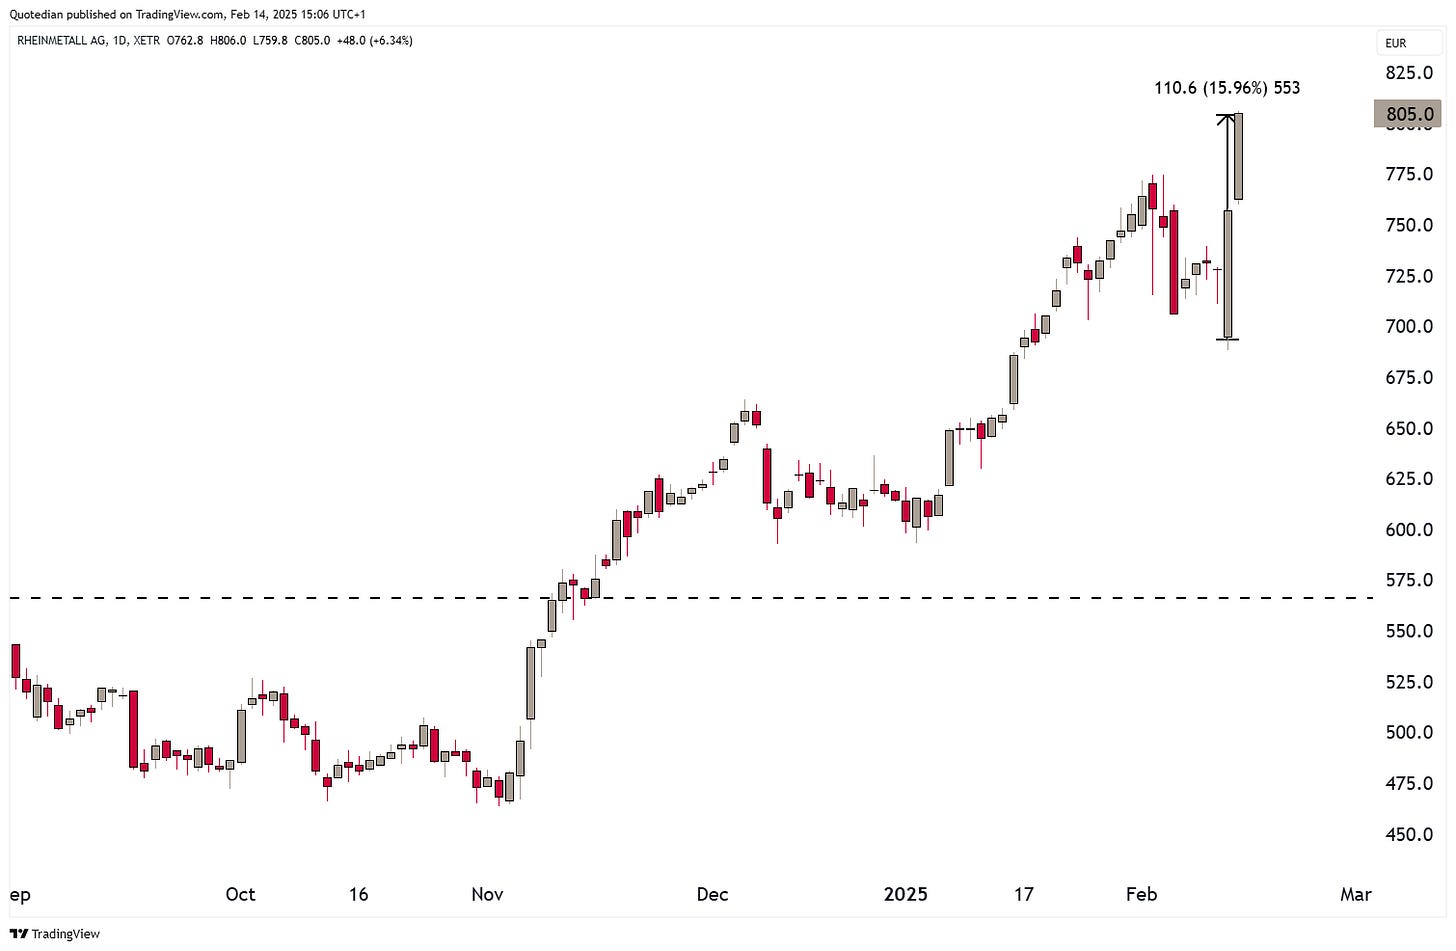
Ok, now let’s go and check one example in each category to see what price is telling us, and worse, what it has been screaming at us for days if not weeks (pointed hand on the following chart is when (Tuesday, 11.2.) Trump blew his, well, trumpet on possible peace talks):
Cheap(er) Energy - BASF
Up 10% since TT (Trump Trumpet), but, and it is a BIG BUT, up already 13% before that since mid-January.
Reconstruct Ukraine - Strabag AG
Up 13% since TT, but another BIG BUT, also up already 13% prior to that since early February.
Take profit on Defense stocks - Rheinmetall AG
First big down, then big up (16%) since TT. No, don’t take profit, market is saying Europe will need to spend more, not less on defense.
So, here’s finally my point for today then: The market started sniffing out an announcement of possible peace talks well before the Trump Trumpet on 11.2.
Price leads narrative.
That’s why in our market research efforts here at NPB Neue Private Bank price is not the only input into our decision process, but with a difference THE most important one!
Onwards …
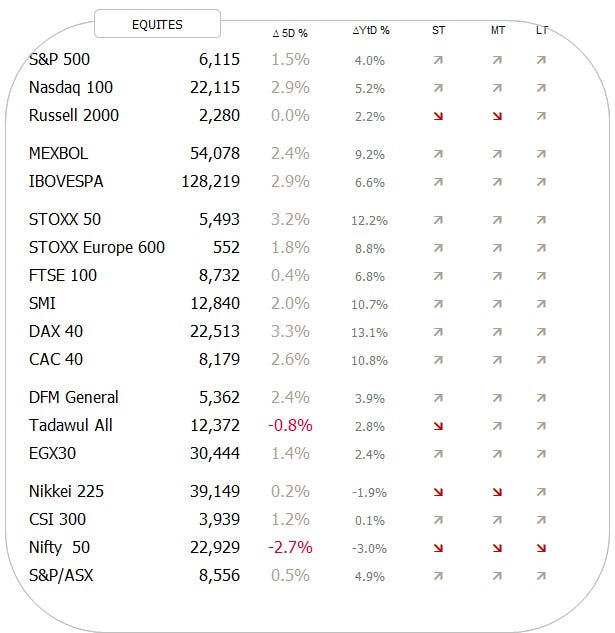
Starting with equities, we note that except the Indian stock market, all other major global indices are in long-term uptrends (foremost column to the right):
But let’s take it in order …
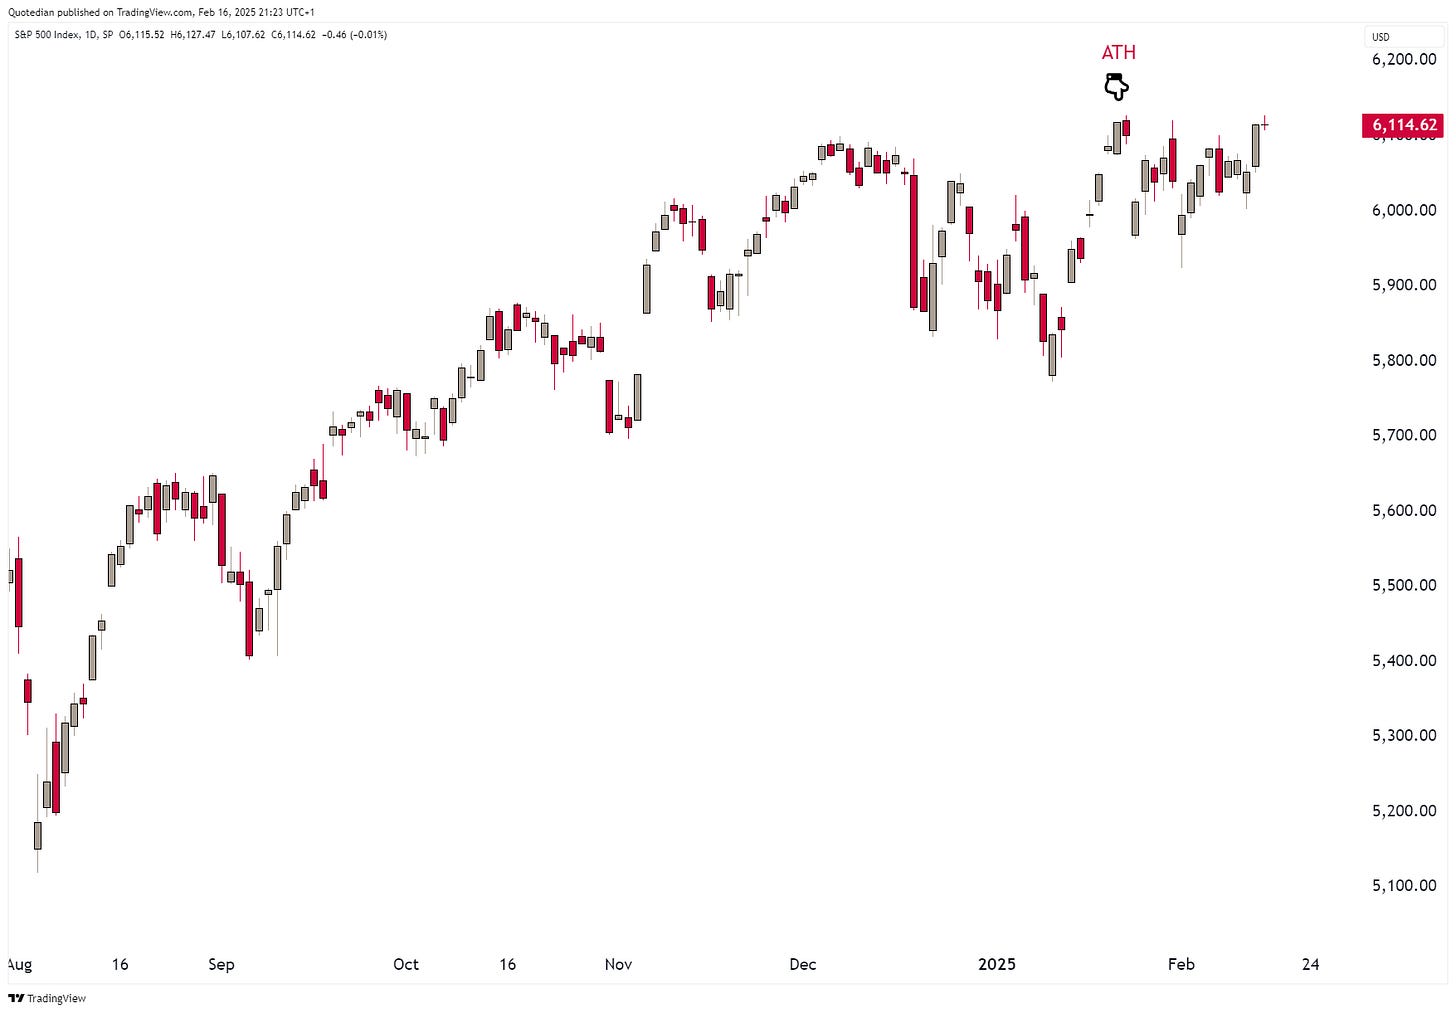
The S&P still has not quite managed to put in a new all-time high (ATH):
This is the easiest trade on earth. Buy the breakout, which seems likely, but don’t add to risk before that break higher.
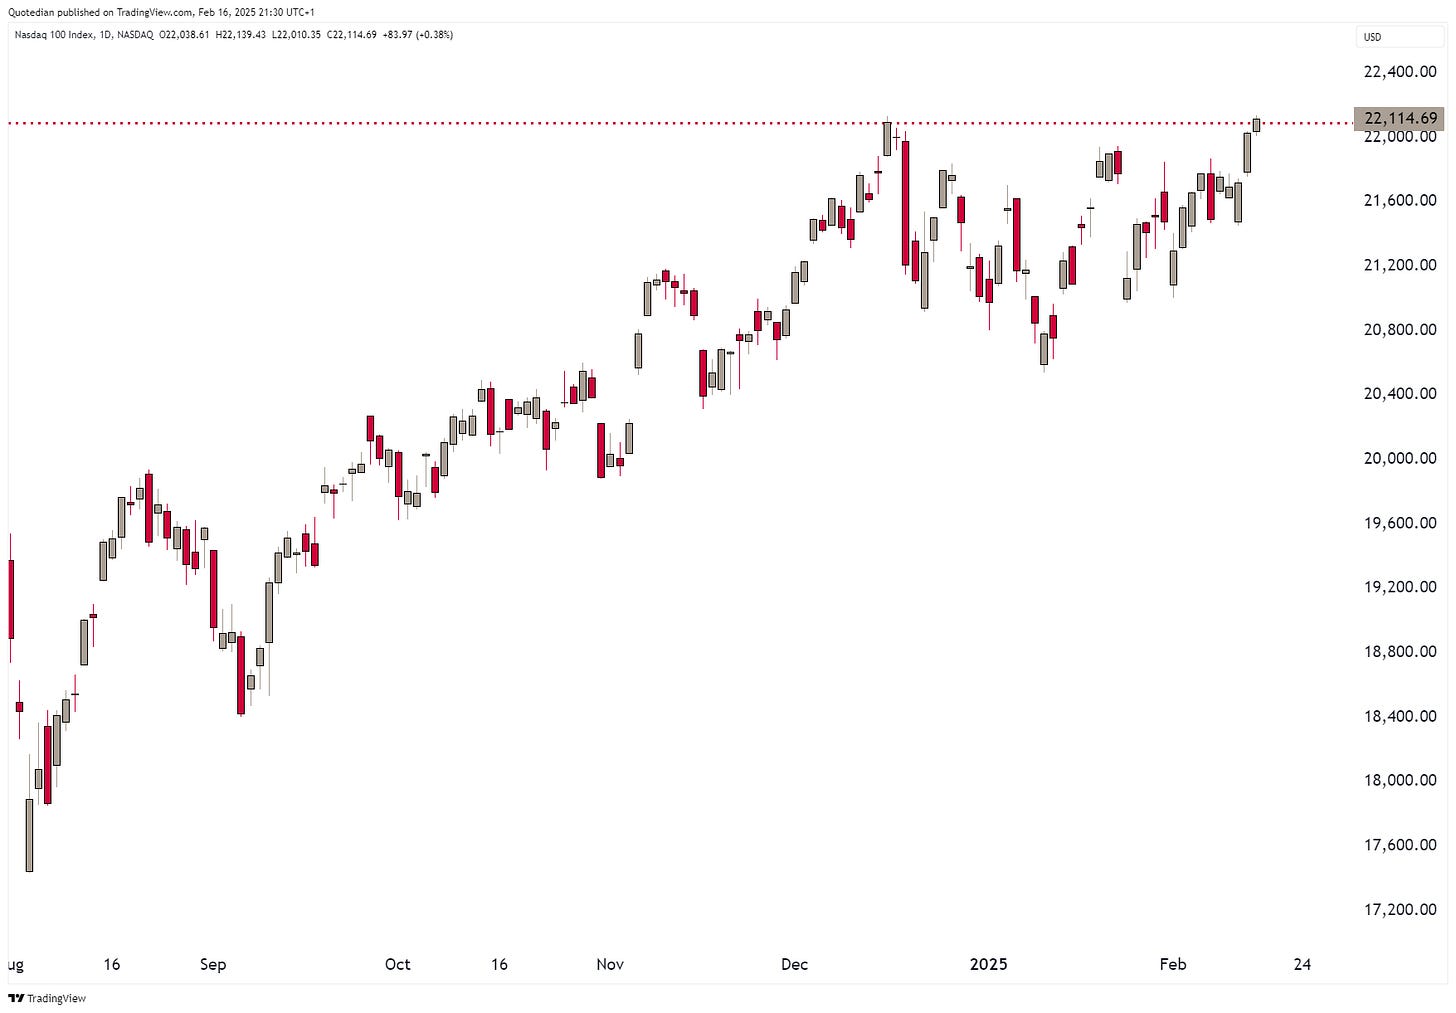
The Nasdaq-100 however, has already reached a new ATH on Friday, probably leading the way for the S&P:
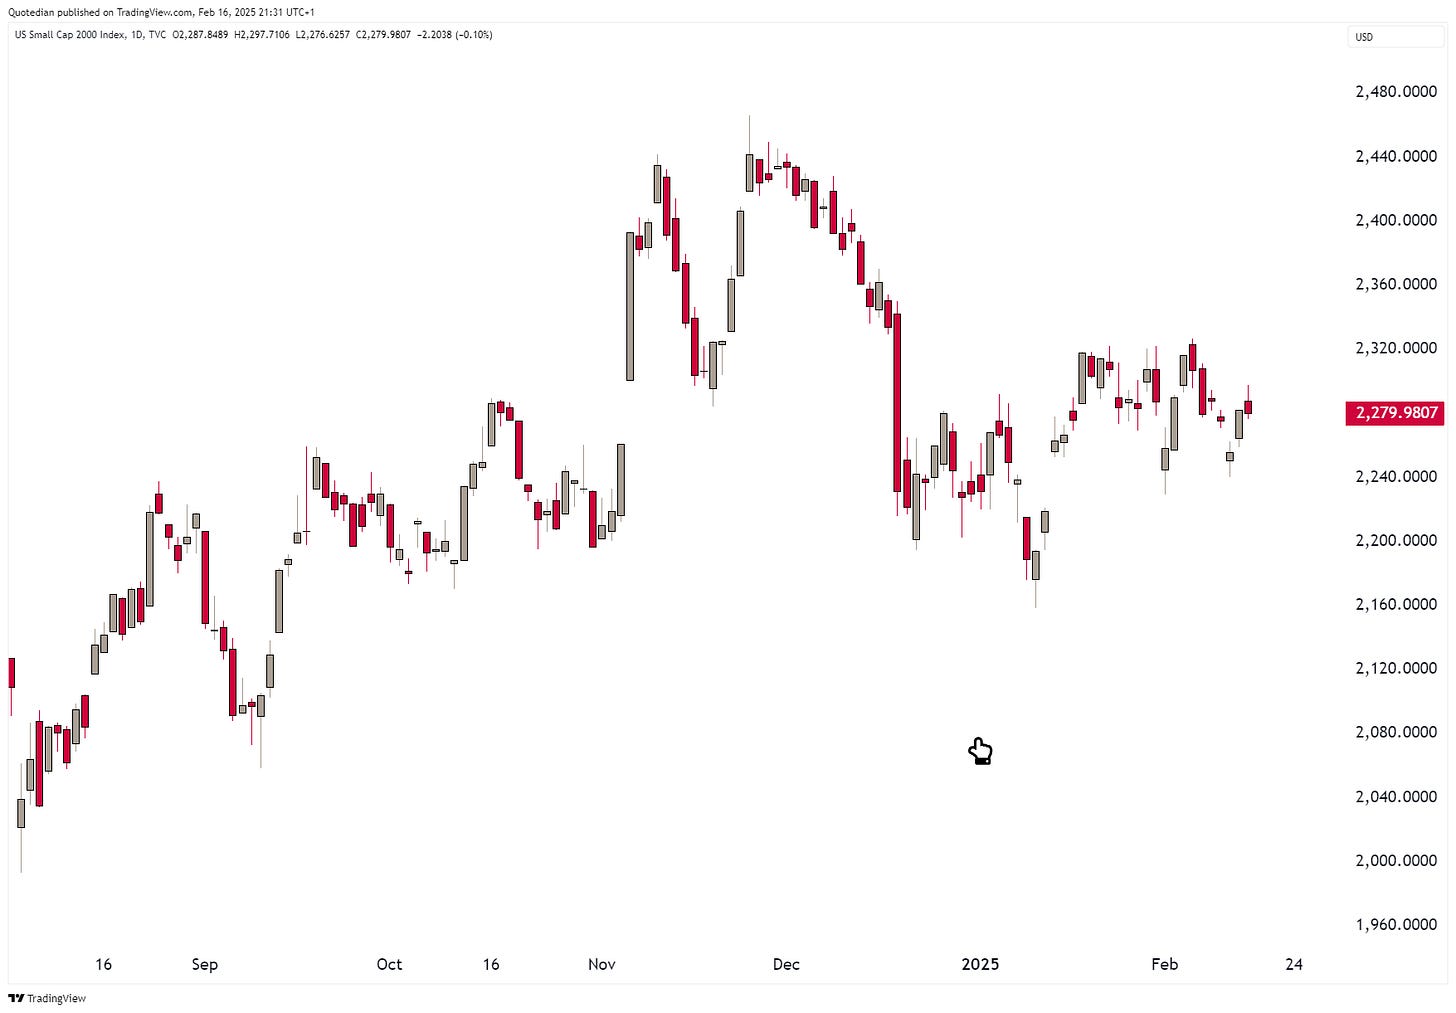
Small cap stocks, as measured by the Russell 2000, continue to be a relative disappointment:
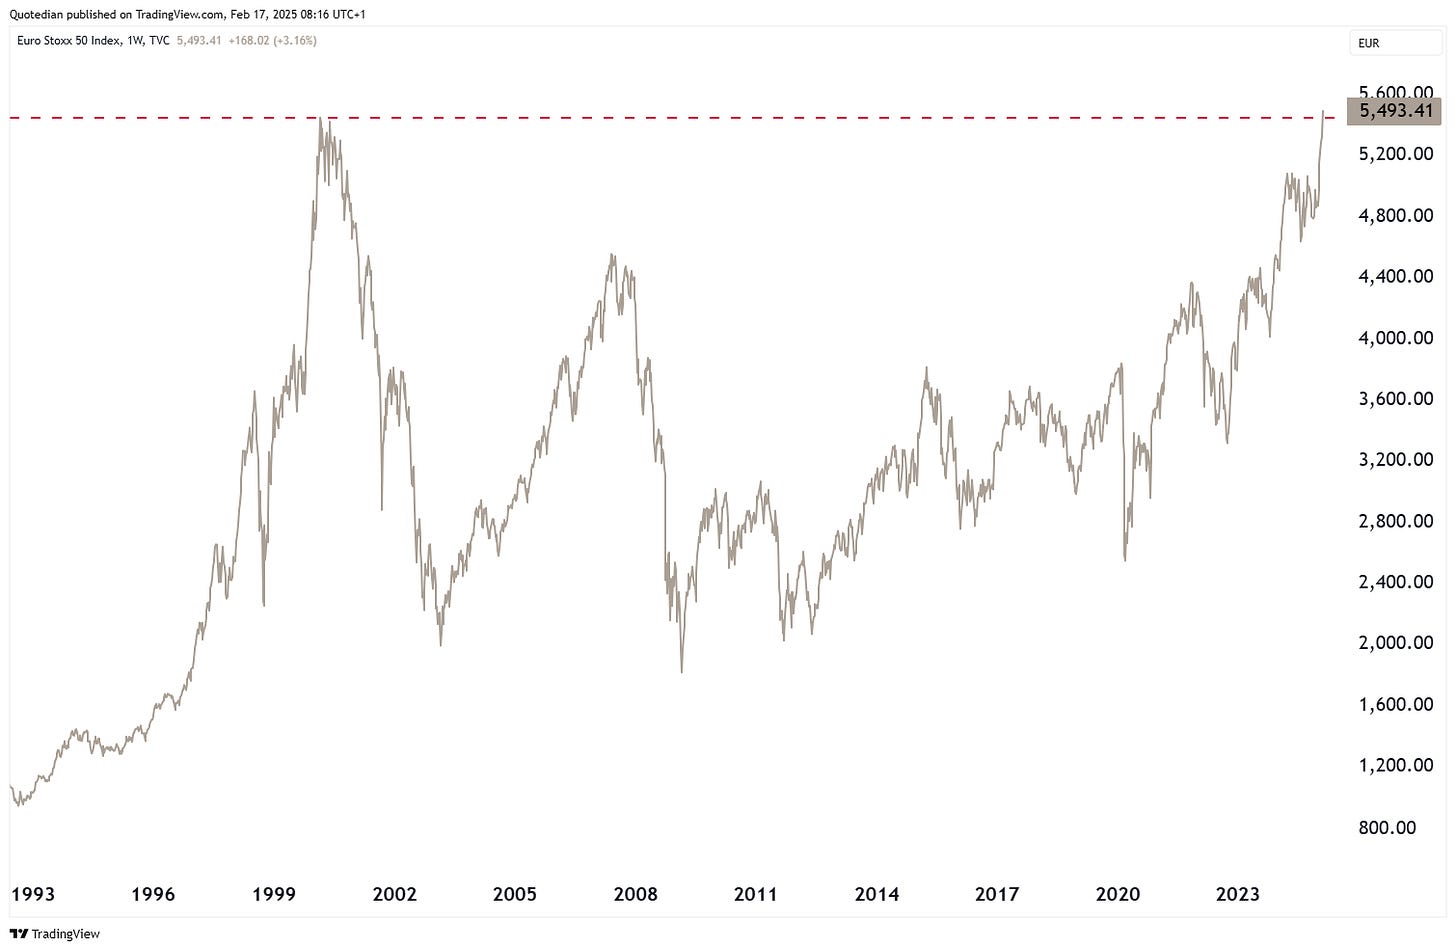
Turning to European equities, here’s another index that made a new all-time high last week … for a first time in 25 years!
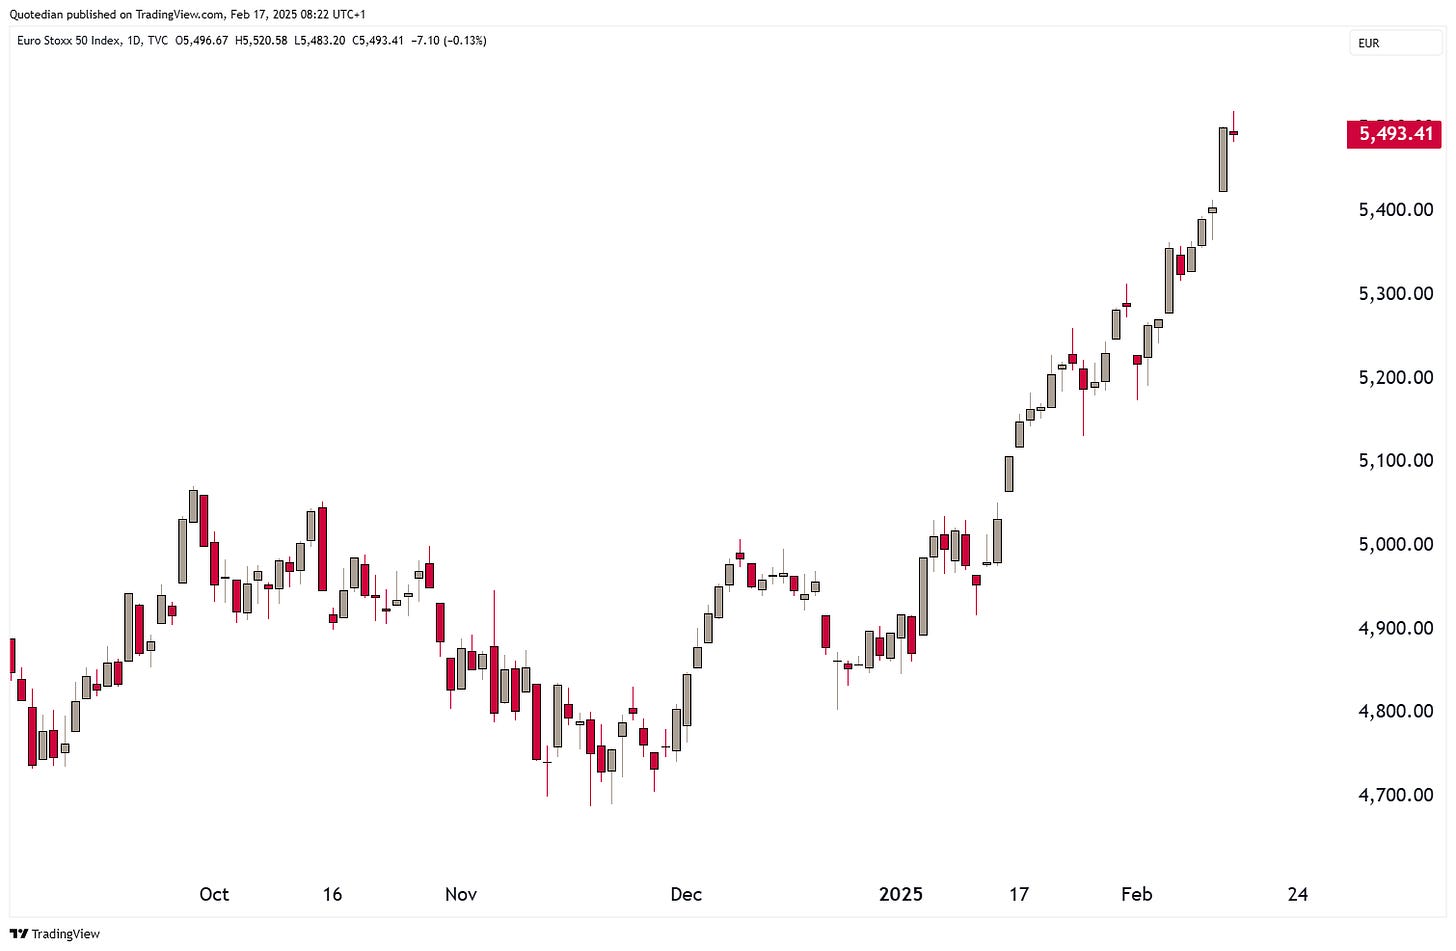
Indeed, did the Euro Stoxx 50 hit its highest level since January 2000 - that’s quite a long time for a base building …
Here’s the zoom in onto the daily version of the same chart:
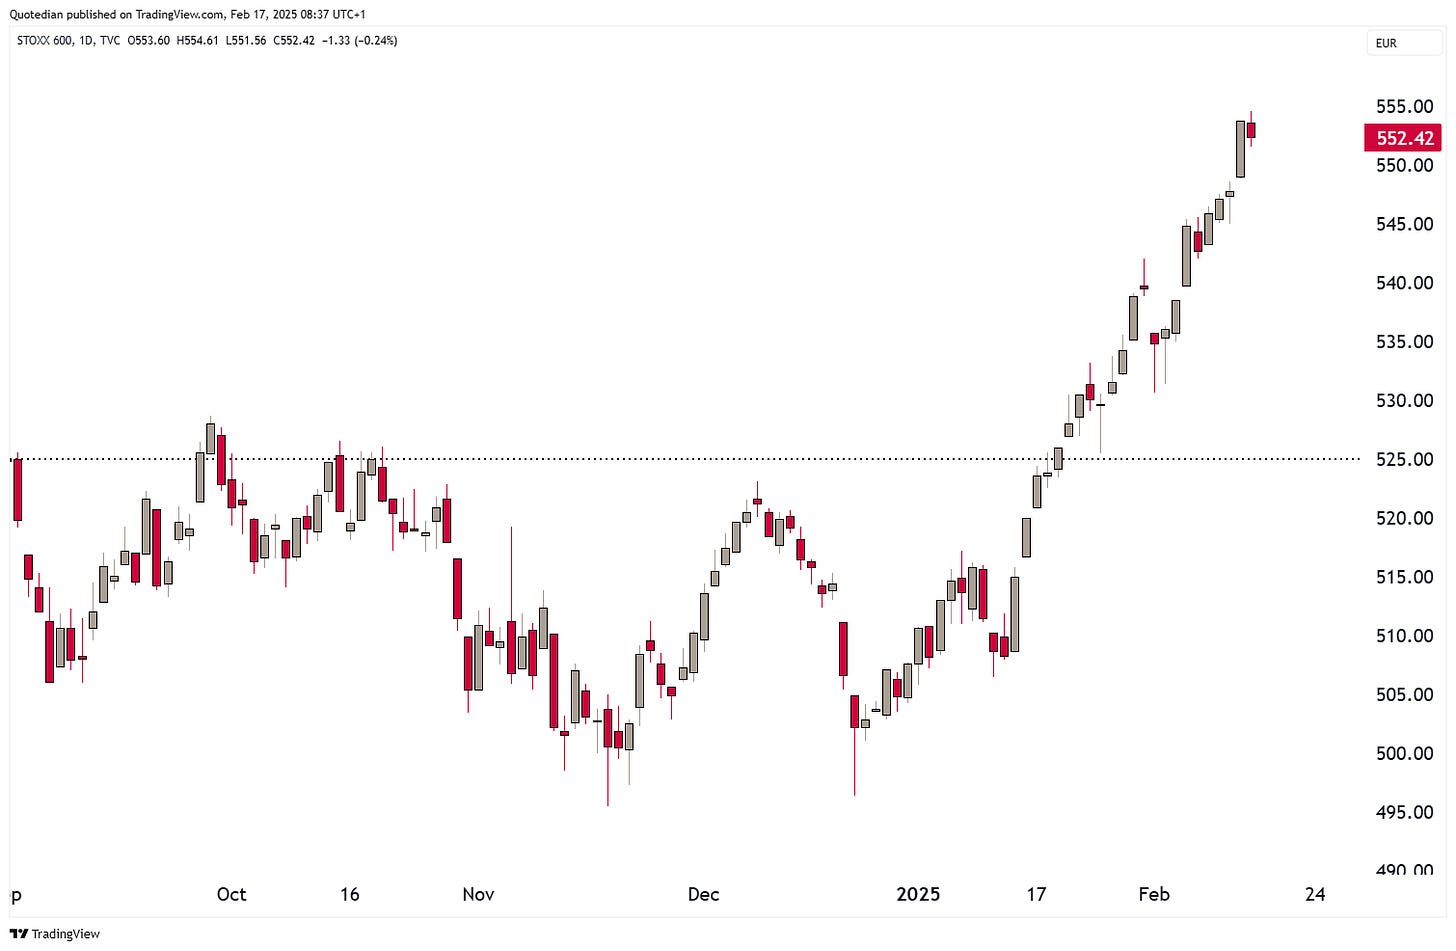
In what is an impressive rally since late December, the broader STOXX 600 Europe index has been locking in record high after record high this year:
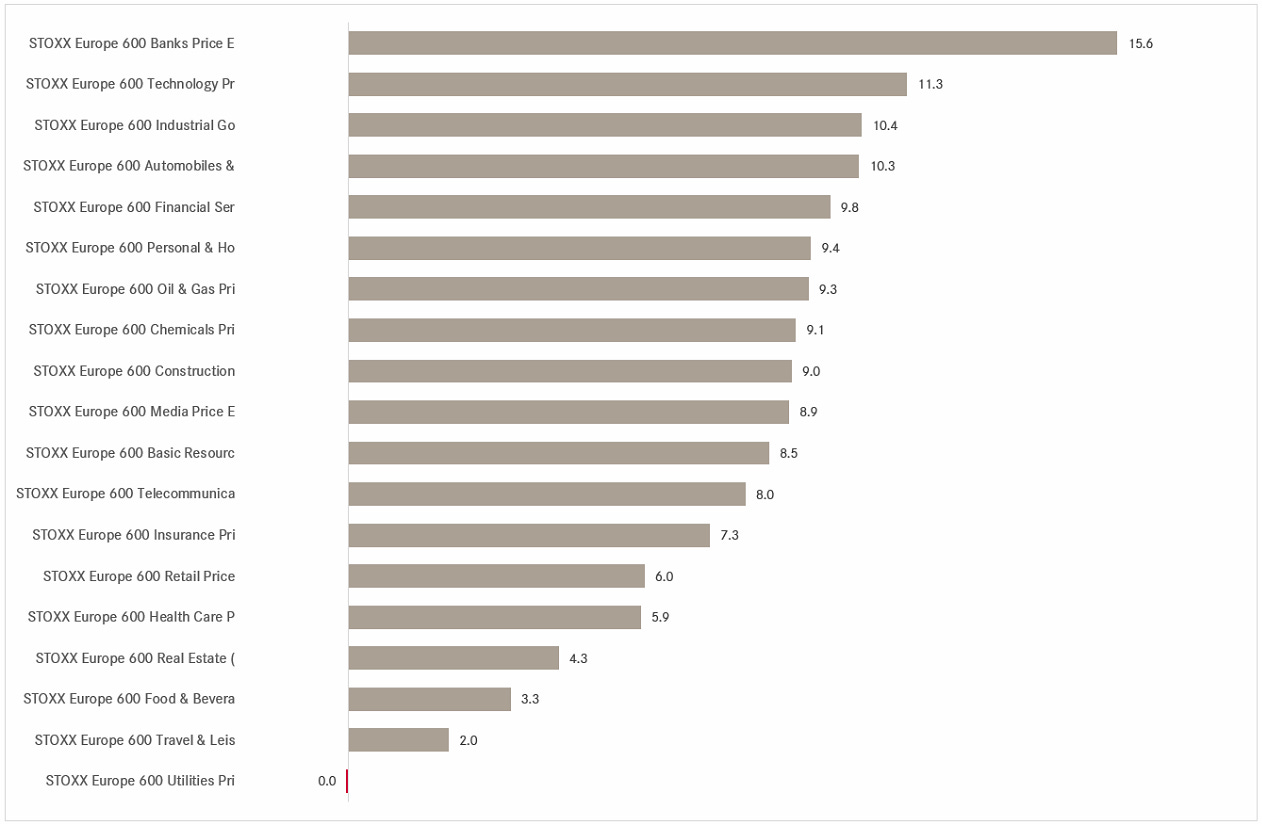
Here’s how the different sub-segments (sectors) of that index have fared since the beginning of the year:
Only Utility stocks print a very small red, every other sector is showing positive readings, led by a flamboyant banking sector.
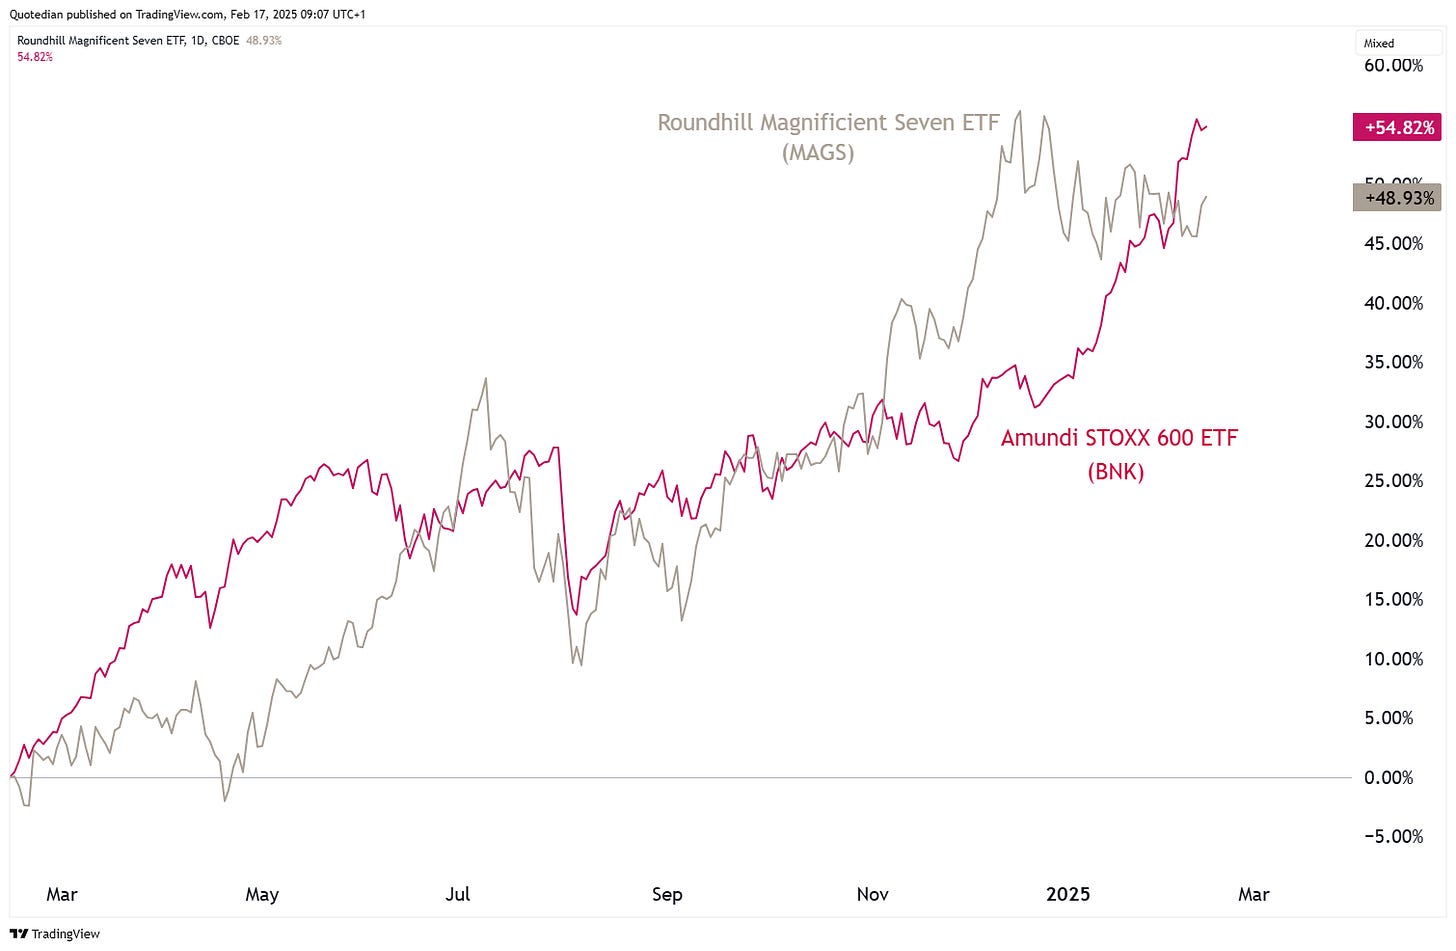
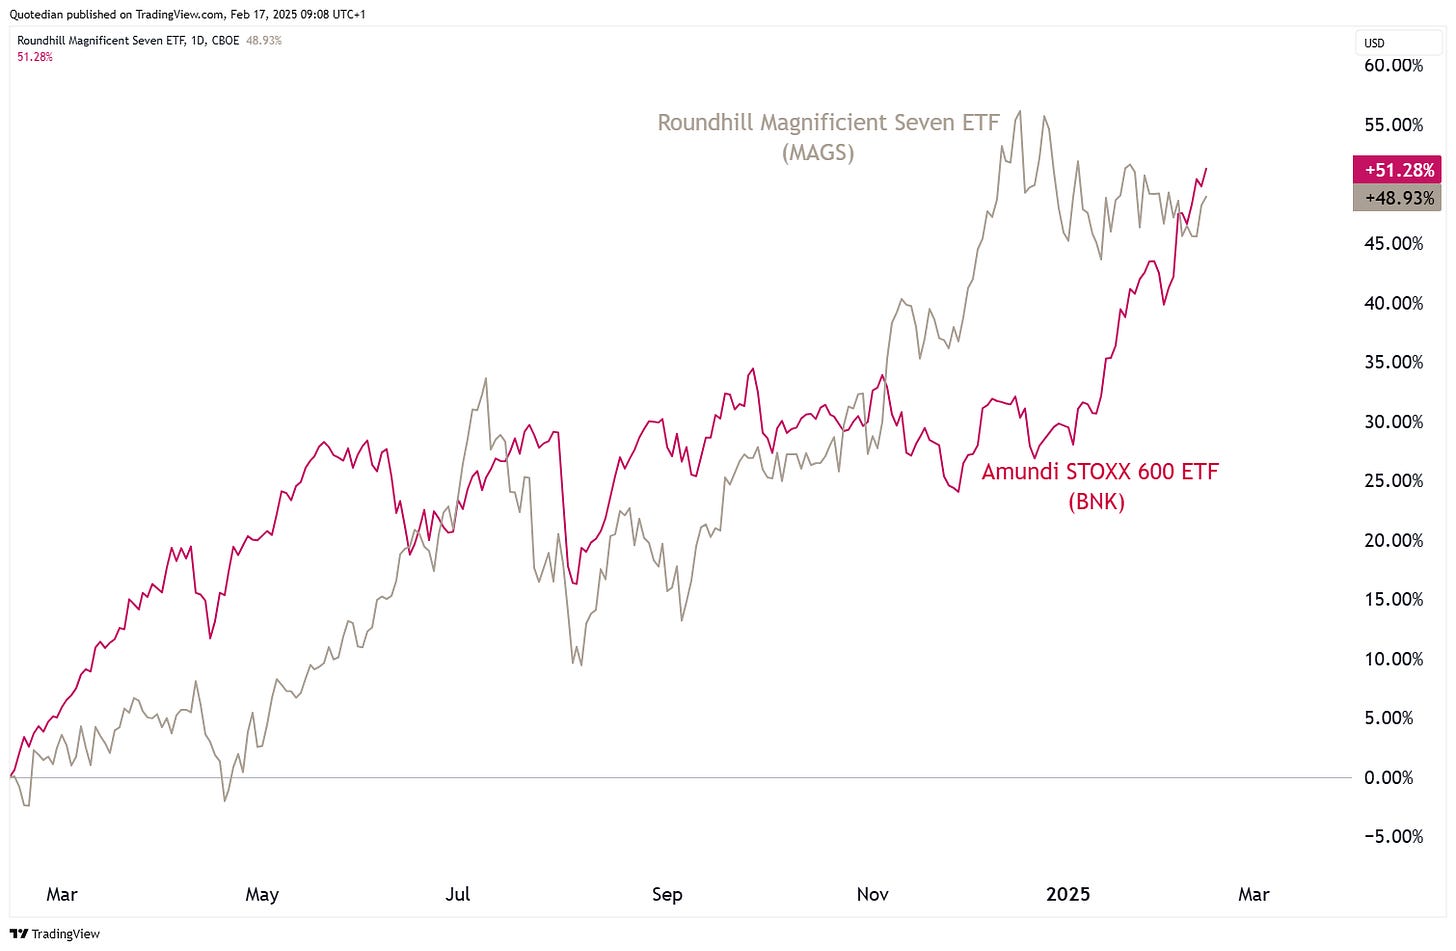
As a matter of fact, did you know that European banks have outperformed the Magnificient Seven over the past year,
even after adjust for currencies:
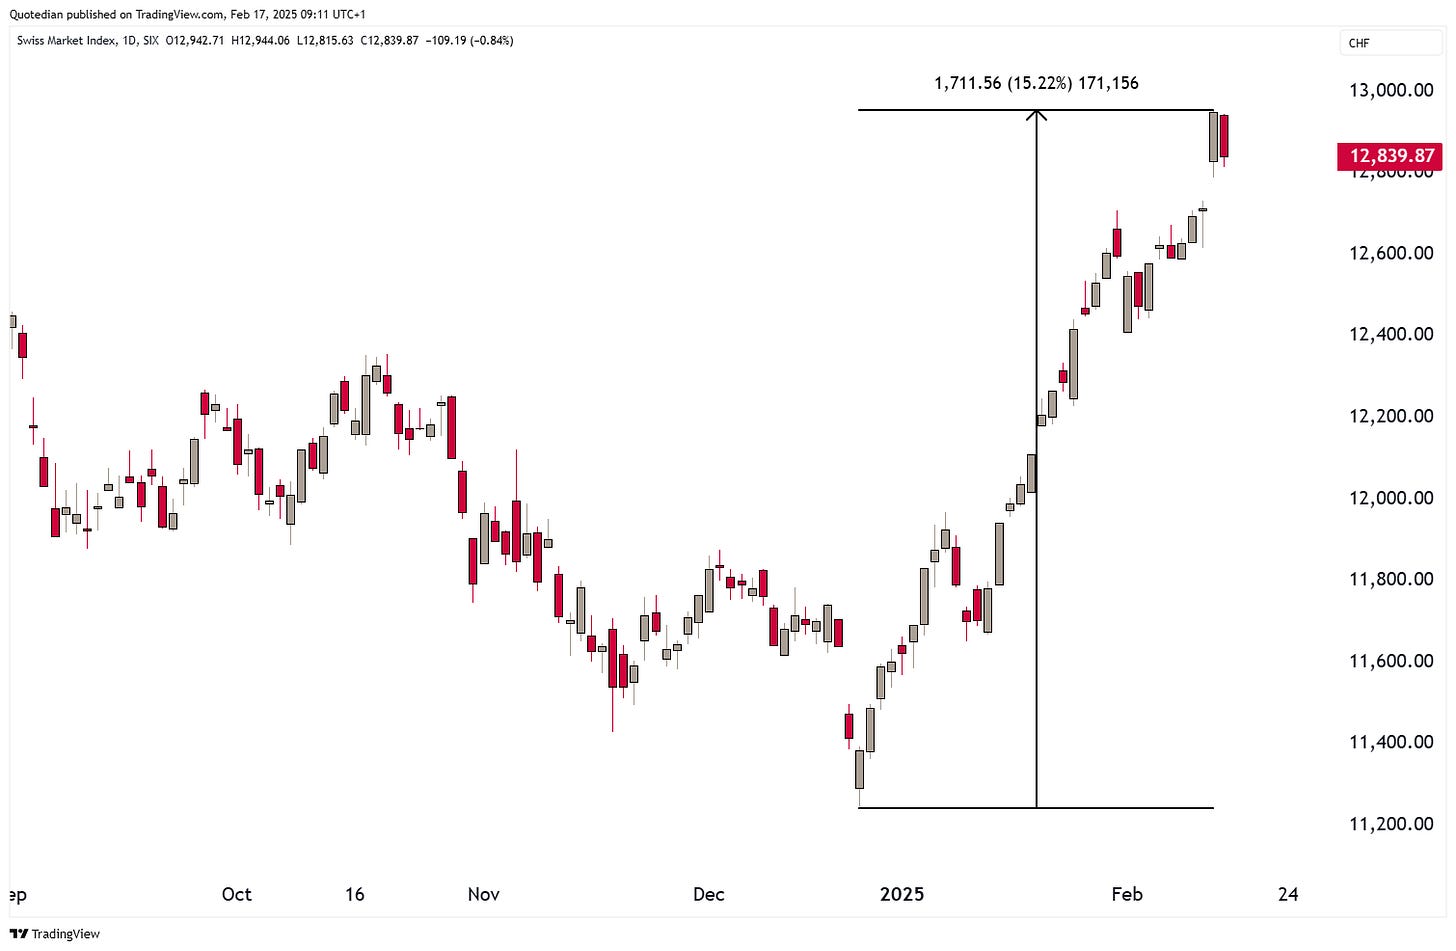
Switzerland’s SMI (finally) also had an awesome rally since that omnious Friday 20th, December:
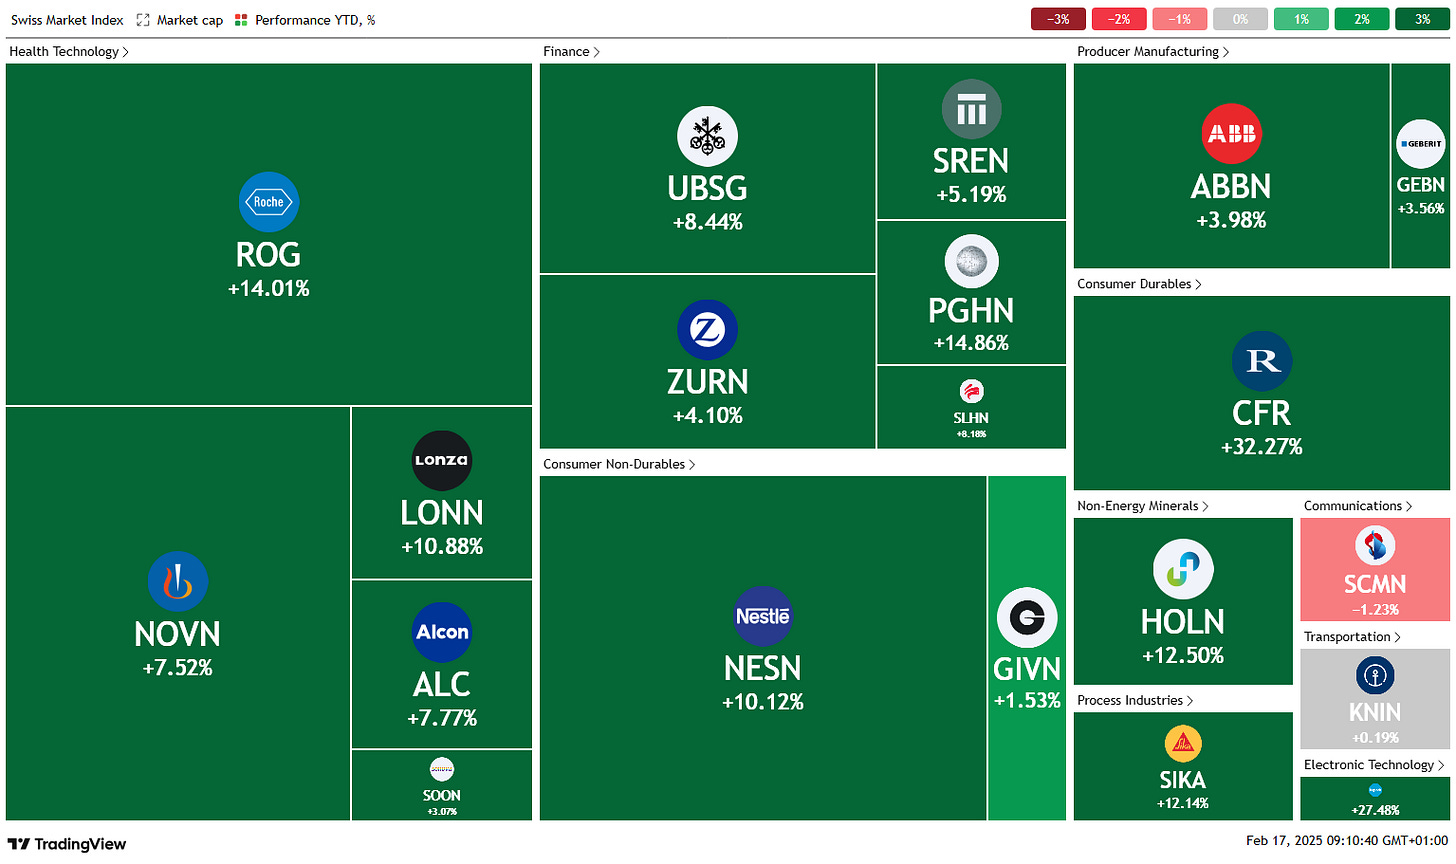
As the following year-to-date performance heatmap shows, have it been mainly the defensive segments (health care, consumer staples) pushing the SMI higher:
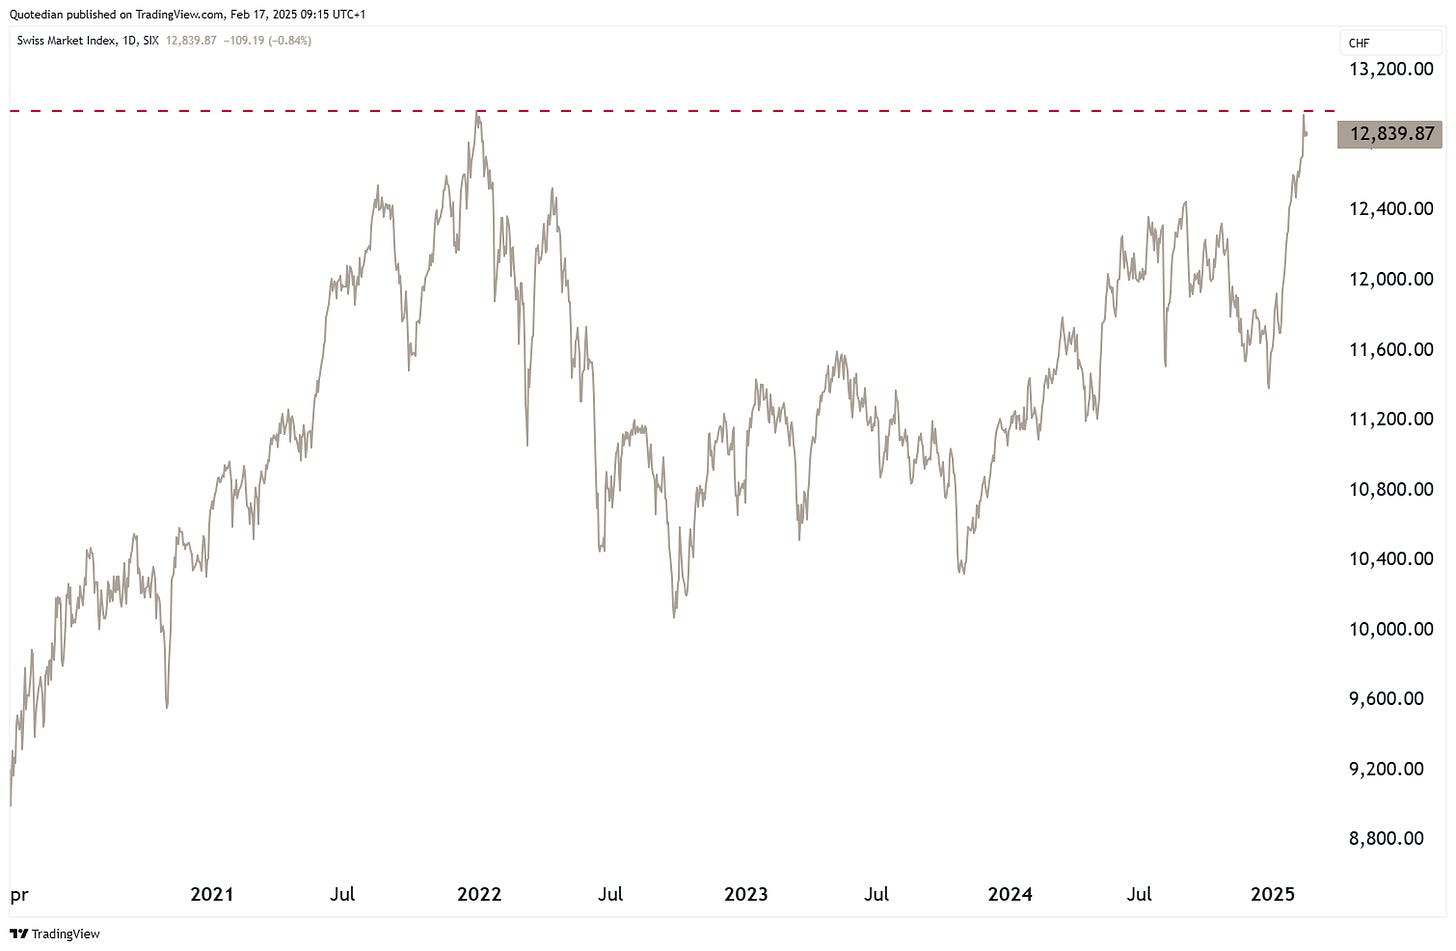
Last Thursday then, the index closed only 21 index points shy of a new all-time high, set on 28th December 2021:
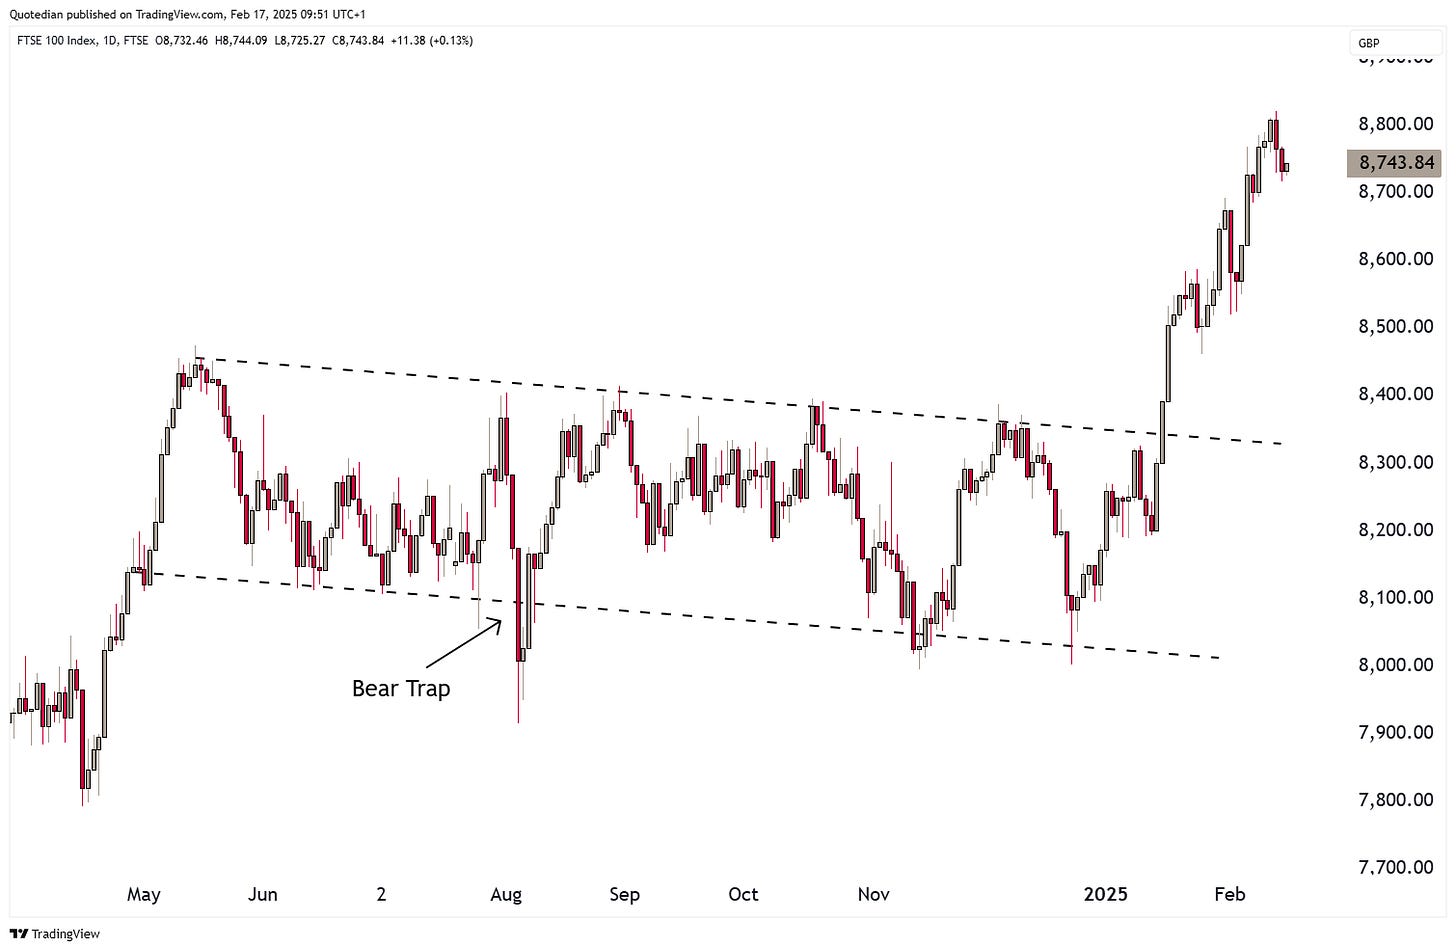
UK’s FTSE-100 index started a vertigo-inducing rally mid-January, lifting the index out of its nearly year-long sideways consolidation misery:
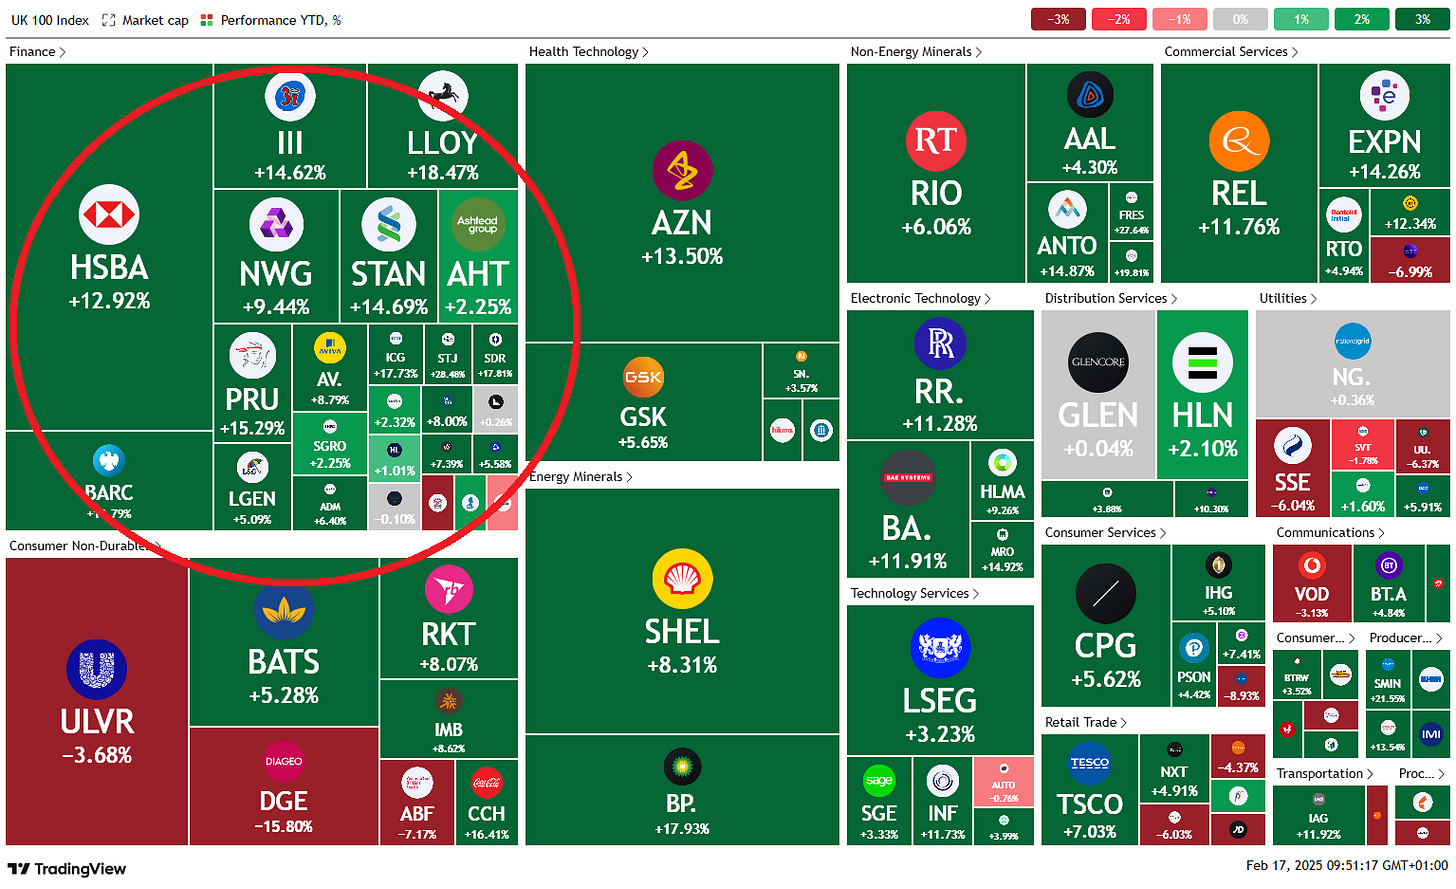
The push seems to have come mainly out of the Finance corner of the index:
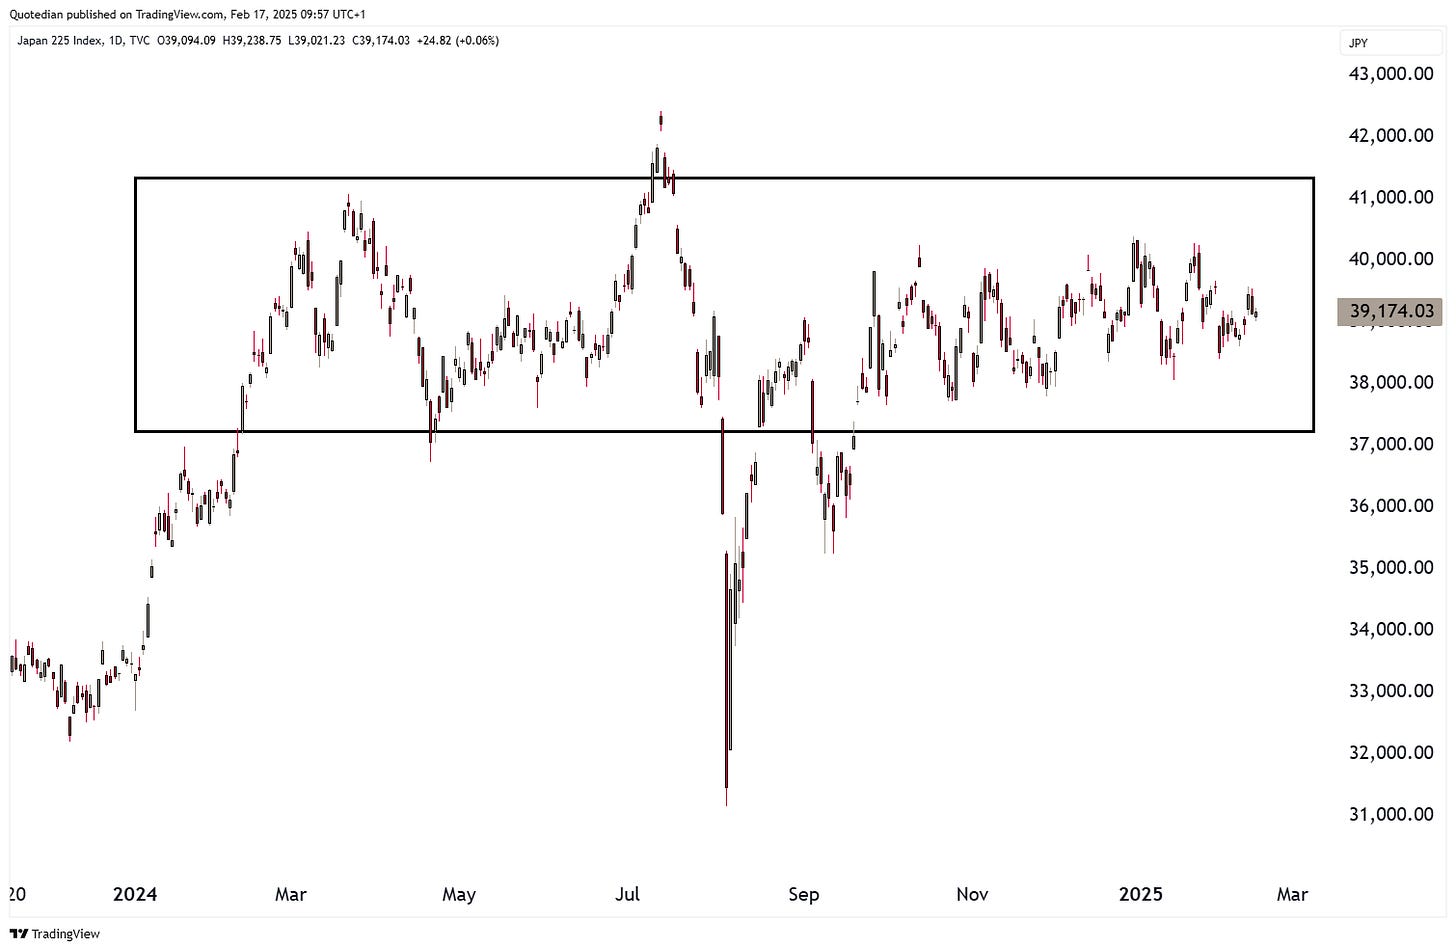
Turning to Asia, breaking out of its consolidation pattern is what Japan’s Nikkei has NOT achieved yet:
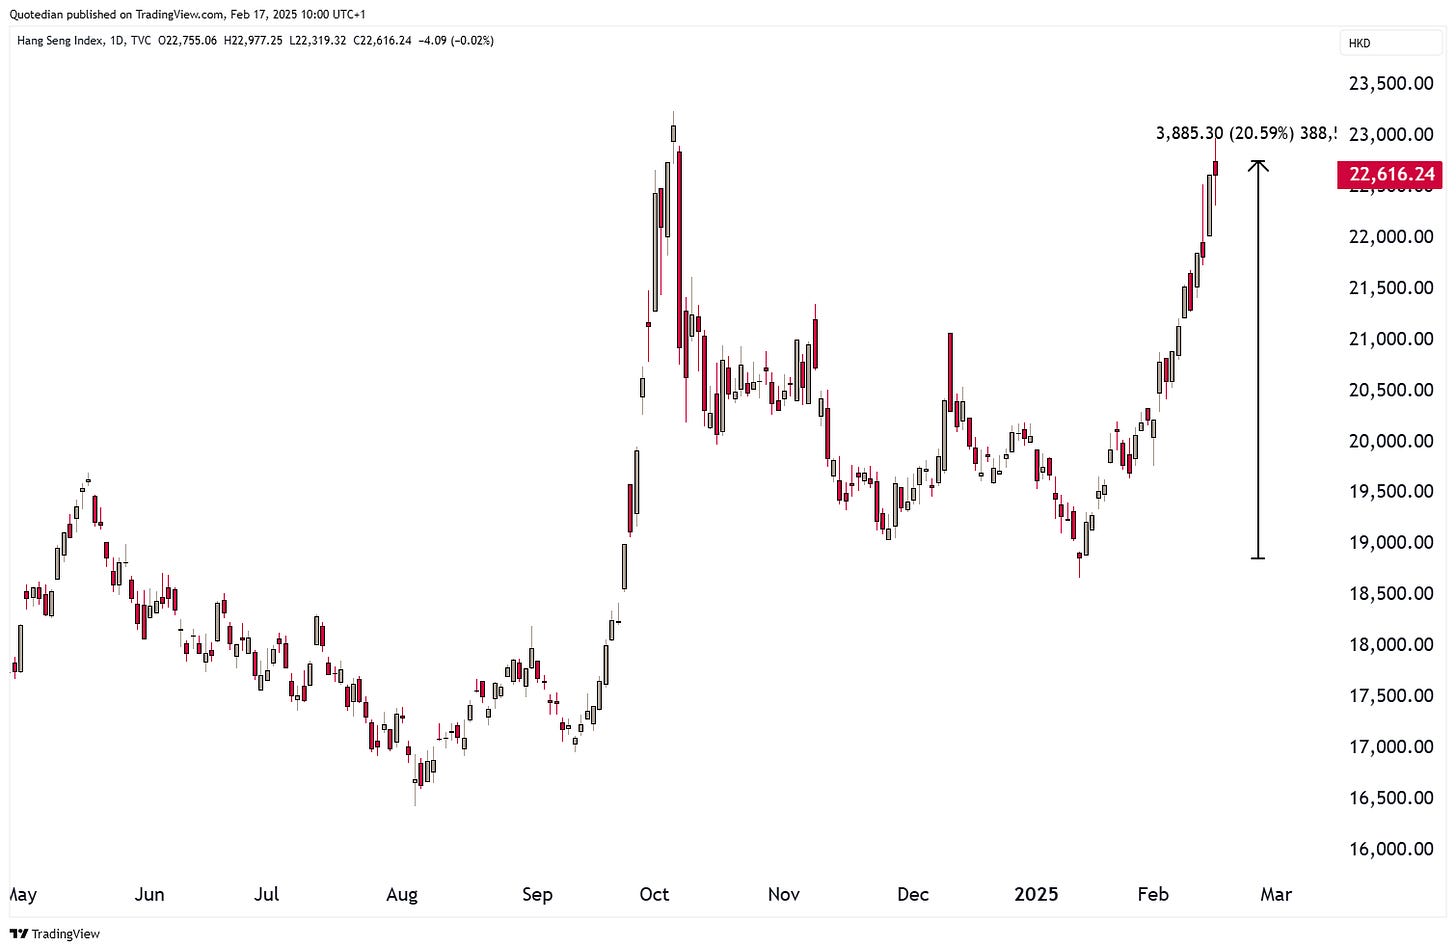
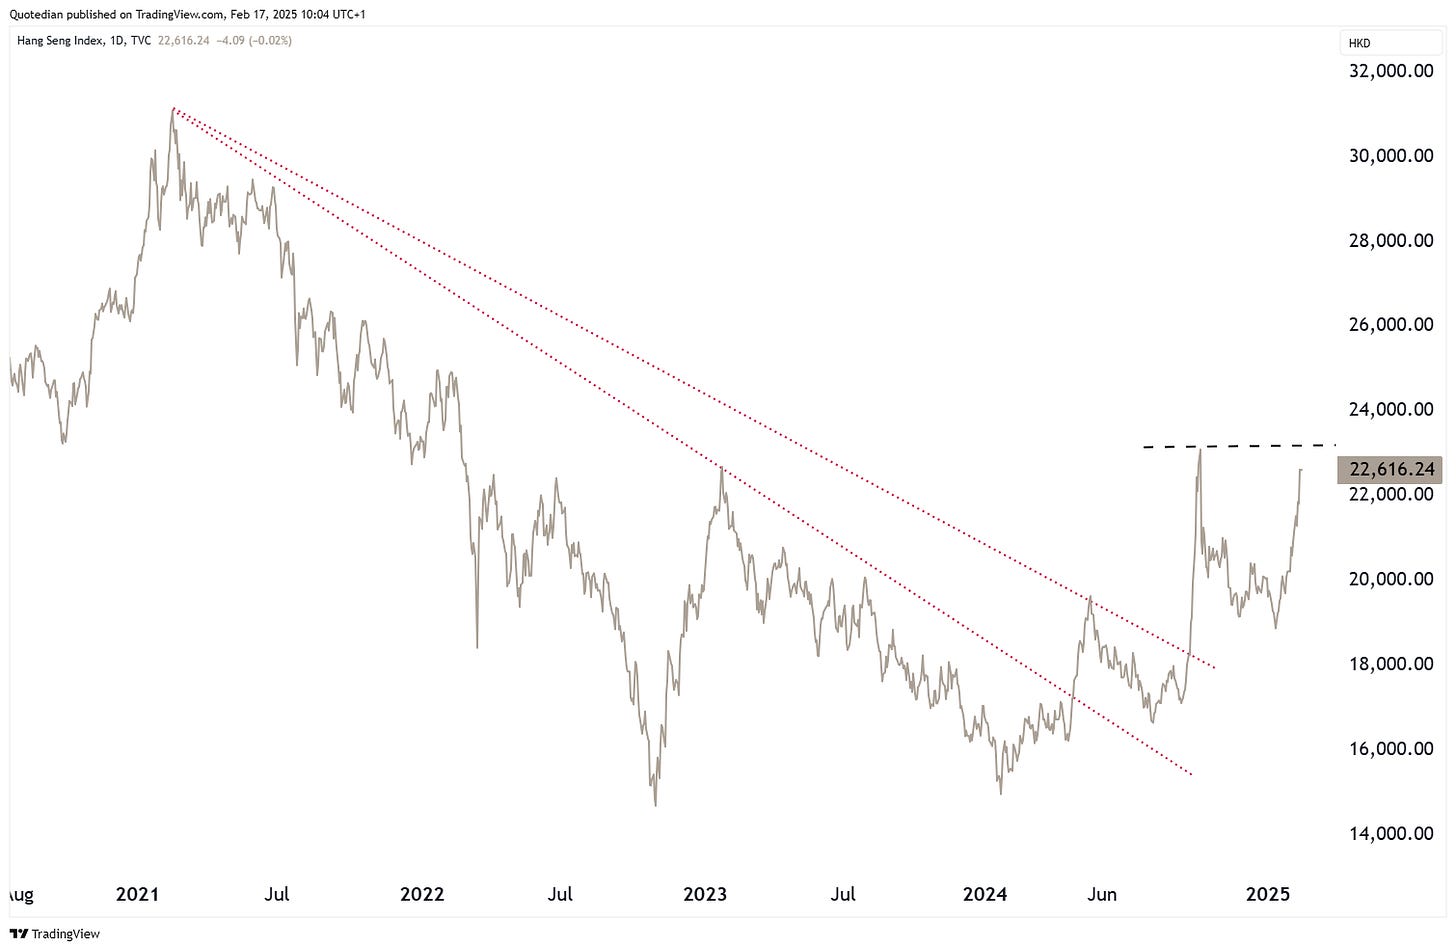
One of the leading performing indices over the past month has been the Hang Seng index, likely being used as a proxy by Western investors on China:
Too late to buy? Perhaps.
However, given the still existing “hate” for anything China, and the related “under owned”-ness of this market segment, a lift above 23,150 (black dashed line) could give additional legs to this rally:
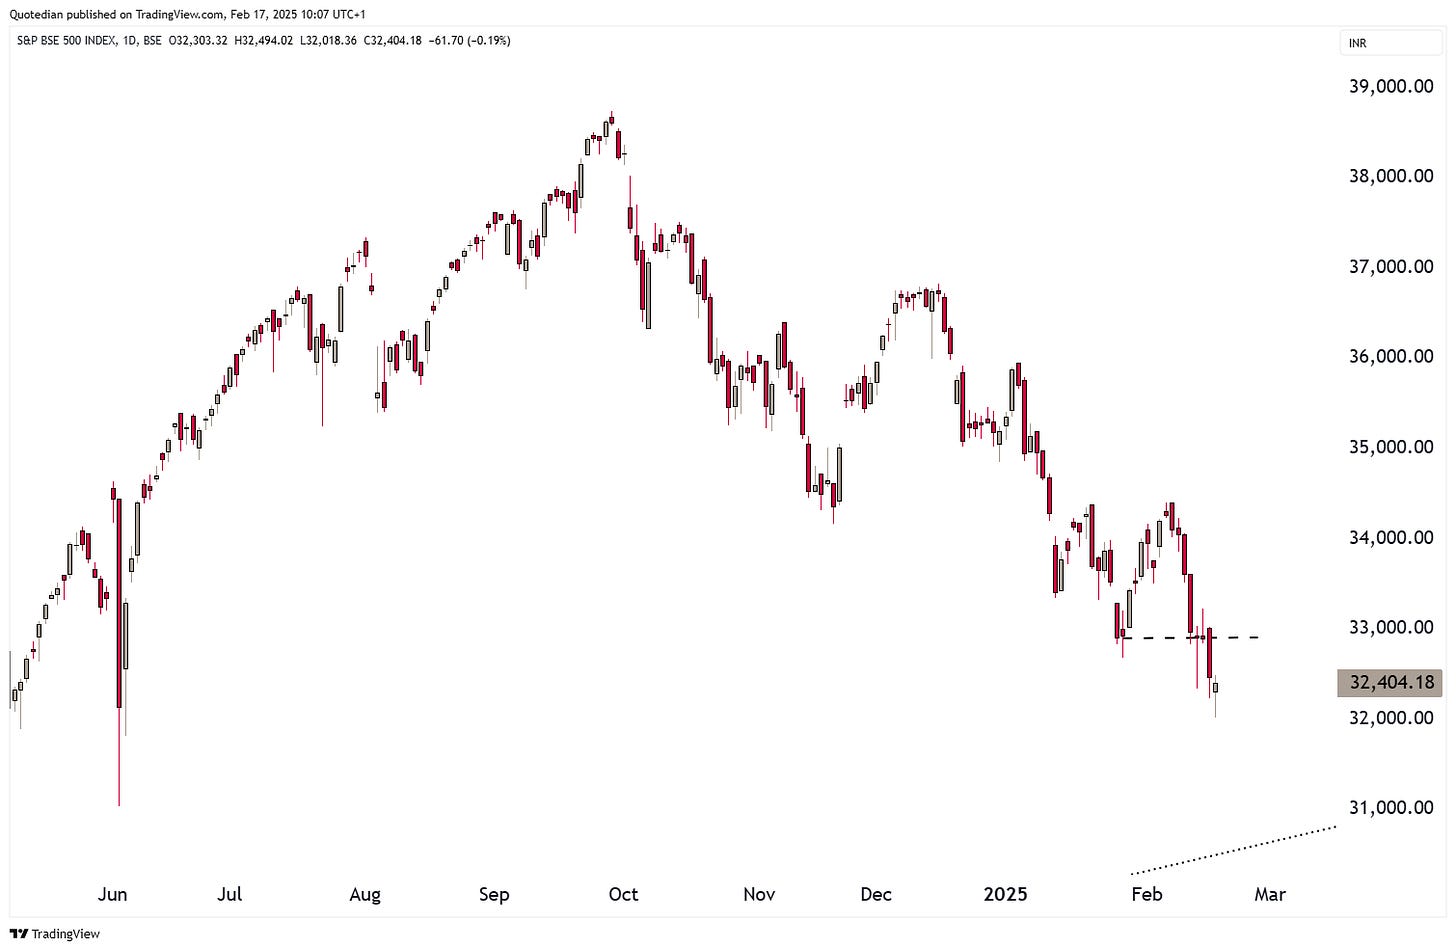
In India, we are observing quite the opposite, where the BSE500 is slowly but sure closing in on our price target of just a tad south of 31k:
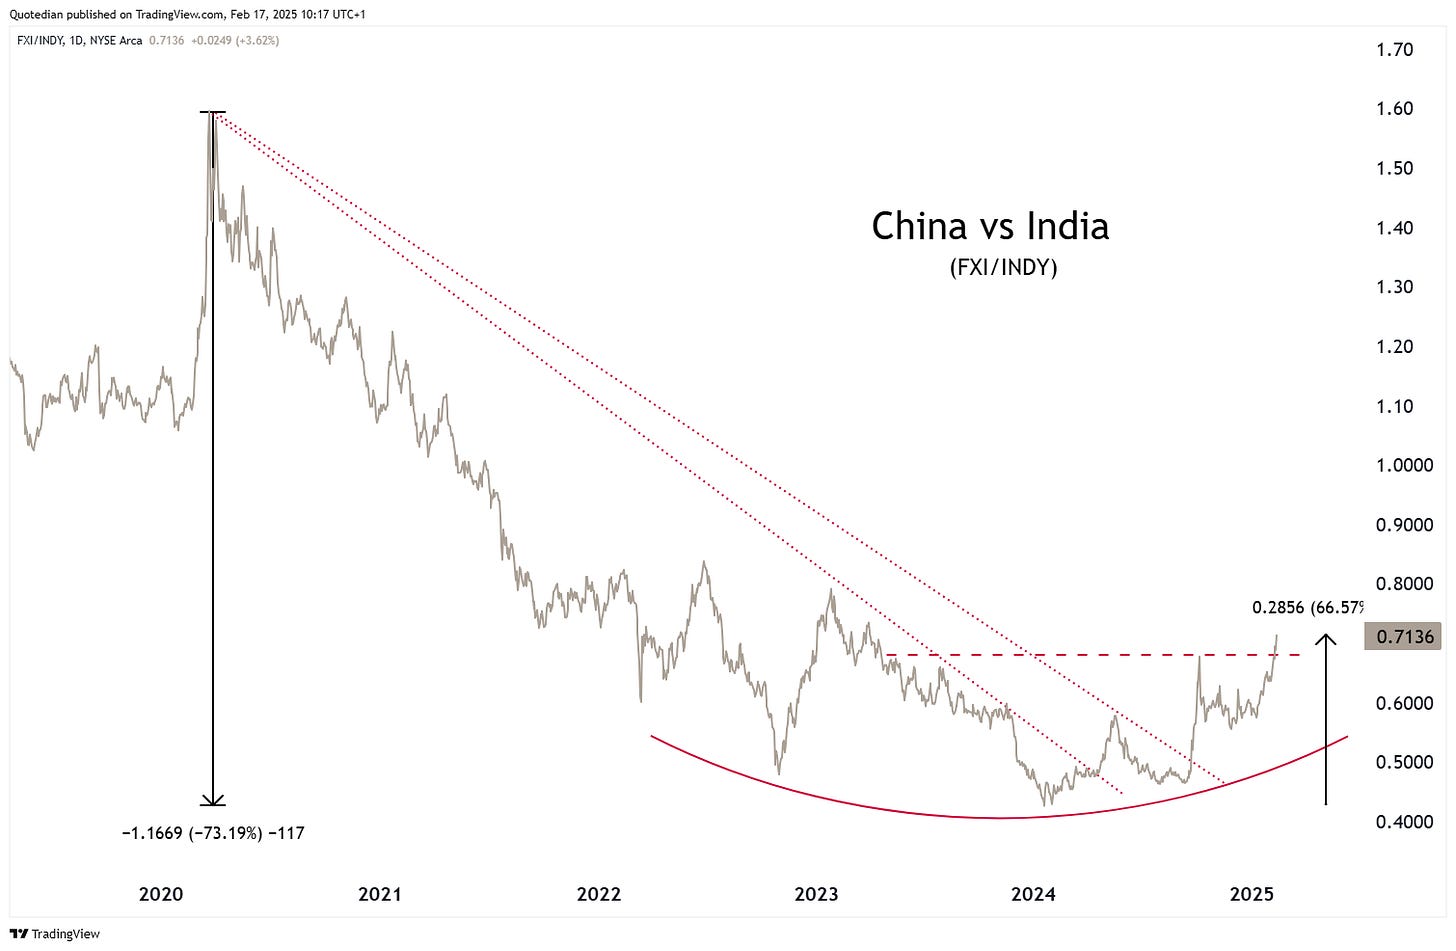
In last Thursday’s QuiCQ (click here), I even ventured into heretics, suggesting that the long China (FXI), short India (INDY) trade may still have legs:
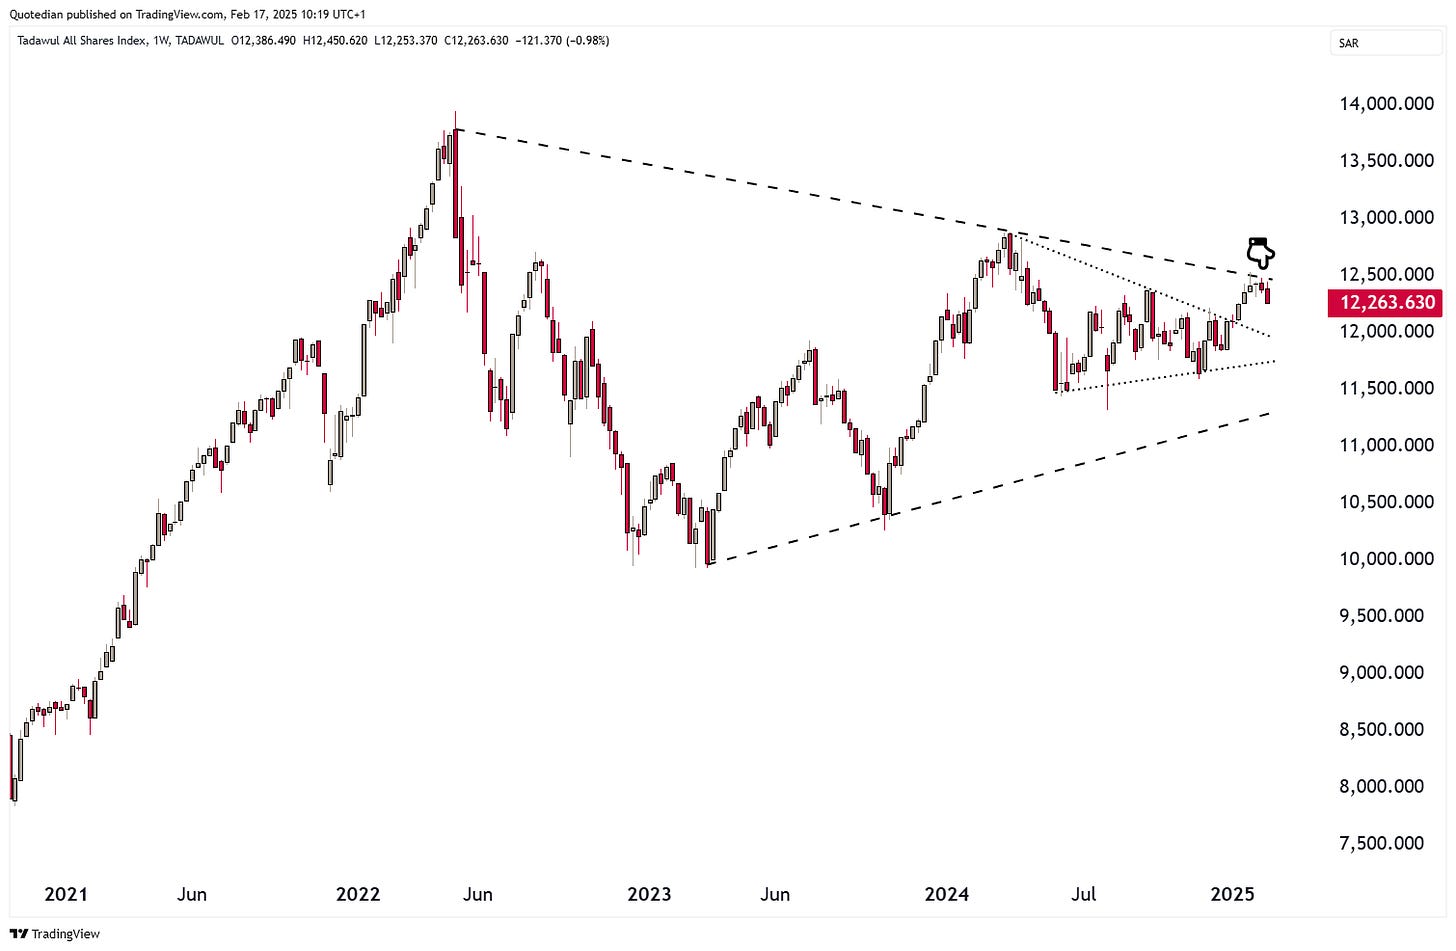
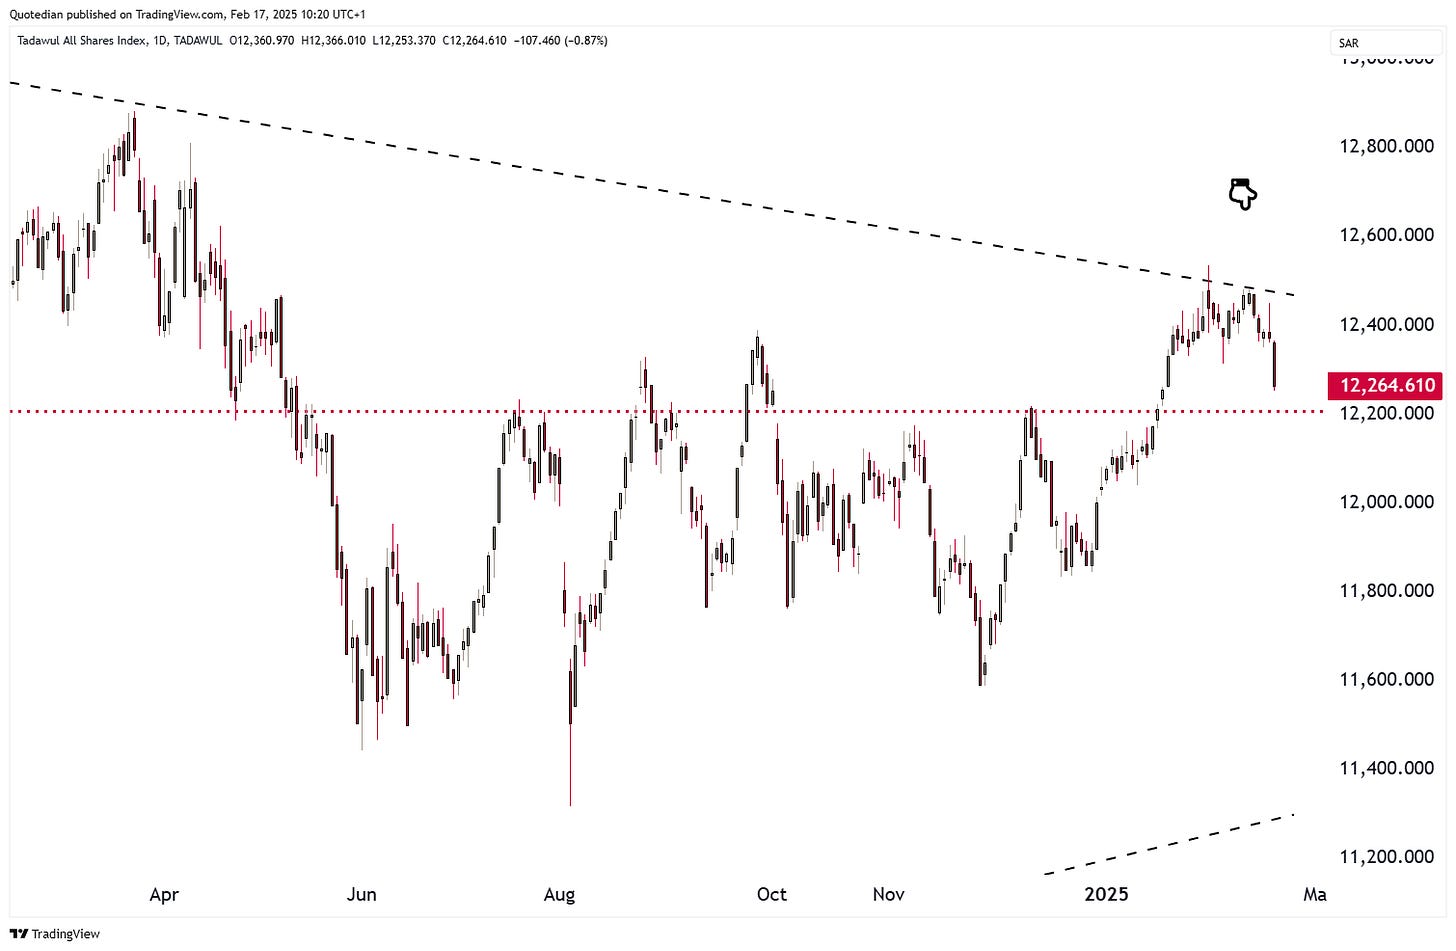
Finally, Saudi Arabia’s Tadawul All-Share index has for now been rejected at a major resistance point:
Zooming in, we note that 12,200 would be a good level for the correction to end:
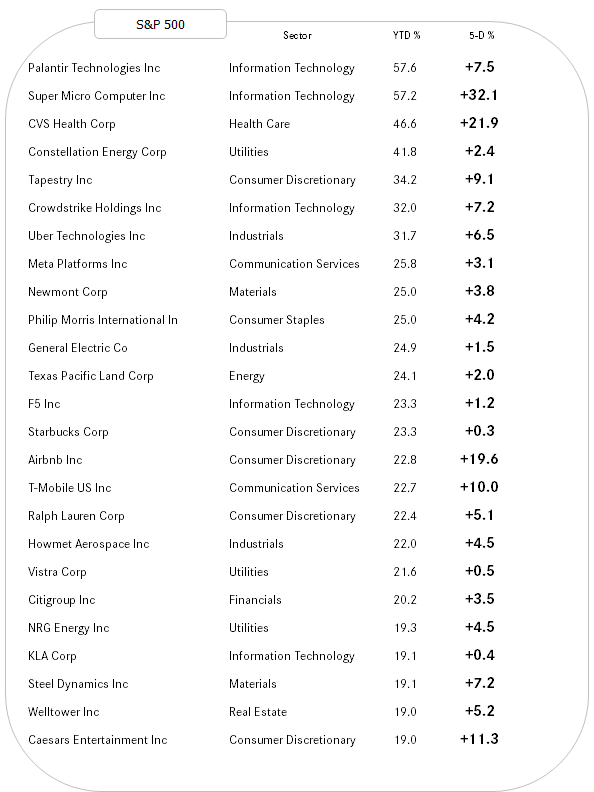
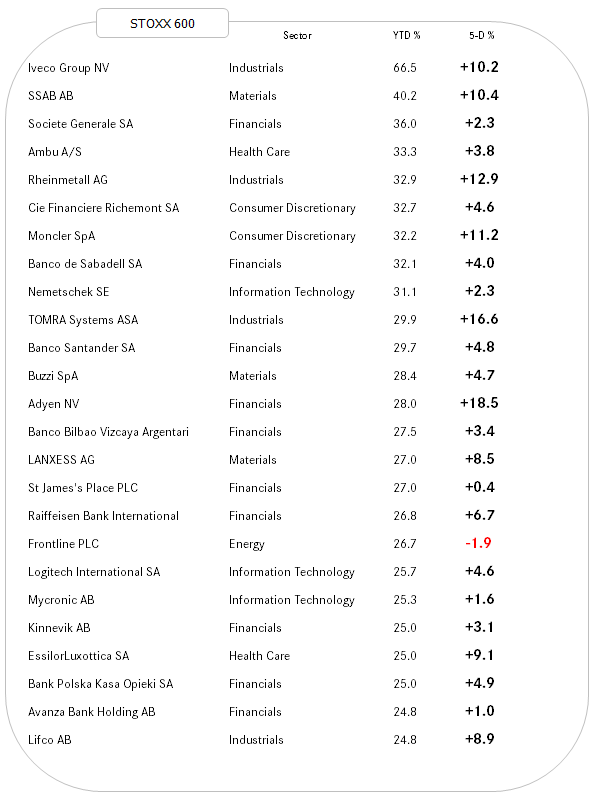
Ok, time to finish the equity section with our usual glance at the best performing stock in the US and Europe on a year-to-date basis and how they have done over the past week.
Here’s the US list:
Strength begets strength and we observe that all best performing stocks have added further to their YTD gains last week. Probably also noteworthy that the list seems a tad less tech heavy than in the past.
And here’s the European list:
Financials rulez!
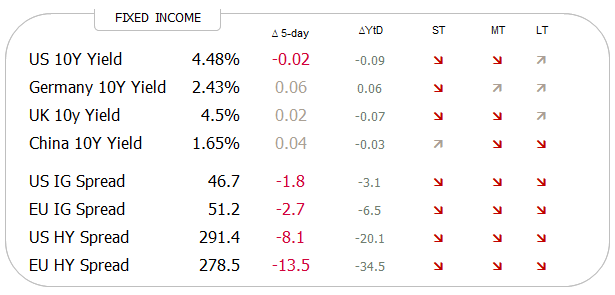
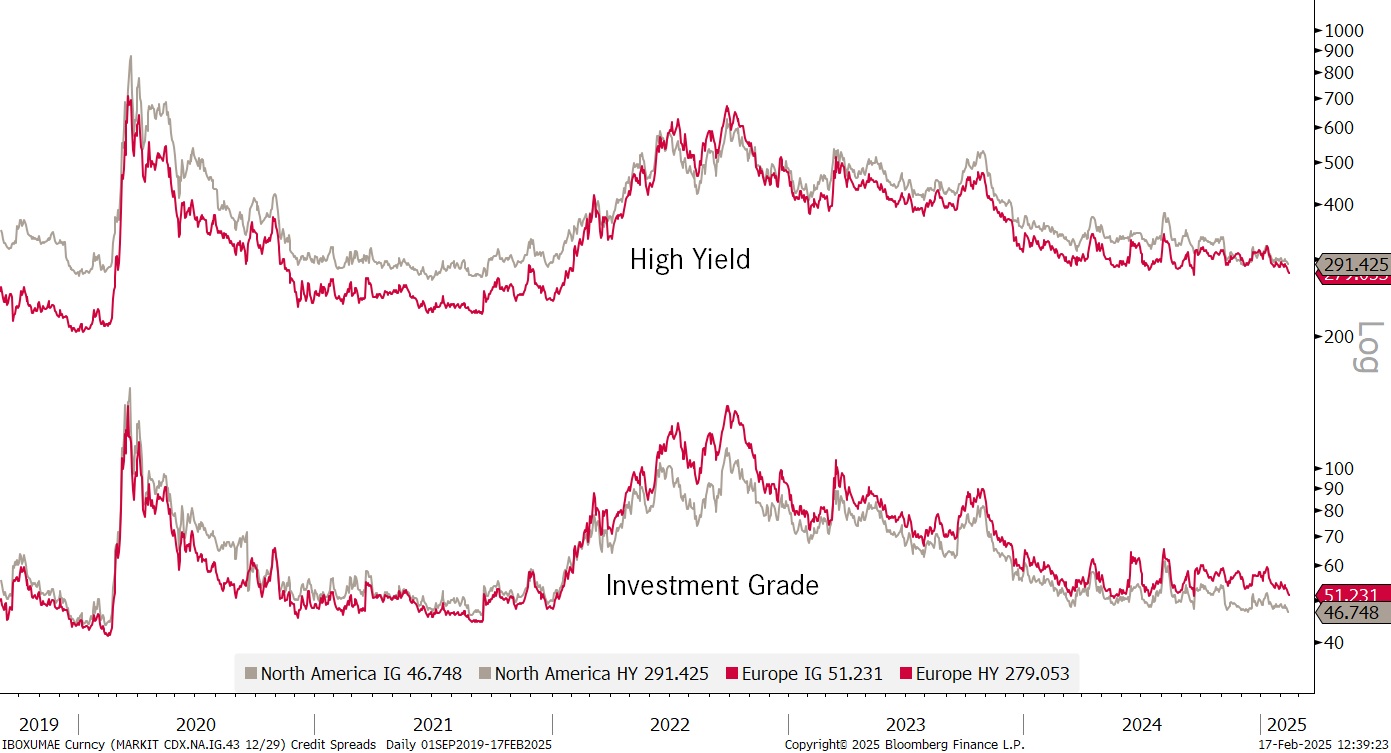
Entering interest rate markets, we observe a) mixed trend signals for yield (top four lines in table below) and b) further contracting and down trending credit spreads:
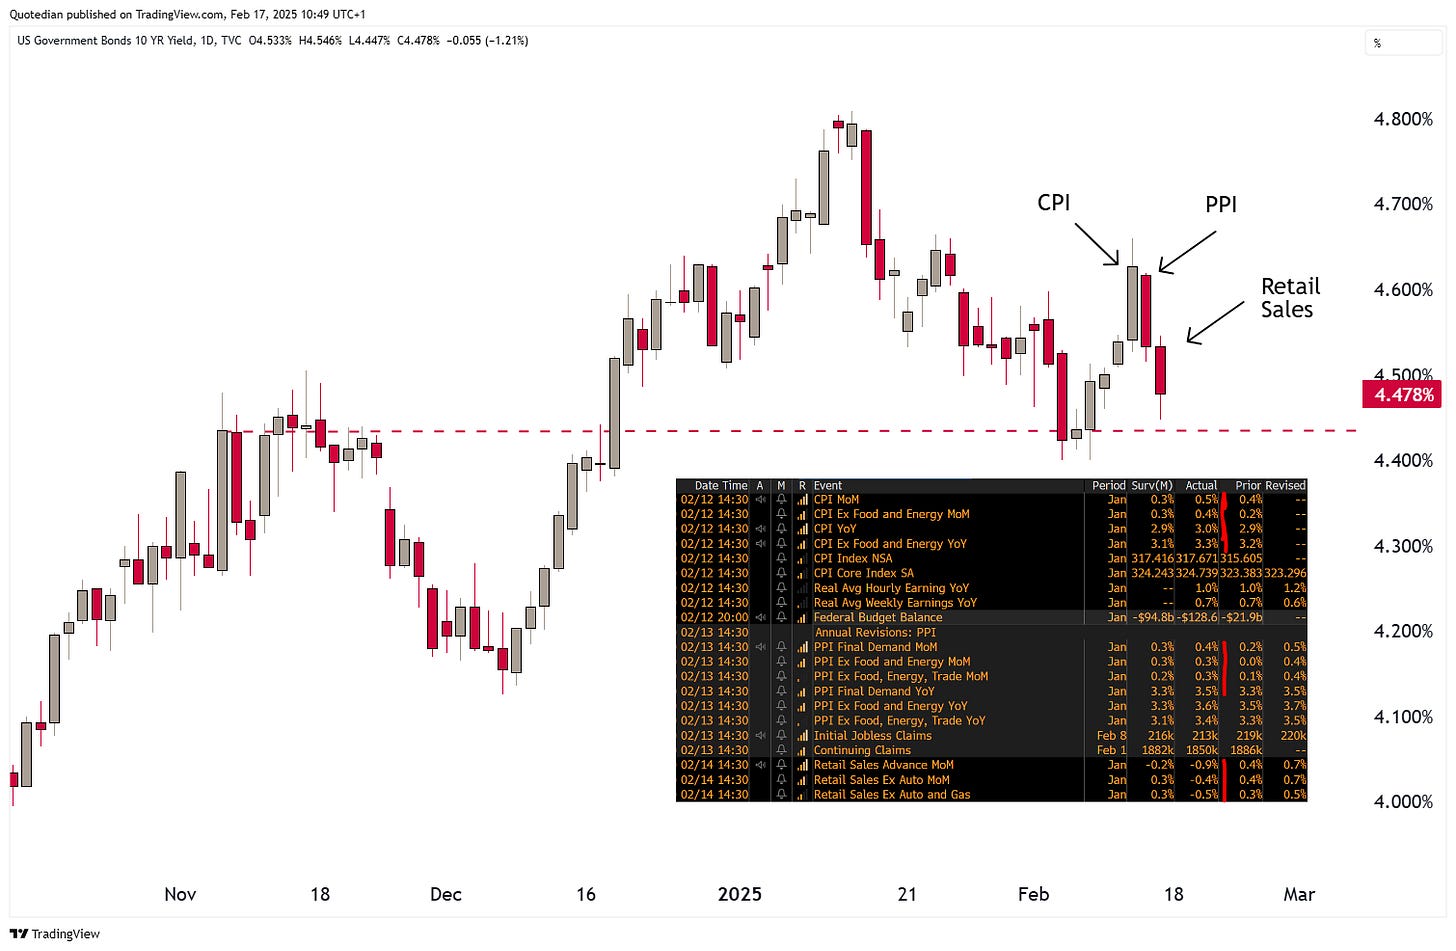
US bond yields had a strange week last week. First a hotter-than-expected CPI reading on Wednesday provoke a bond yield rally, bond price sell off. So far so good. However, the PPI reported on Thursday, which also carried a negative surprise to the upside, provoked exactly the opposite price reaction to the previous day. Then on Friday, retail sales reported were softer-than-expected, provoking more downside for yields. At least, that was the correct move again:
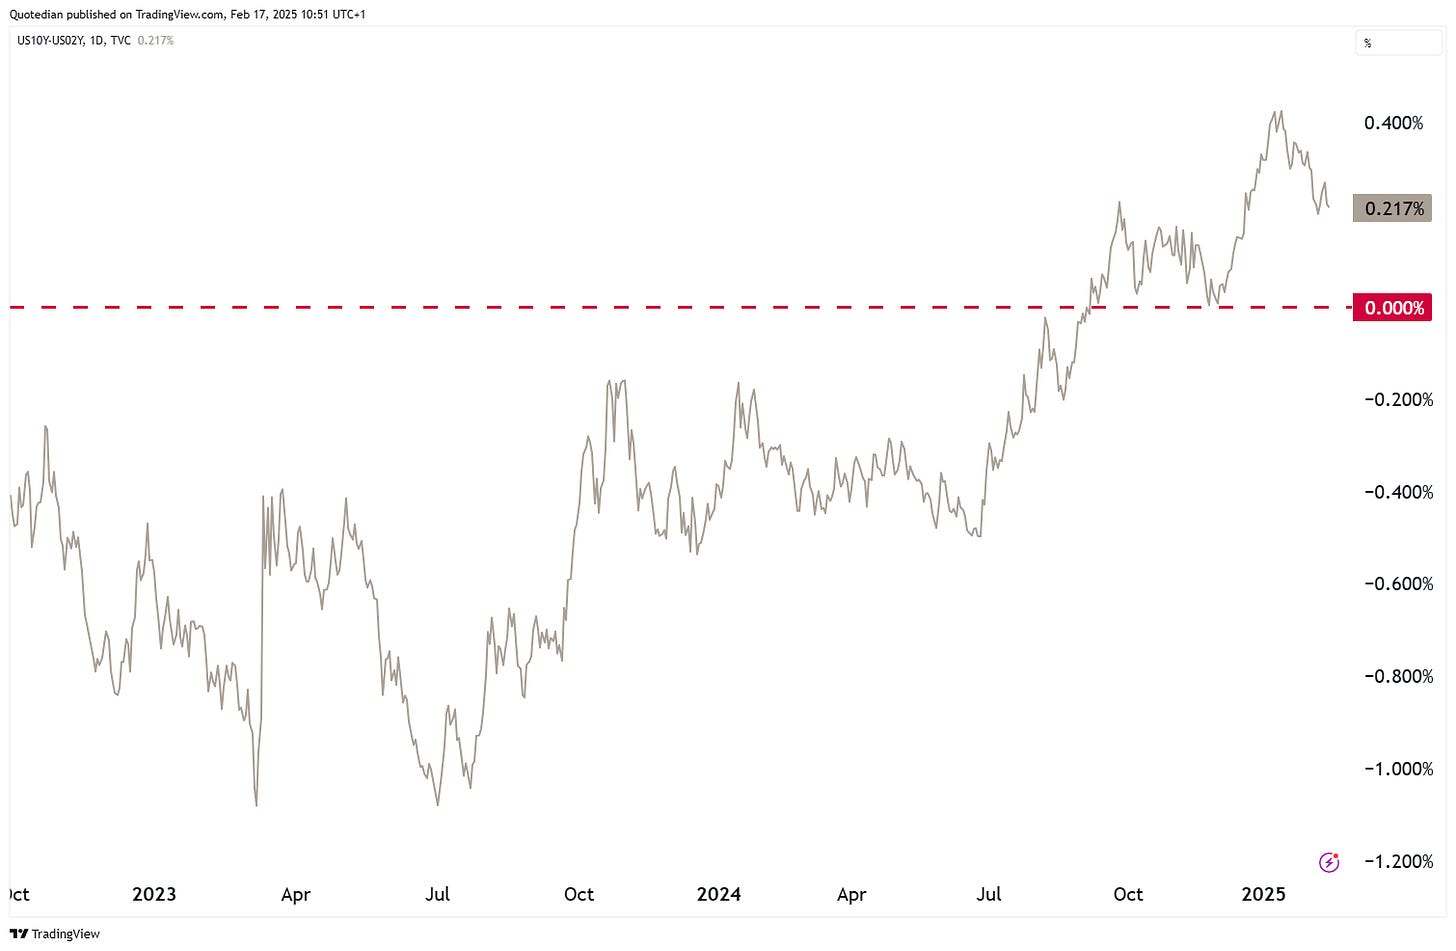
FWIW, the curve (10y-2y) has been flattening recently again as yields have come down at the long end of the term structure:
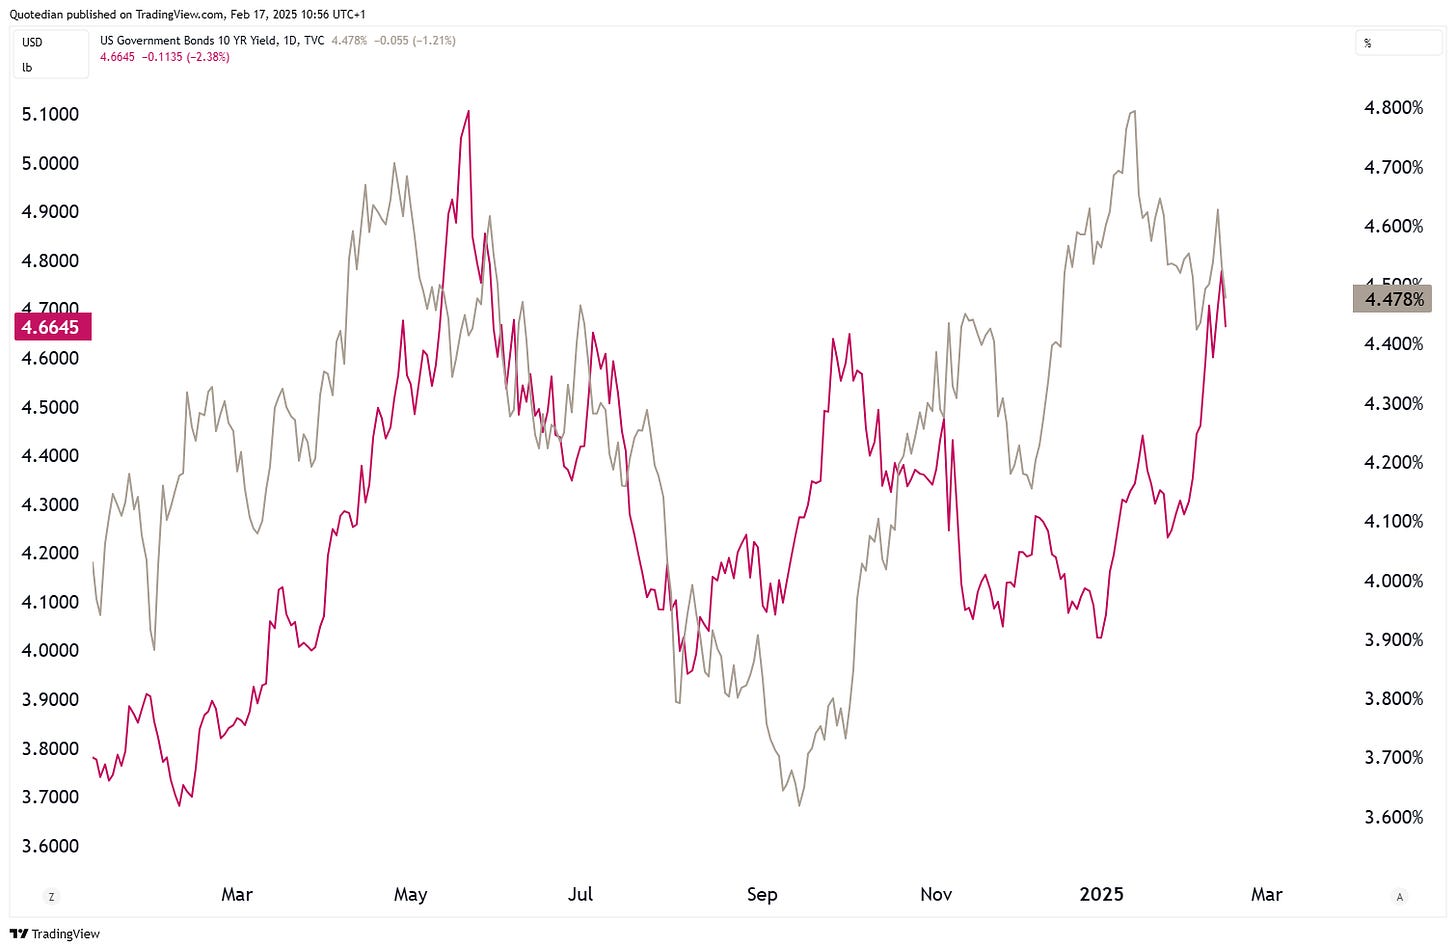
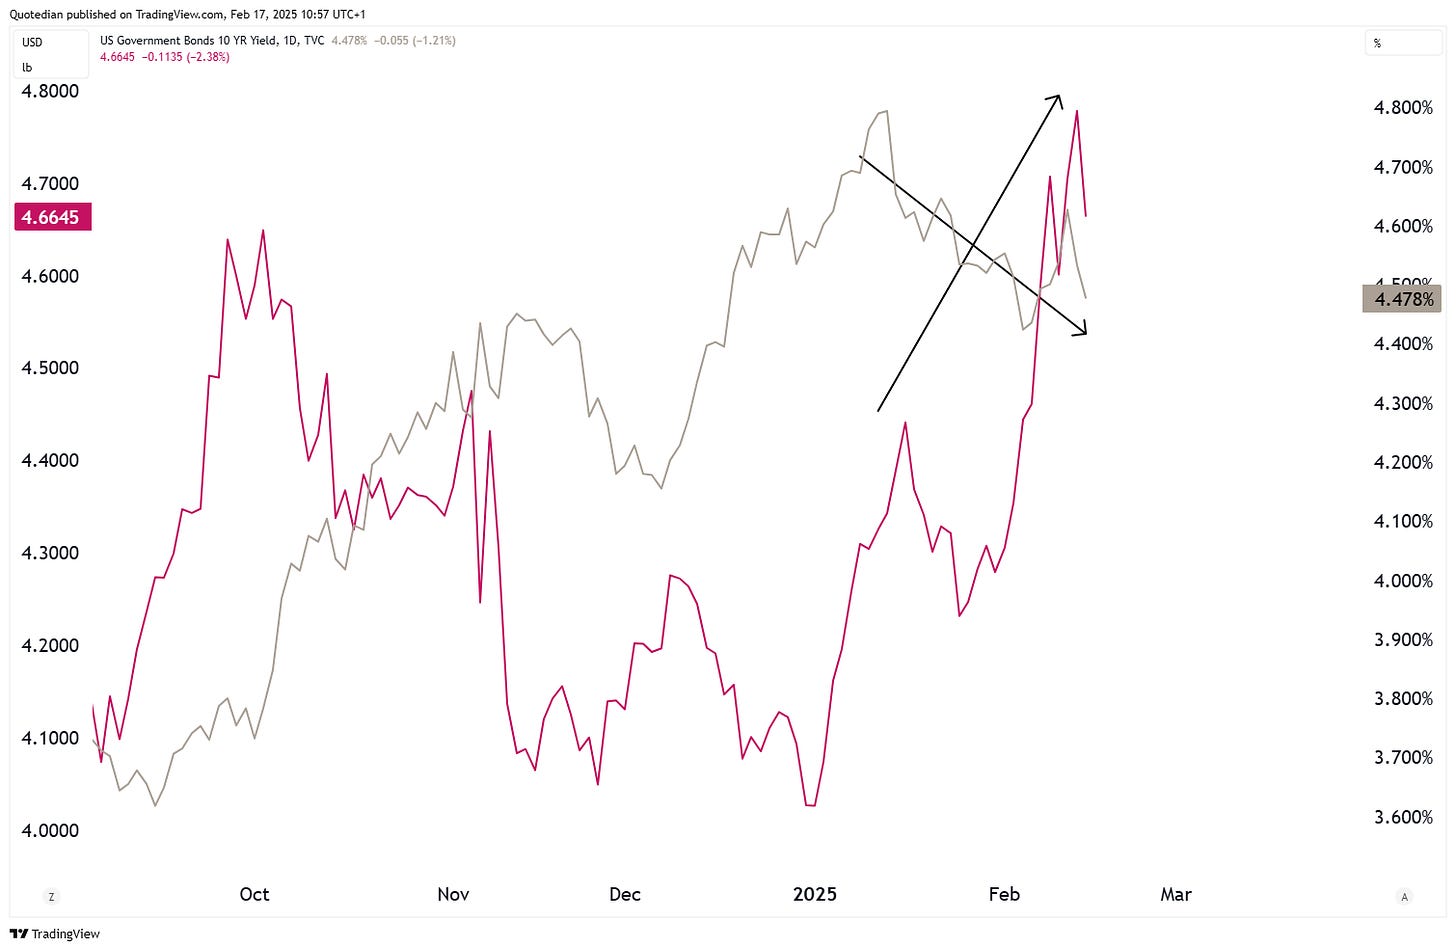
Last Thursday’s and Friday’s weakness observed on yields (grey) is somewhat at odds with what has been going on in the price of copper (red) recently:
A close-up is probably slightly more revealing:
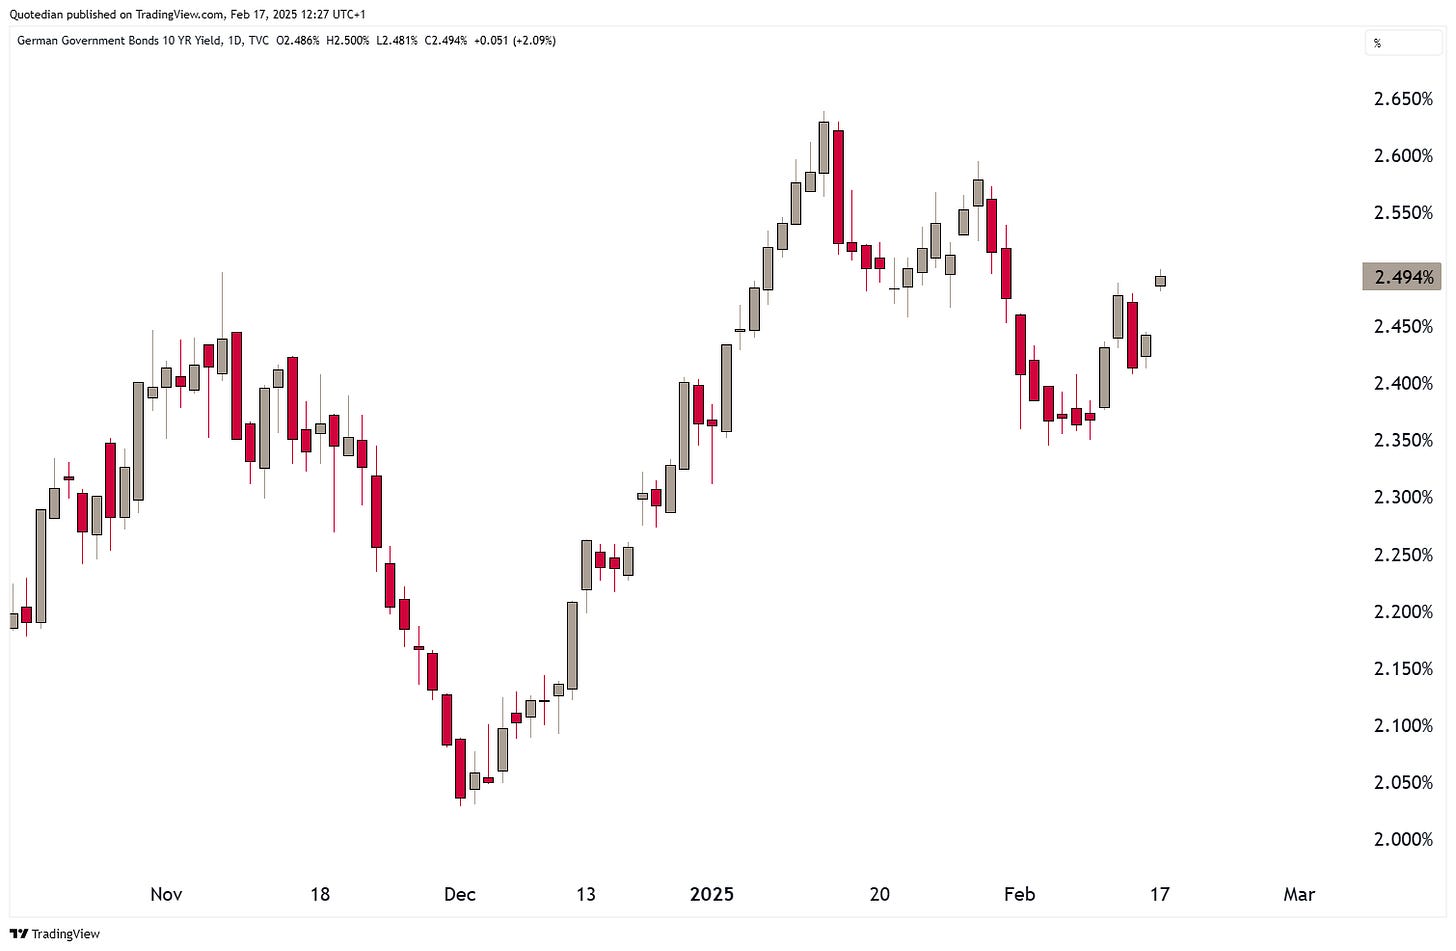
German yields as proxy for the Eurozone are sharply higher this Monday (17.2.) morning, as European leaders are emergency meeting in Paris today, to discuss increased defence spending as they fear being pushed into a disastrous deal. Here’s the 10-year Bund (nominal) yield:
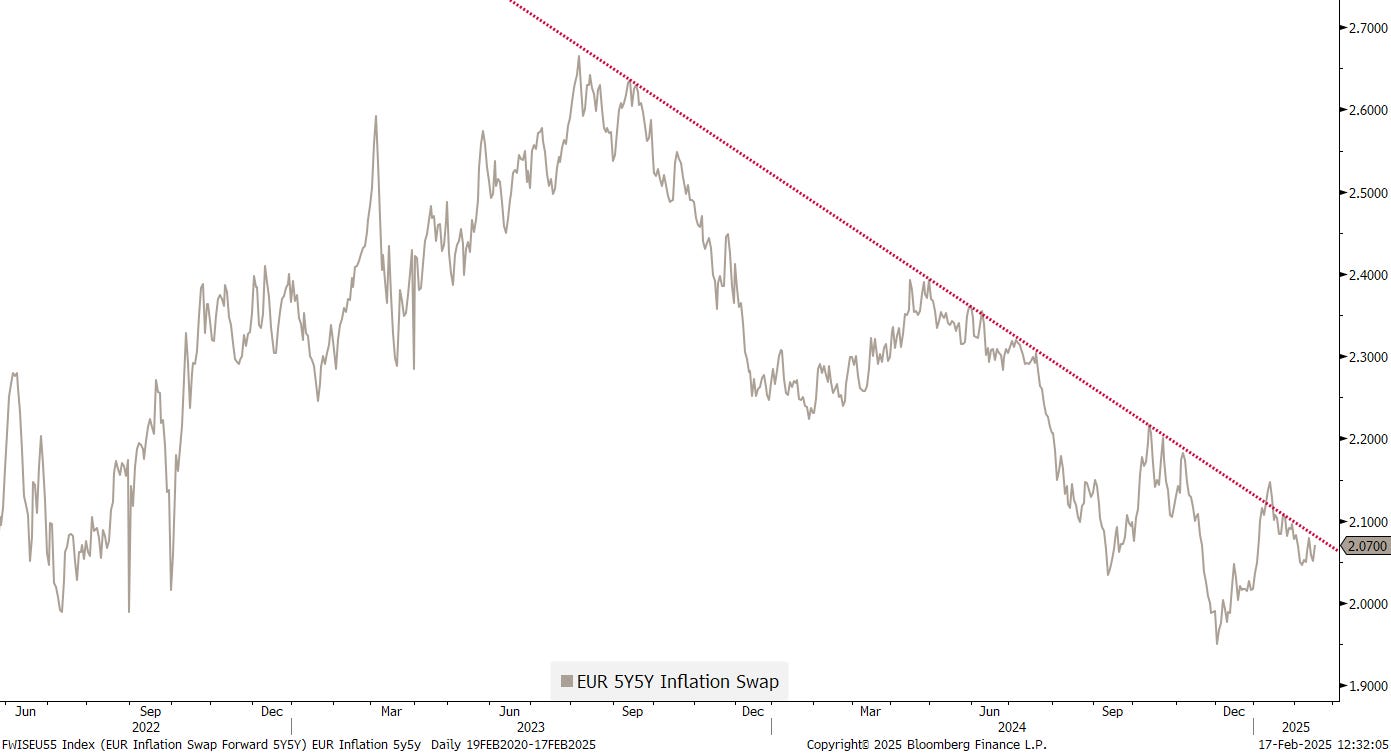
Inflation expectation, via the 5-year, 5-year swap rate is relatively contained for:
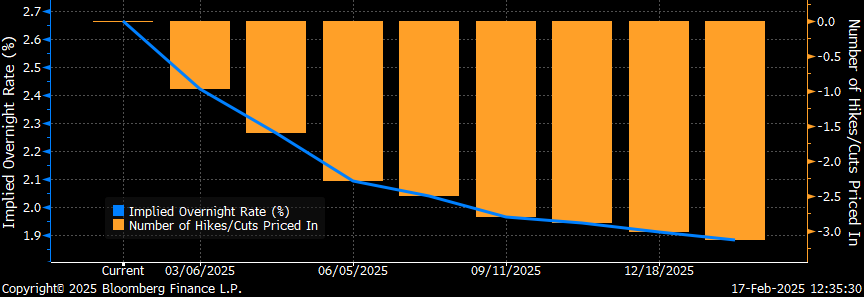
Given that the market still expects three ECB rate cuts,
there is probably still a long-trade to be made on the inflation numbers.
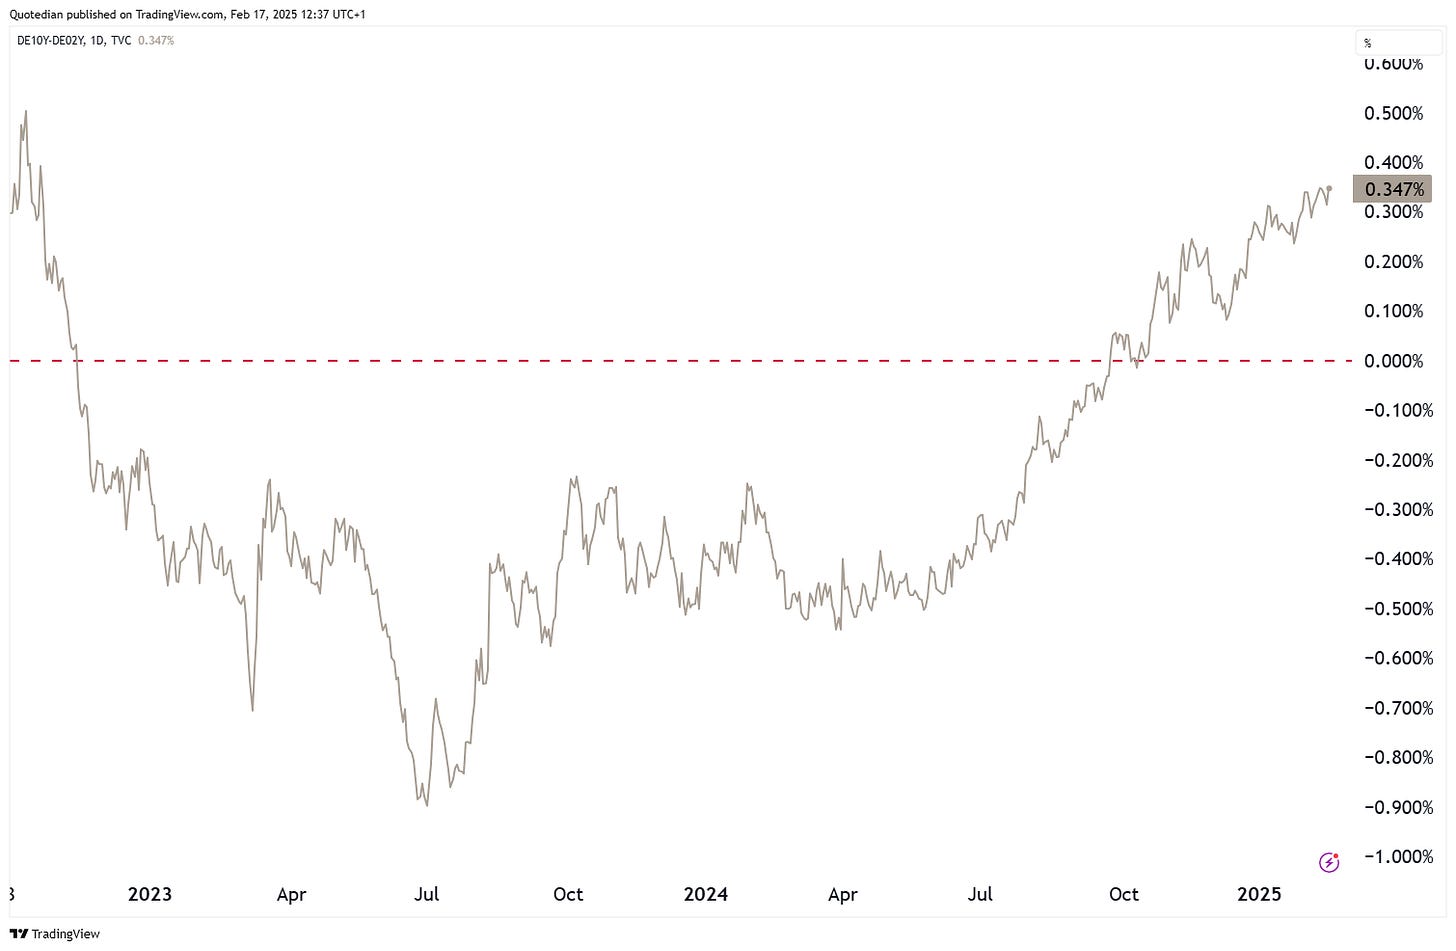
This is also indicated by a further steeping of the yield curve (10y-2y):
As fore-mentioned, credit spread continue to trade close to record tightness and continue to contract:
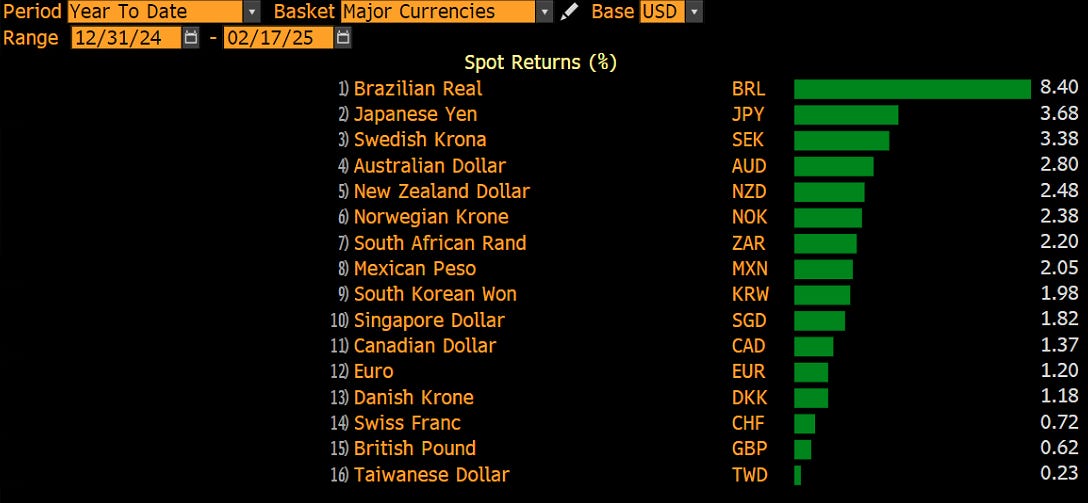
Currencies seem to have been all over the place, but the truth is that most major currencies are now showing small to not so small gains versus the US Dollar:
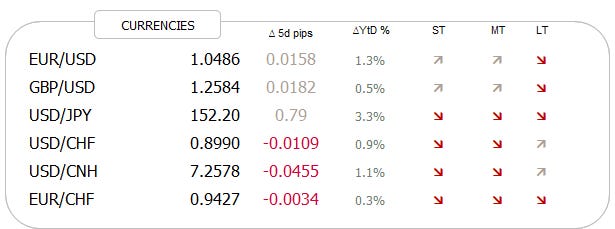
Recent Dollar weakness has changed the direction of the short- and intermediate trend arrows, though the long-term trend remains up for the Greenback for now (ex versus the JPY):
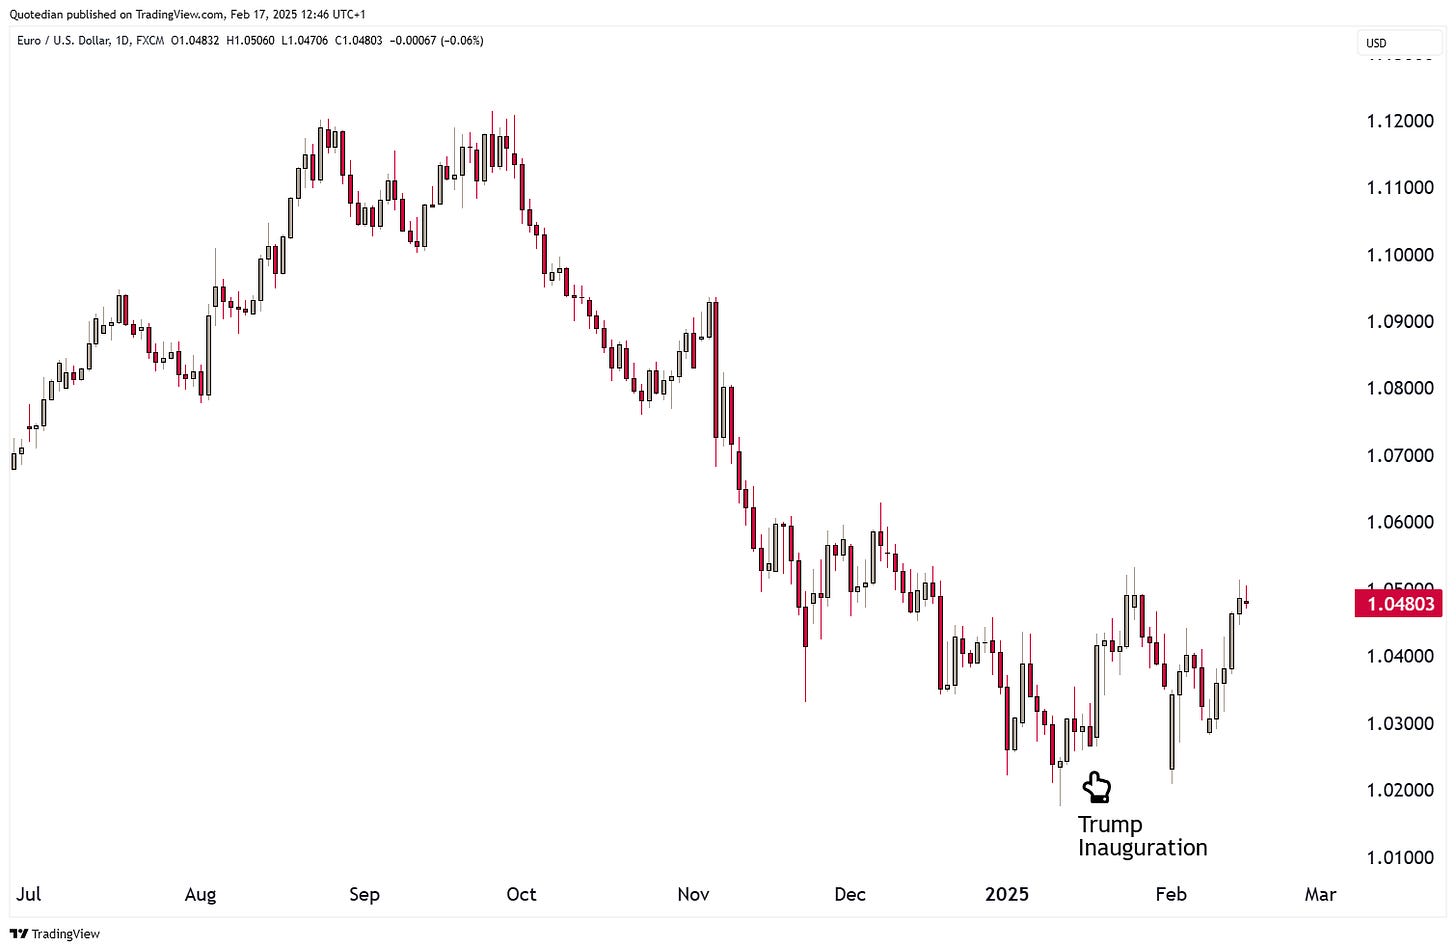
Looking at some charts and starting with the EUR/USD chart, we note that the Dollar found a top (EUR a bottom) on exactly inauguration day:
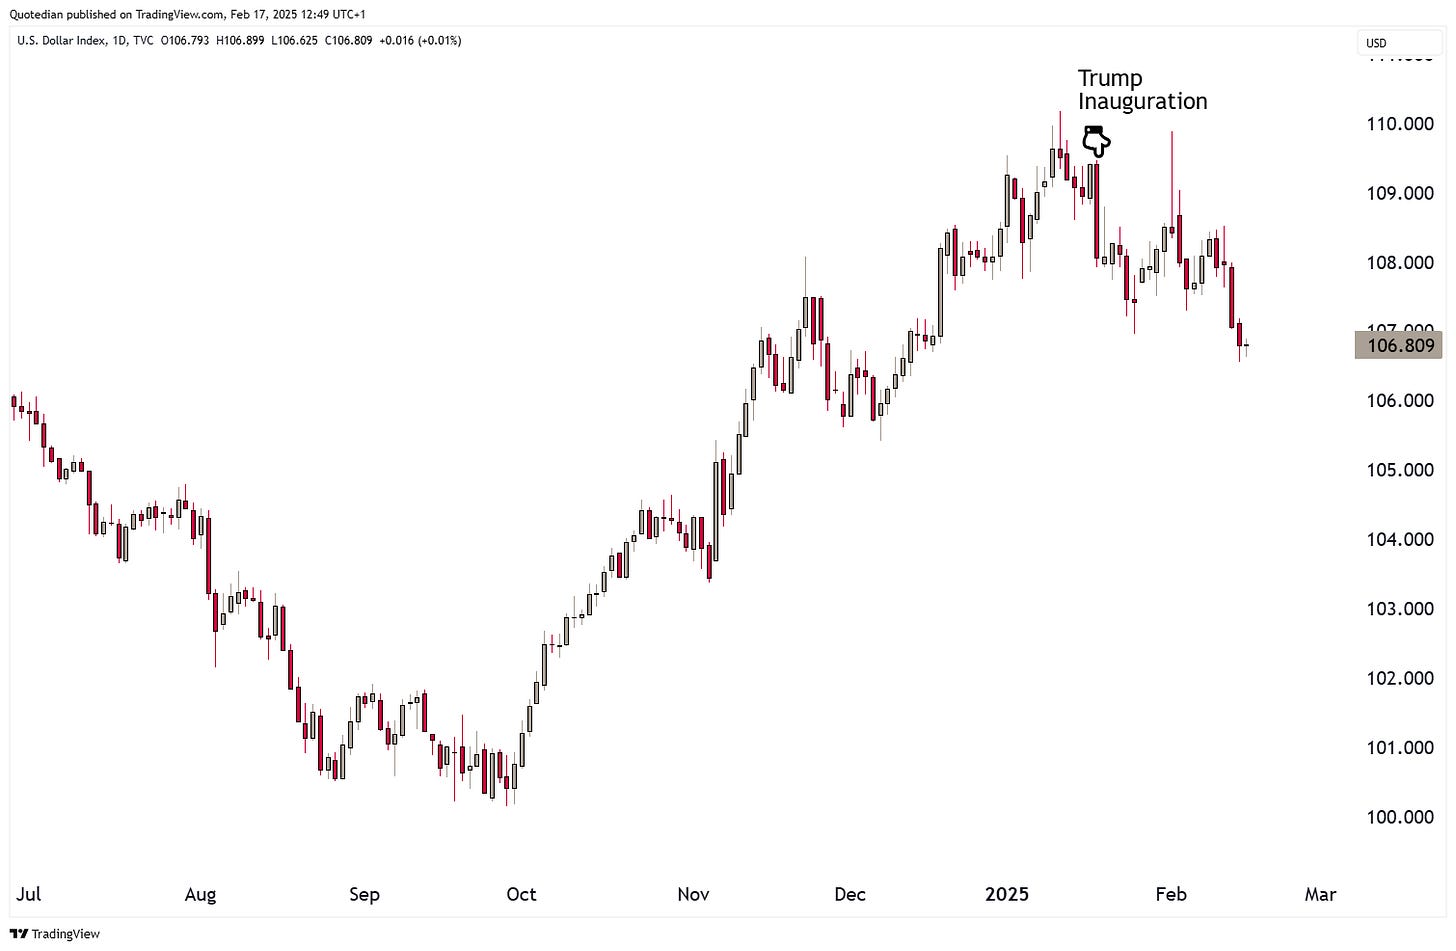
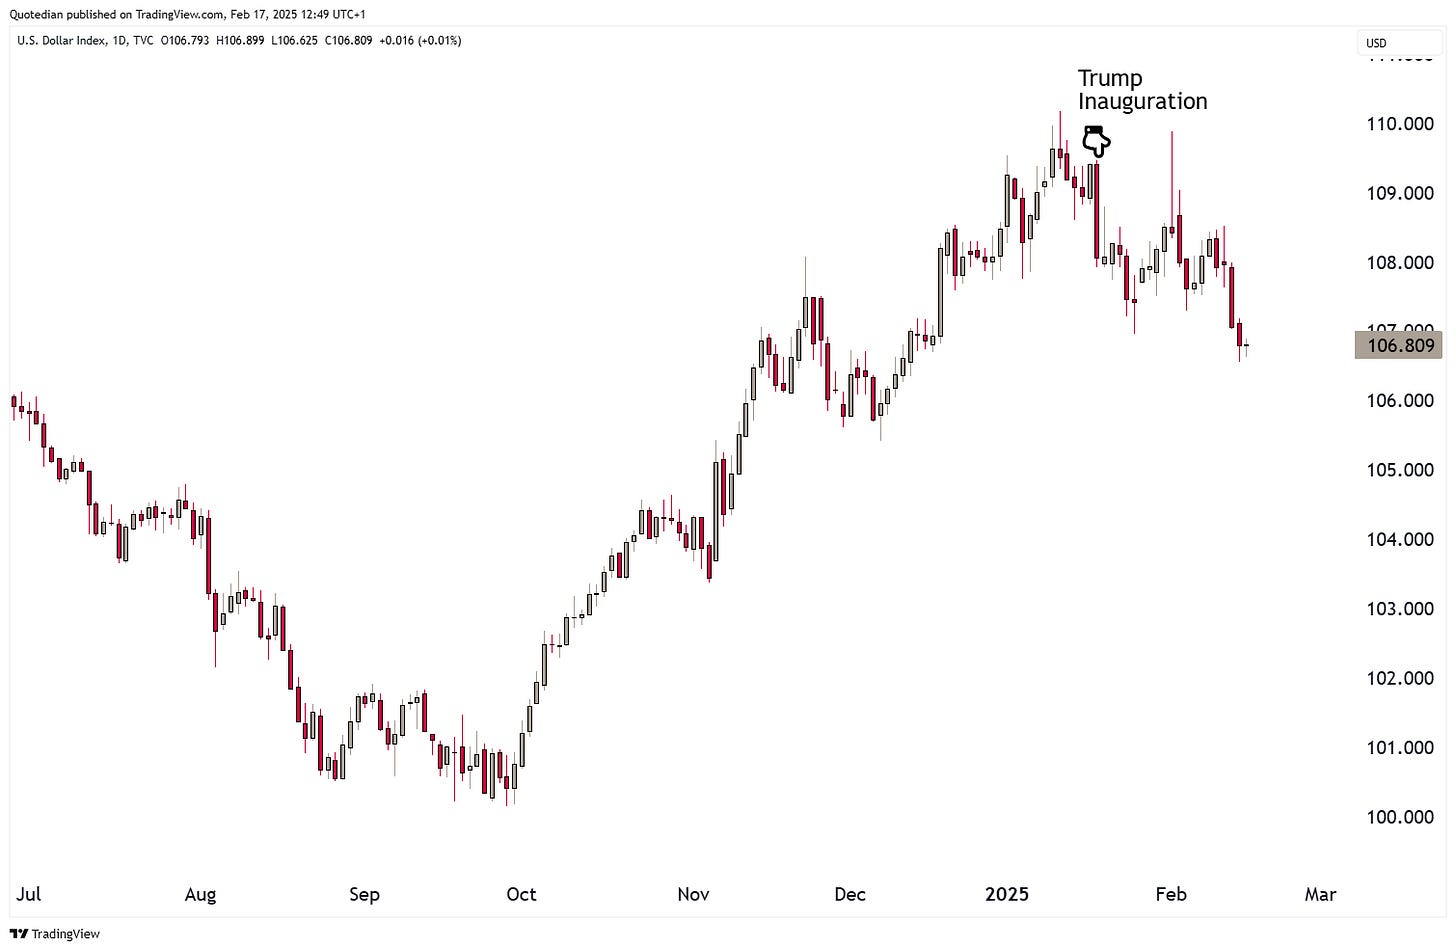
The Dollar Index (DXY) itself had topped out a few days earlier:
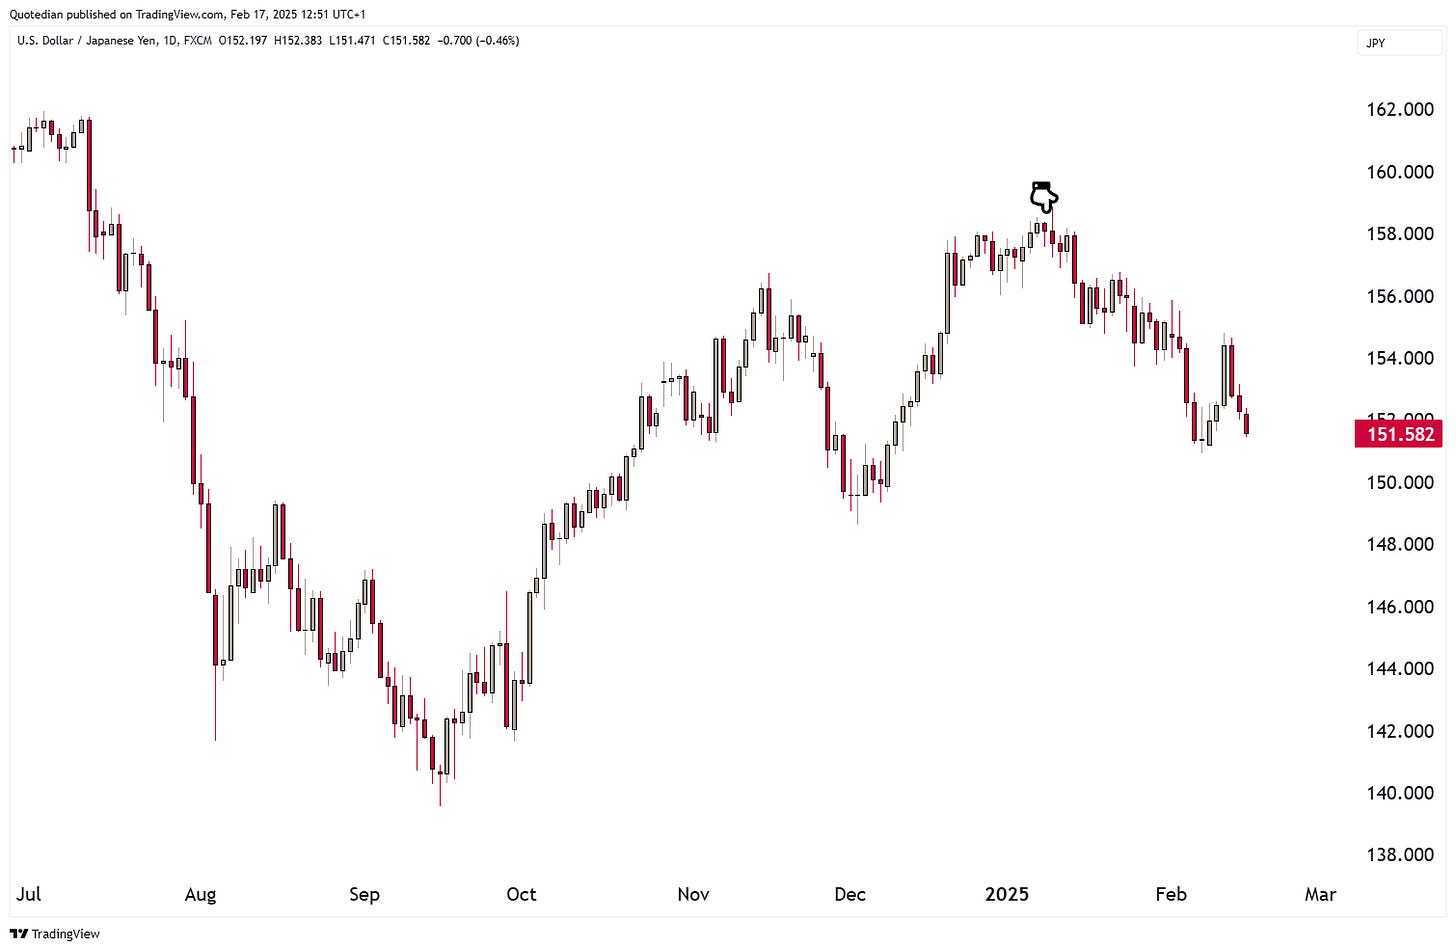
This may be partially explained by a JPY strength found around the 10th January. The JPY has about a 14% weight in the Dollar Index:
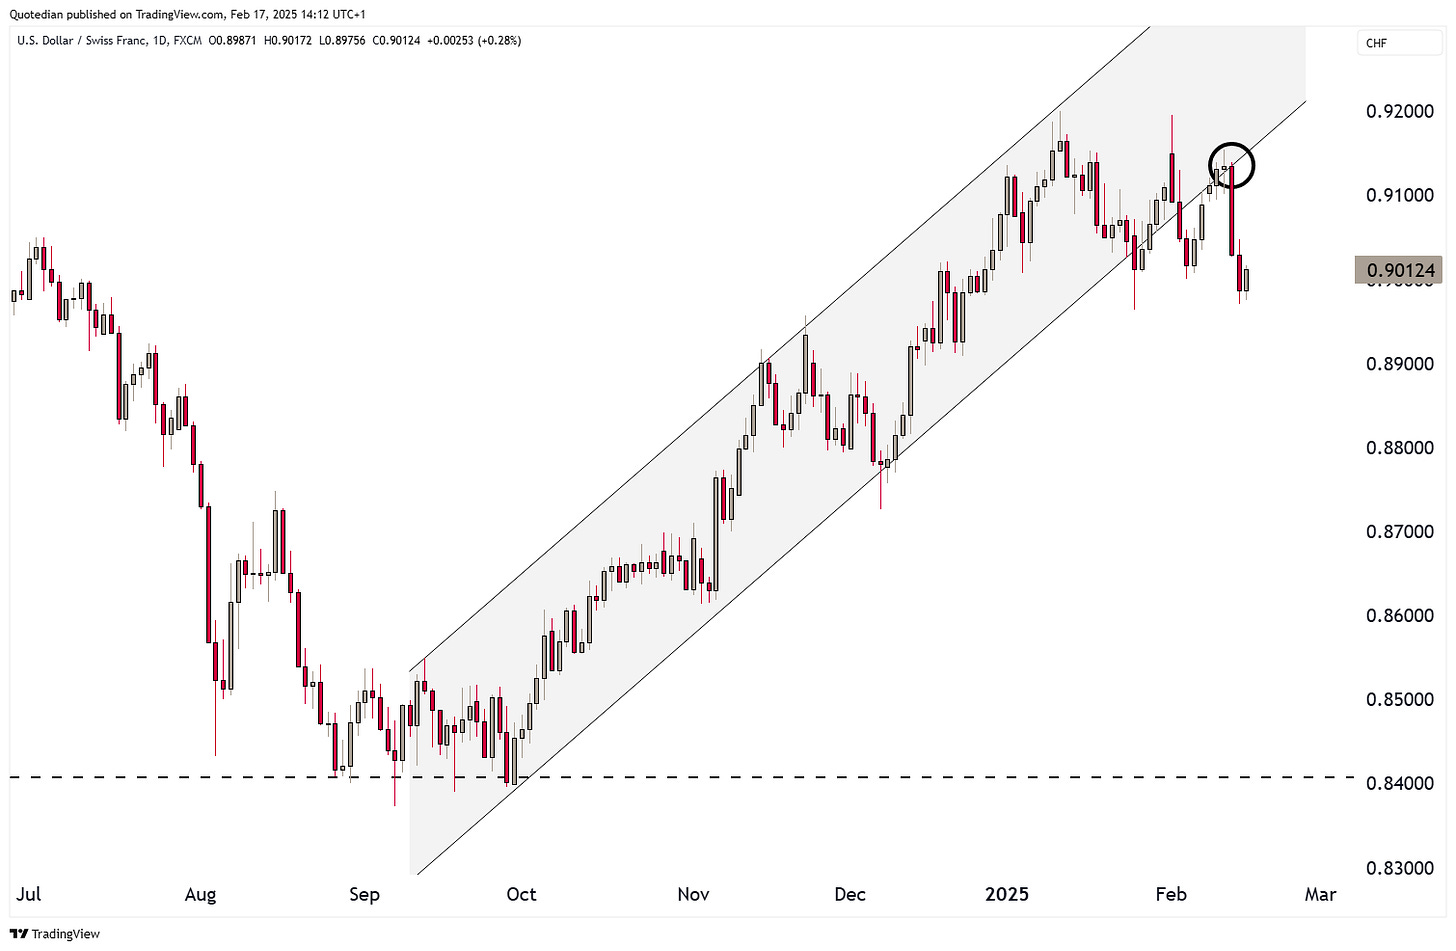
The Dollar held relatively well up versus the Swiss Franc, but now also seems to have picked up on a new short- to intermediate term downtrend:
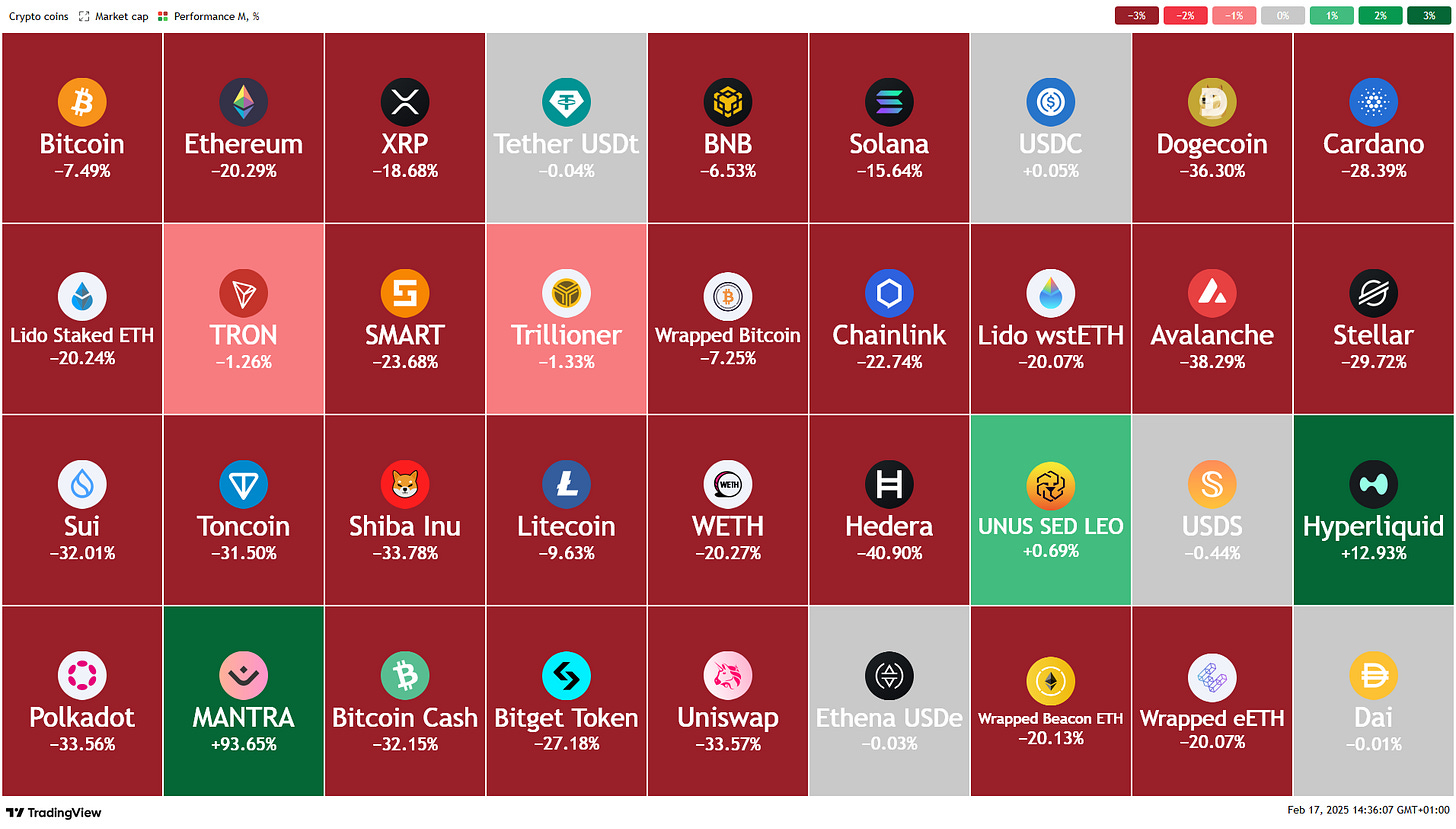
And finally, cryptocurrencies seem to have gone into some consolidation mode, as the heatmap of monthly performance of cryptocurrencies with a market cap >$4.7bn shows:
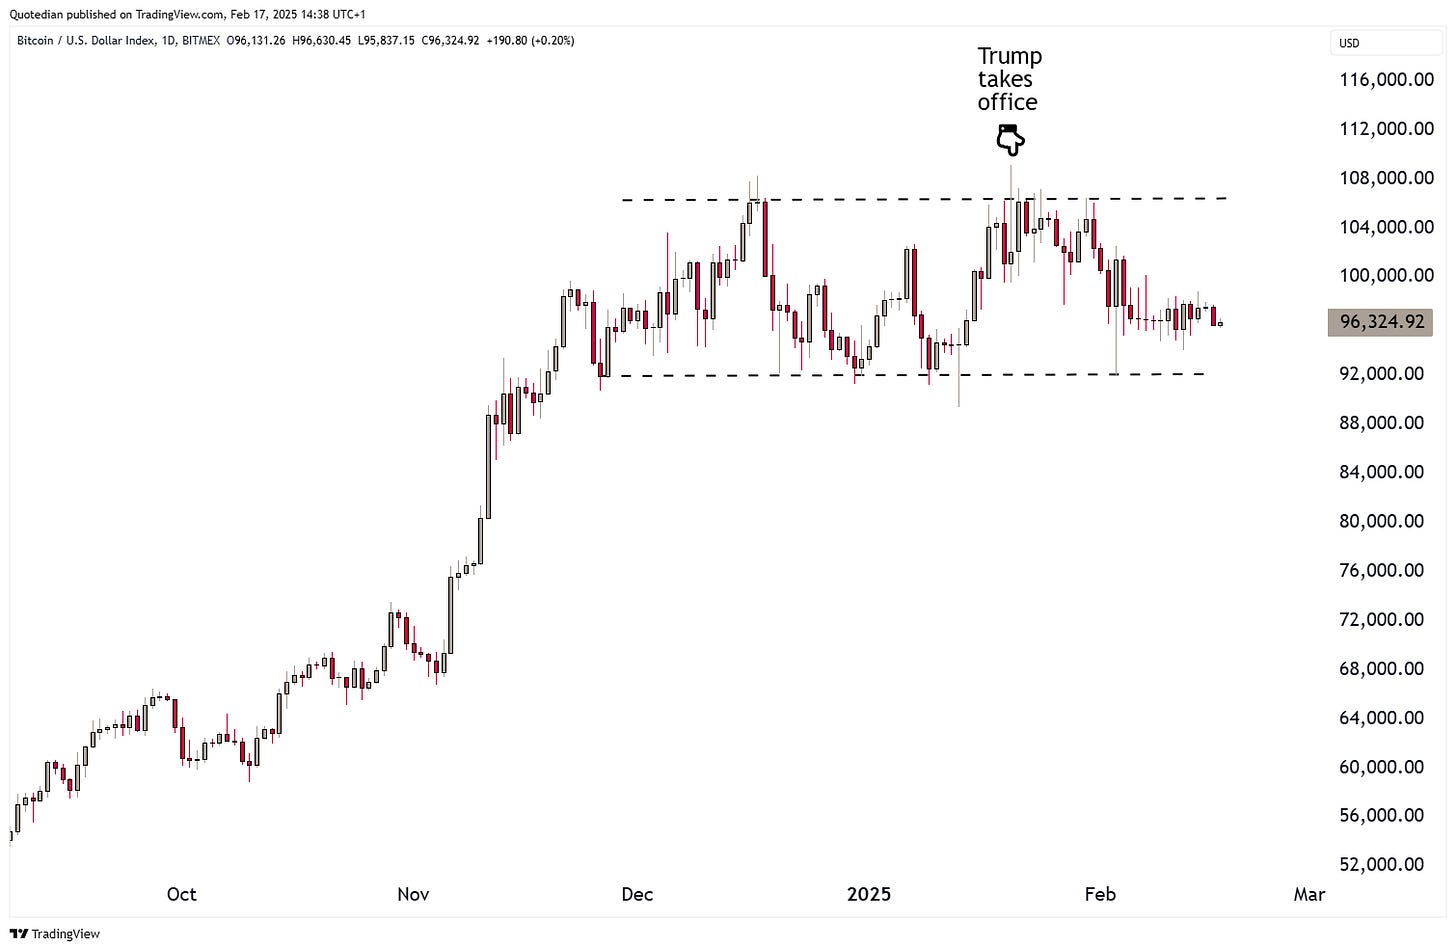
Expressed in one chart (Bitcoin):
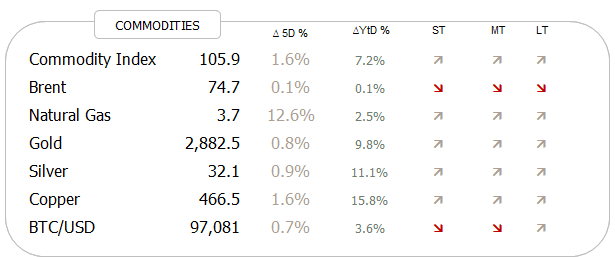
Time to move into the commodities realm, where we see uptrends all across, notable exception crude oil:
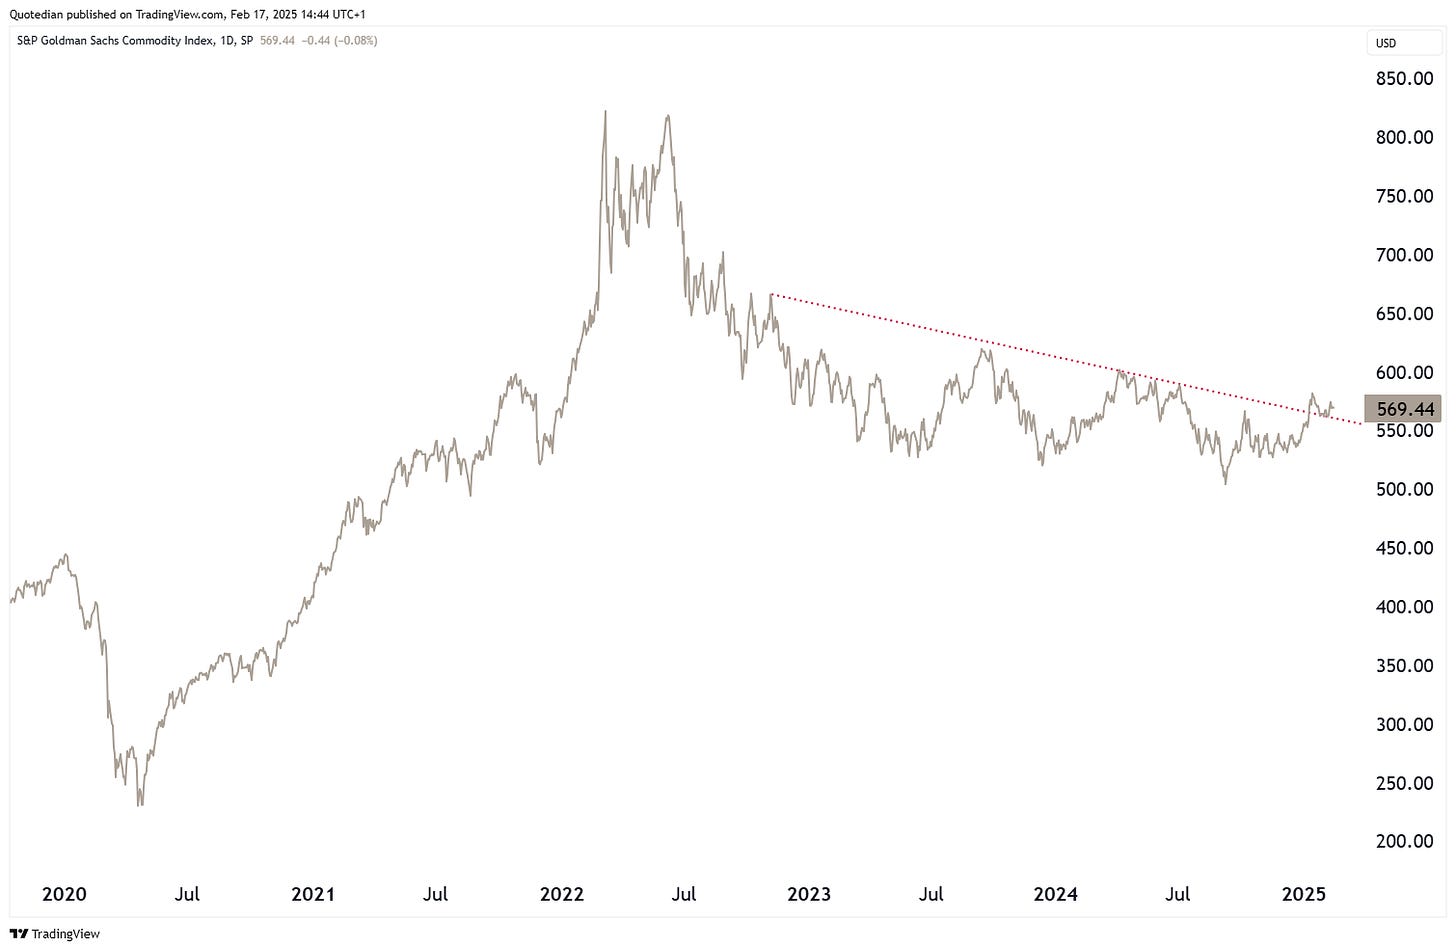
The energy-heavy (54%) S&P GSCI Commodity index is trying to push higher,
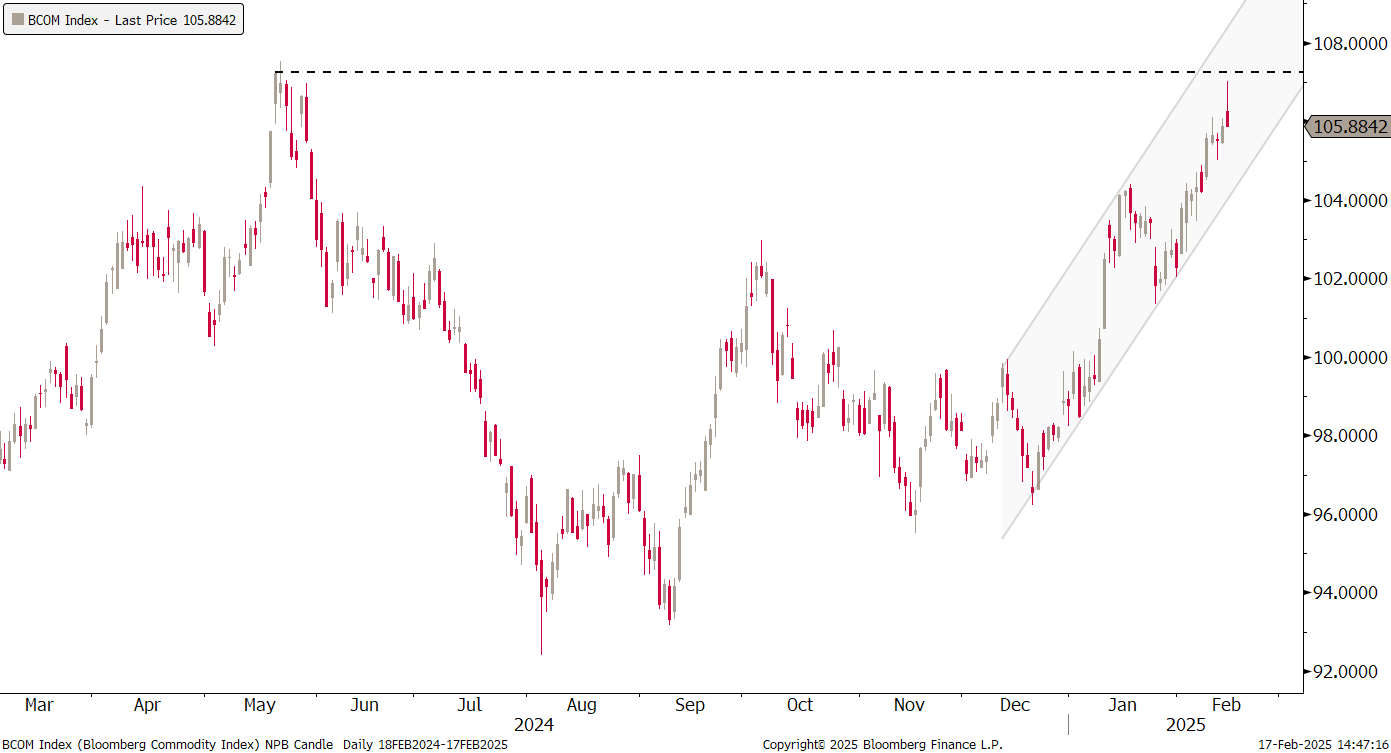
whilst the BCOM index, which has a lower energy-share in favour of more precious metal exposure, is looking even better, thanks to the recent gold rally:
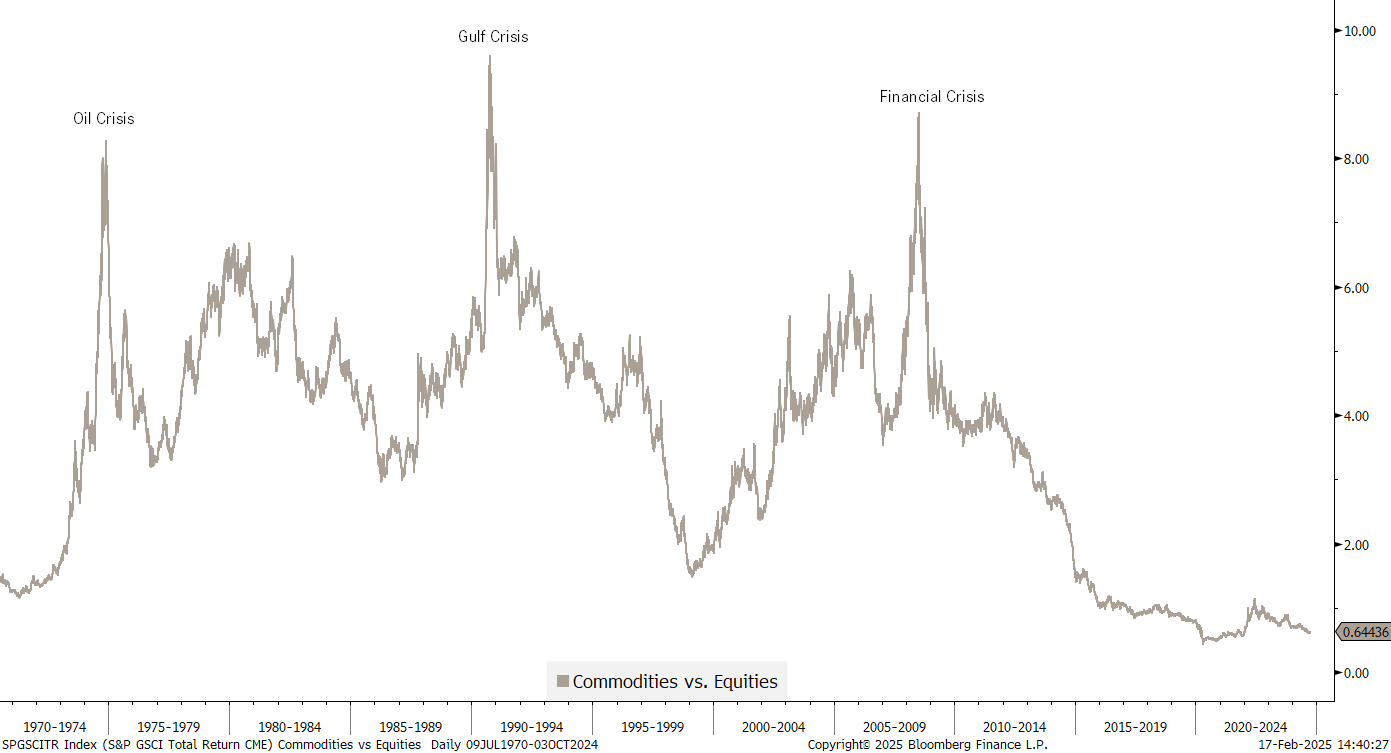
… though on the long-term chart and in relation to equities, it is difficult for commodities to outperform as long as stocks have such a good run:
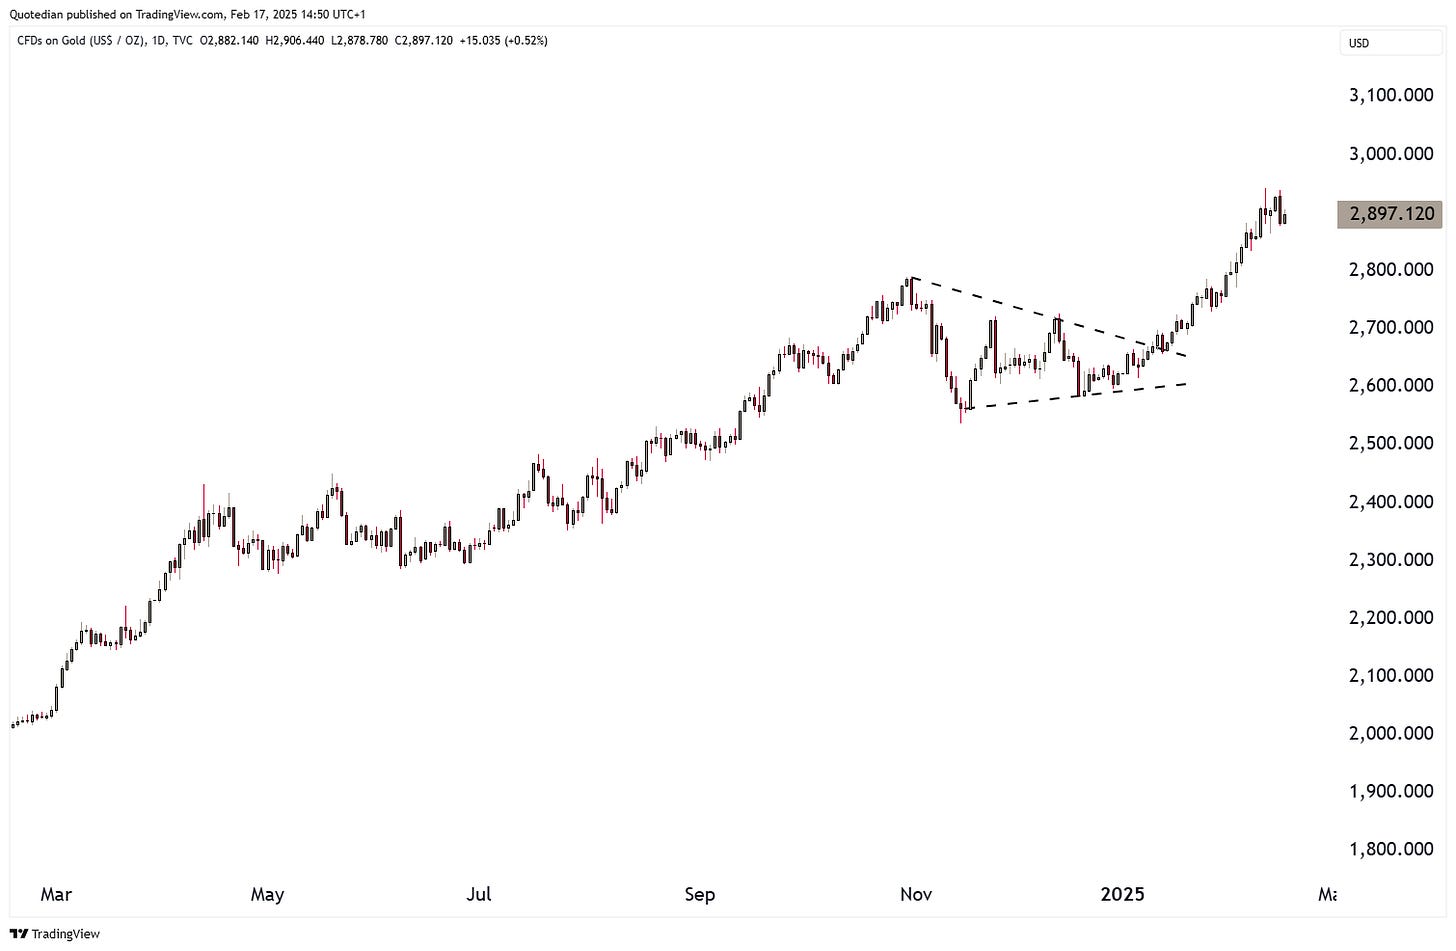
Gold has been pushing relentlessly higher and even though it trades below $2,900 at the time of this writing, the immediate price objective remains somewhere between $3,080 and $3,150:
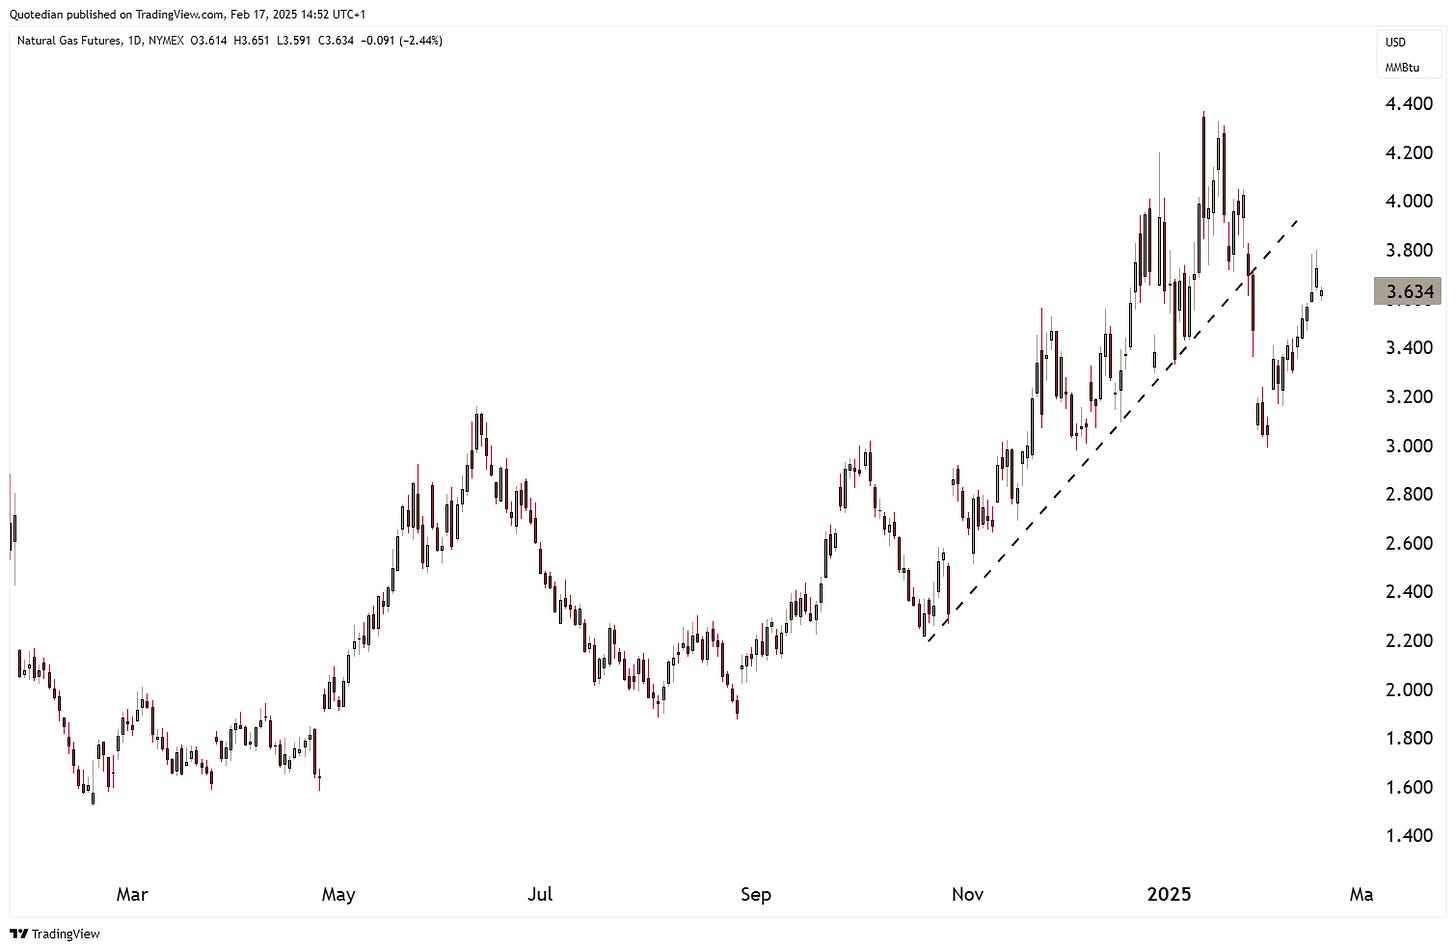
Natural gas in the US is rallying again after the end of January slump:
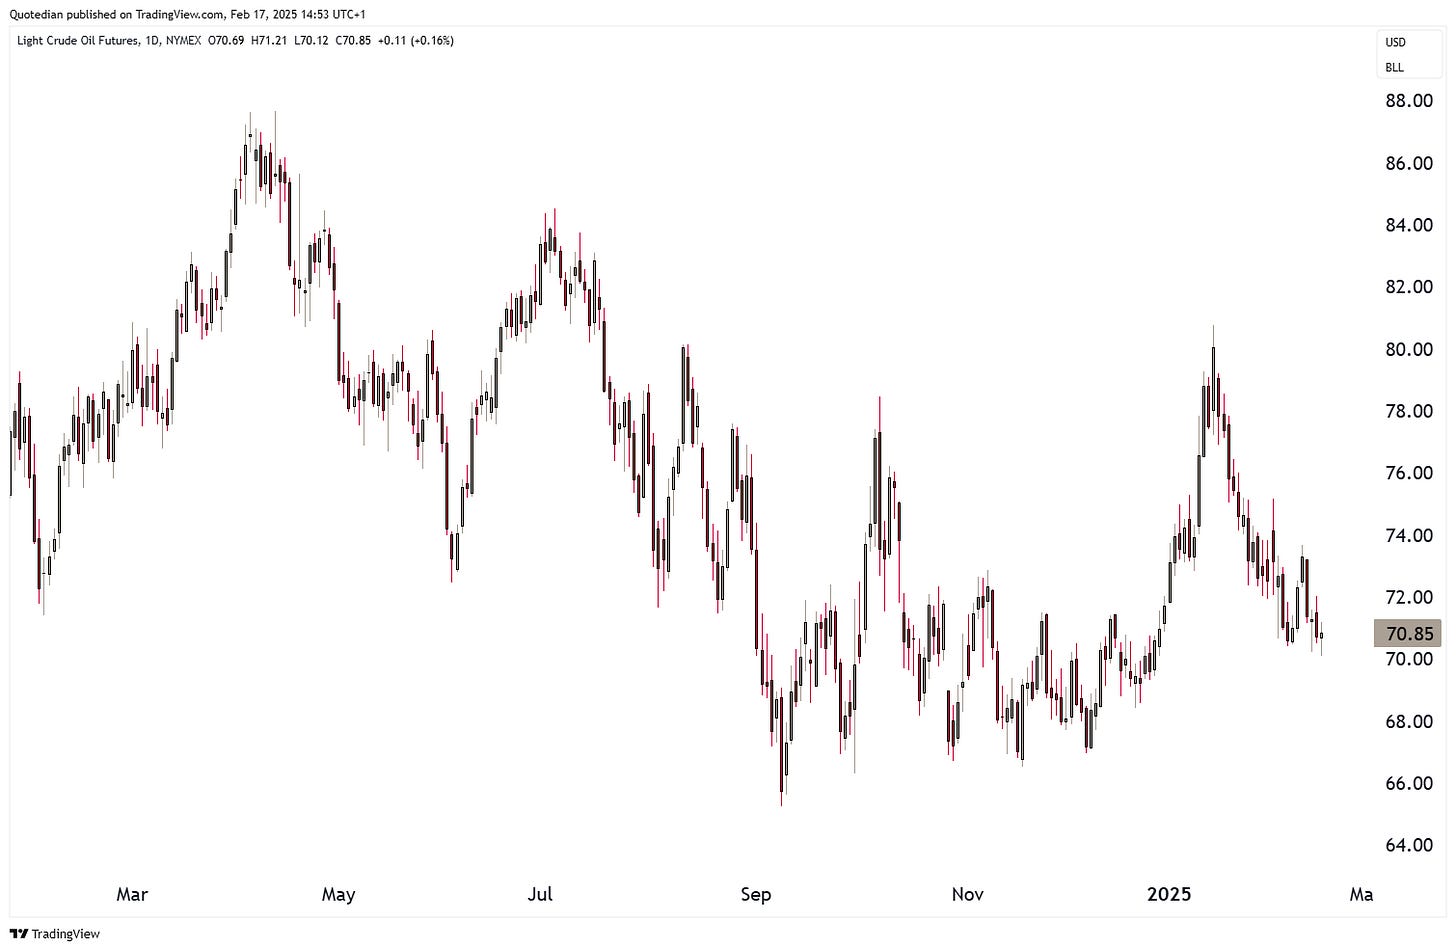
Whilst the oil chart (WTI) remains uninterpretable:
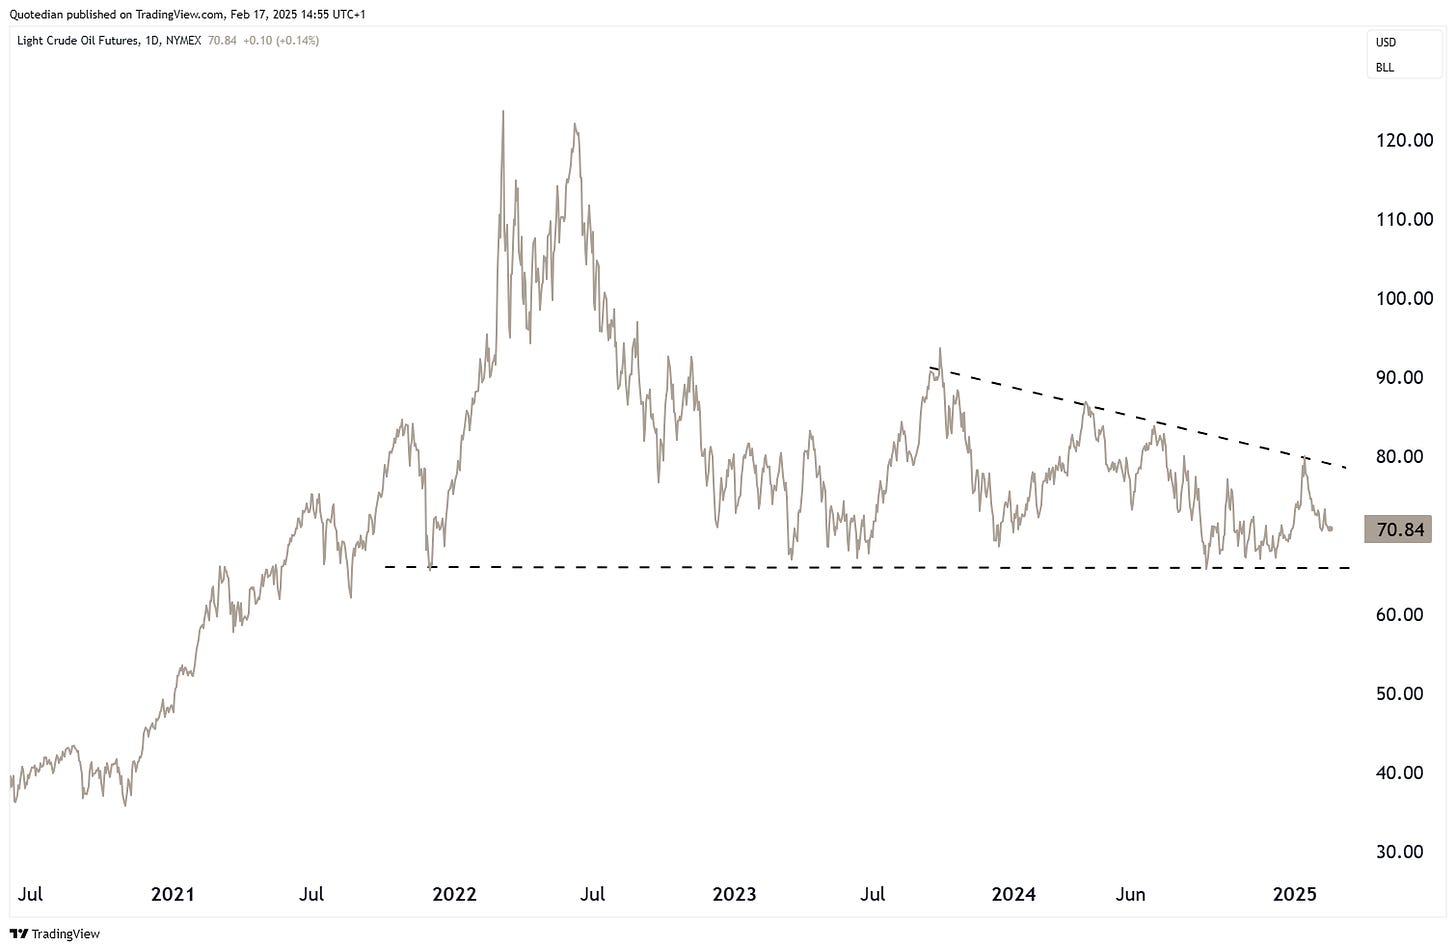
Maybe if we zoom out on the same chart, we find something meaningful:
Nope.
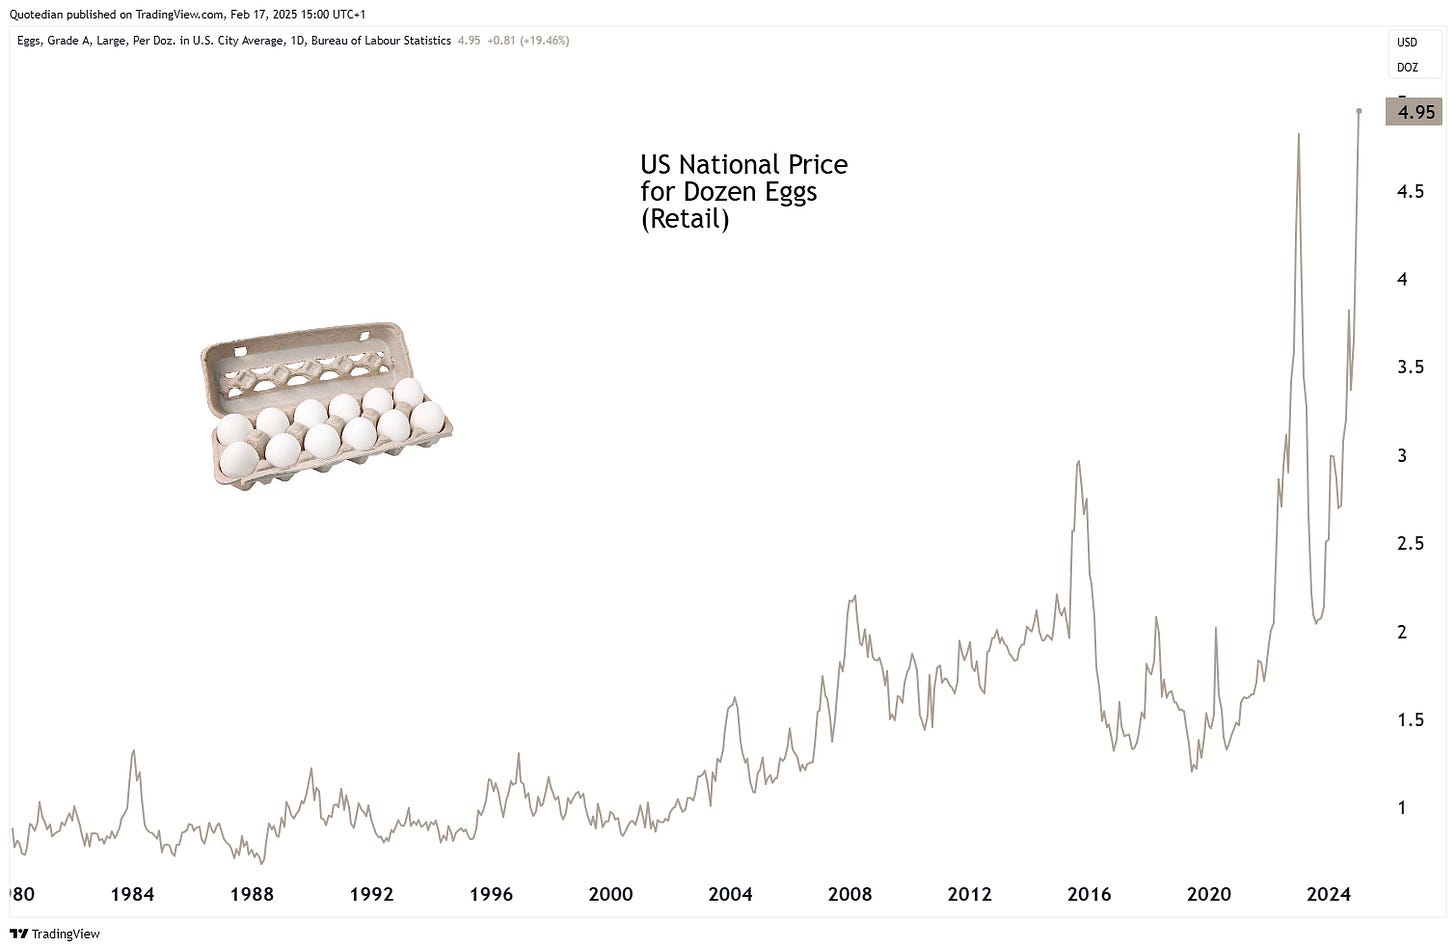
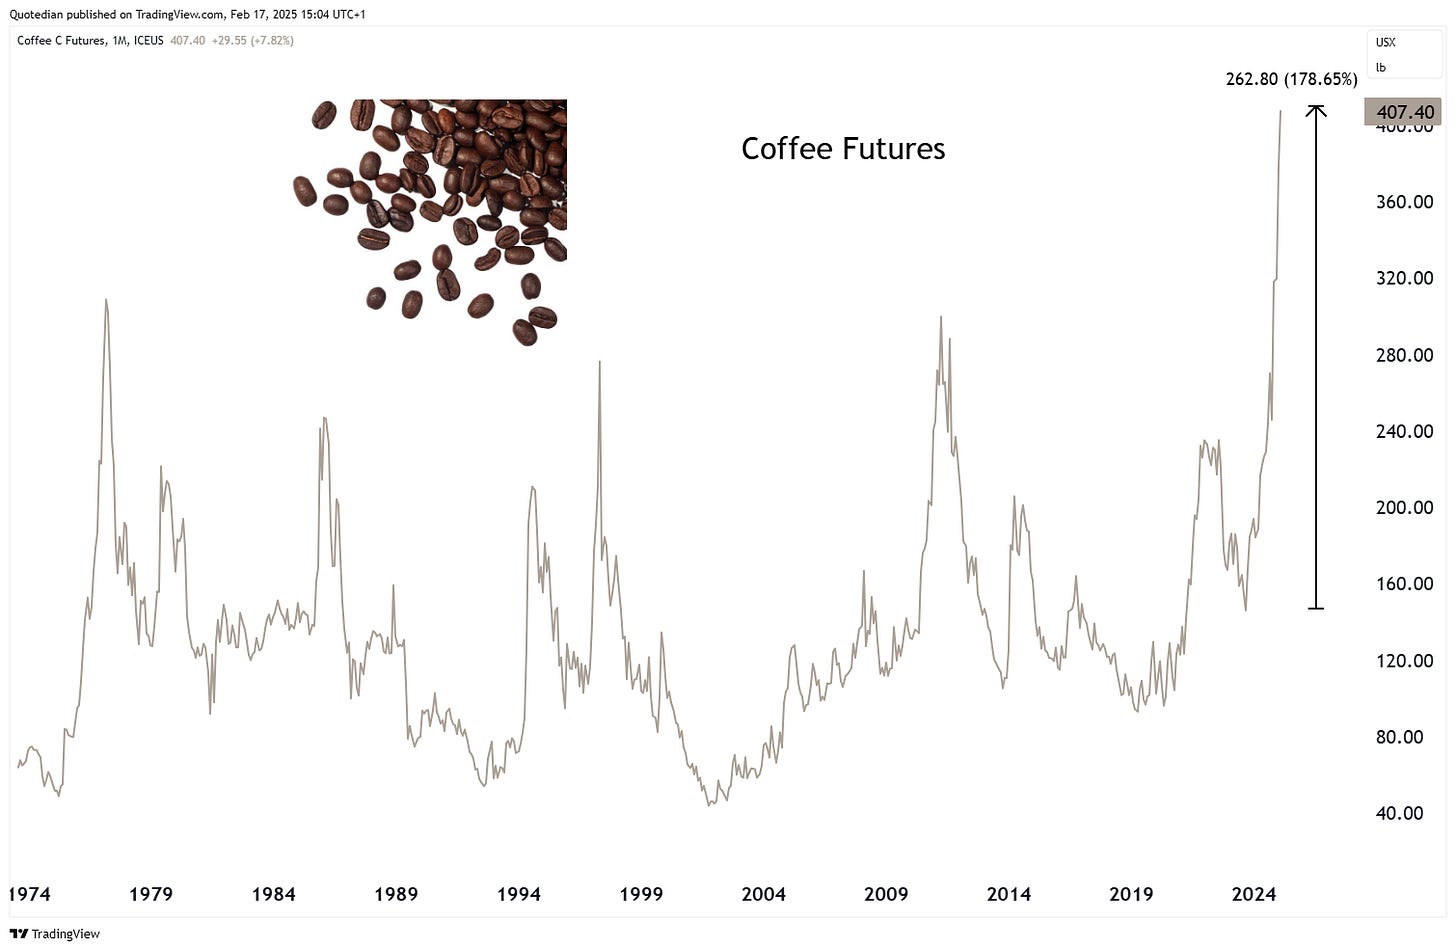
But let’s finish the commodity section with the real tragedy going on …
Coffee prices have nearly doubled:
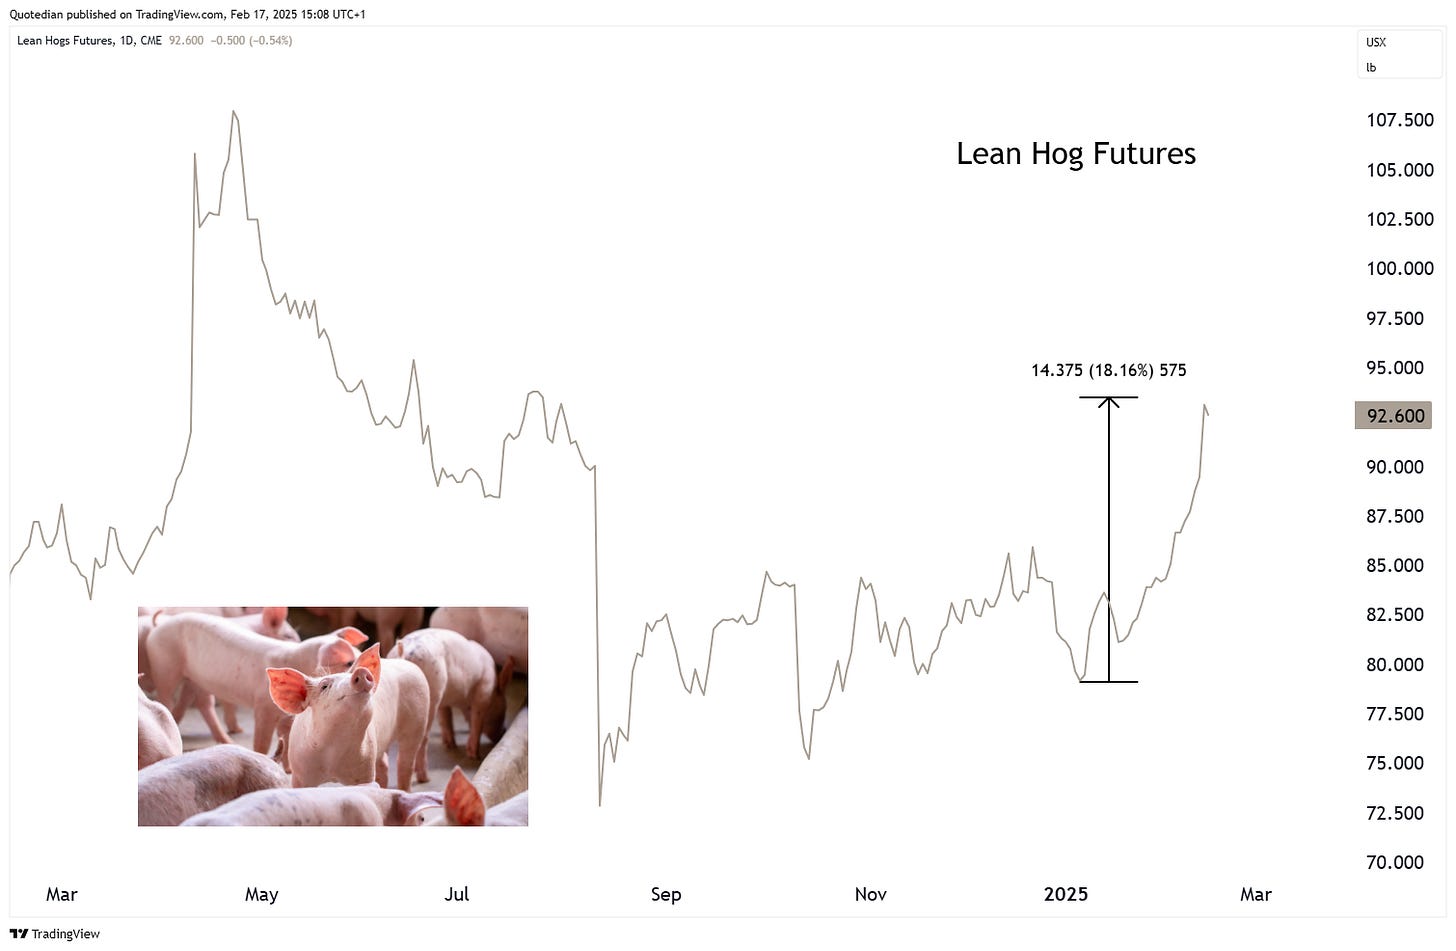
Lean hog futures are up 20% since the beginning of the year,
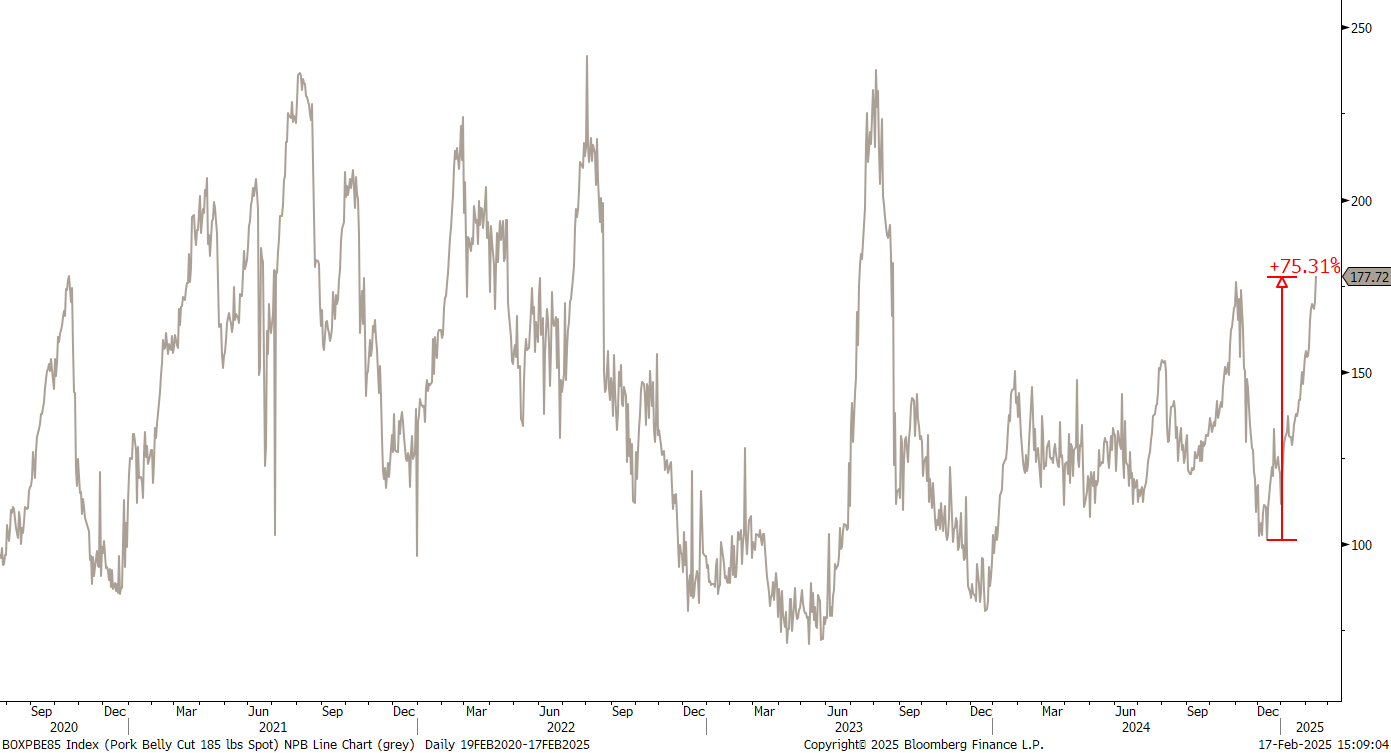
which in turn has led to a 75% increase in the price of Boxed Pork Belly Cut 200lbs:
All in all, your breakfast has just become much more expensive!
That’s nearly all for this week, but, one more thing …
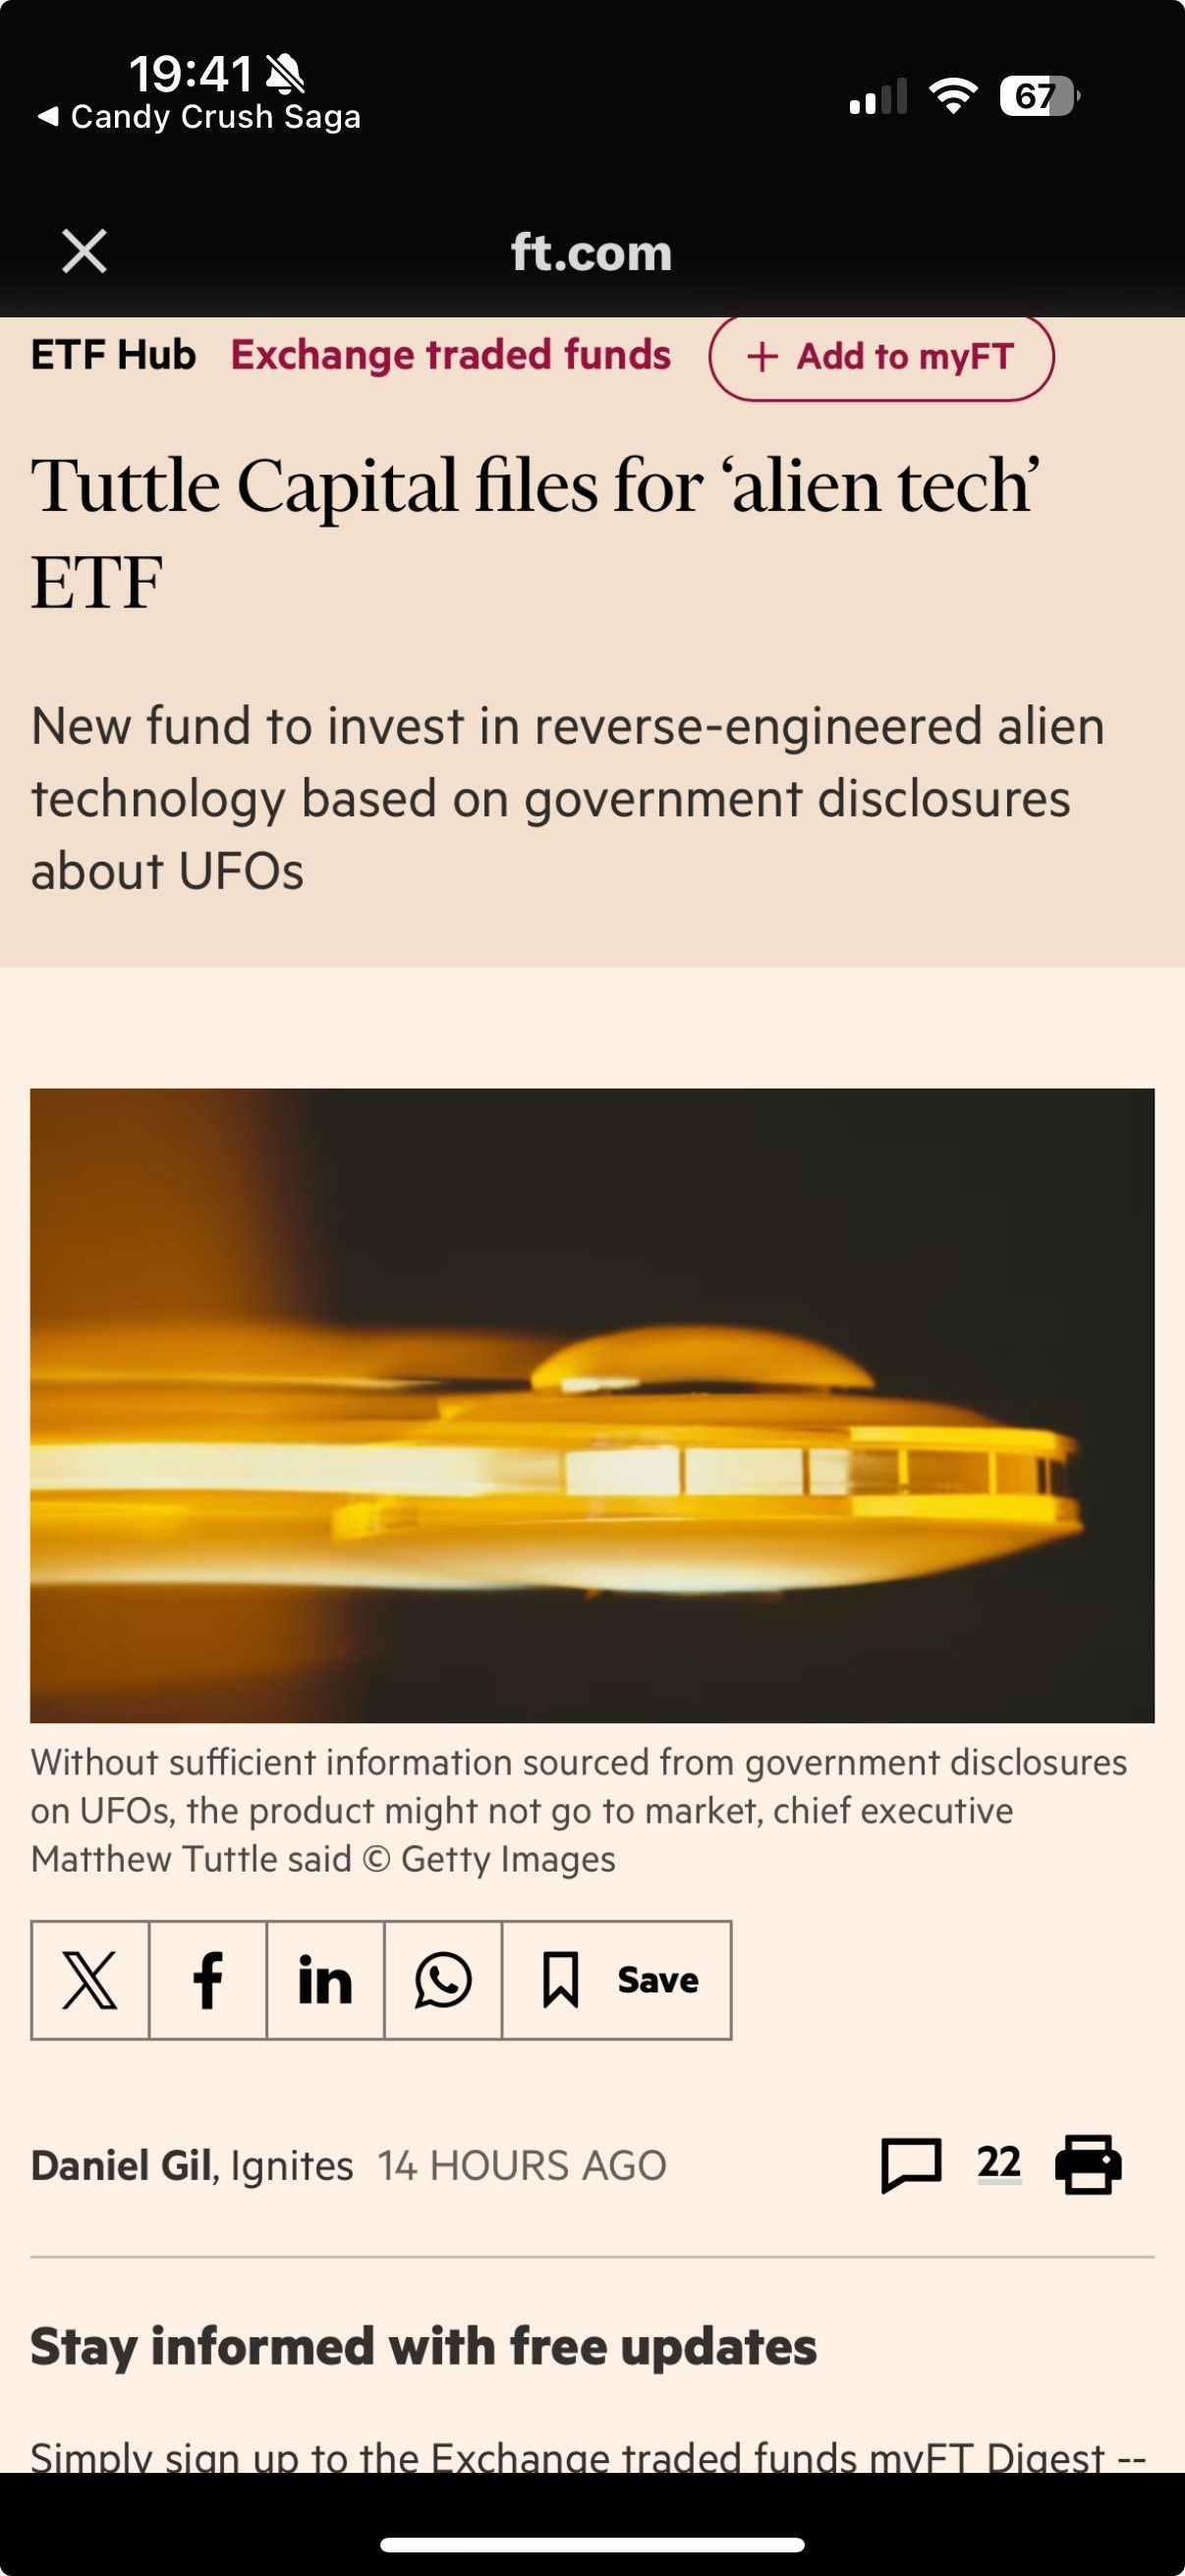
I had to check my calendar three times last week, making sure it was not April 1st, upon reading the following headline on FT.com:
Here’s the full article (click here).
The time to reduce portfolio risk is rapidly approaching …
Everything in this document is for educational purposes only (FEPO)
Nothing in this document should be considered investment advice
Investing real money can be costly; don’t do stupid shit
The views expressed in this document may differ from the views published by Neue Private Bank AG
Past performance is hopefully no indication of future performance


