Time for Turkey
Volume V, Issue 173
"I can't cook a Thanksgiving dinner. All I can make is cold cereal and maybe toast."
— Charlie Brown
DASHBOARD
AGENDA
CROSS-ASSET DELIBERATIONS
** Housekeeping **
Absent a massive event today, there will be no Quotedian tomorrow. Therefore, please note that in the Calendar above, data items denoted with asterisks (*) are reported on 25/11. All others today.
Make sure to check your inbox on Sunday for the weekly edition!
US stocks provided another decent rally in yesterday’s session, once again confirming the current uptrend, defined as higher highs and higher lows, and bringing us a step closer to our first target around 4,100 (light green oval):
This bear market rally is now valid unless 3,900 (dark dotted line) breaks to the downside, with the odds, thanks to the seasonal pattern, increasing for a break higher above the downward trending black dashed line and a possible reaching of our second target just north of 4,300 (dark green oval). Breadth was about 2:1 (NYSE), but it also was the lowest volume (S&P) day of the year so far, as indicated by the red dashed line in the volume data on the chart above.
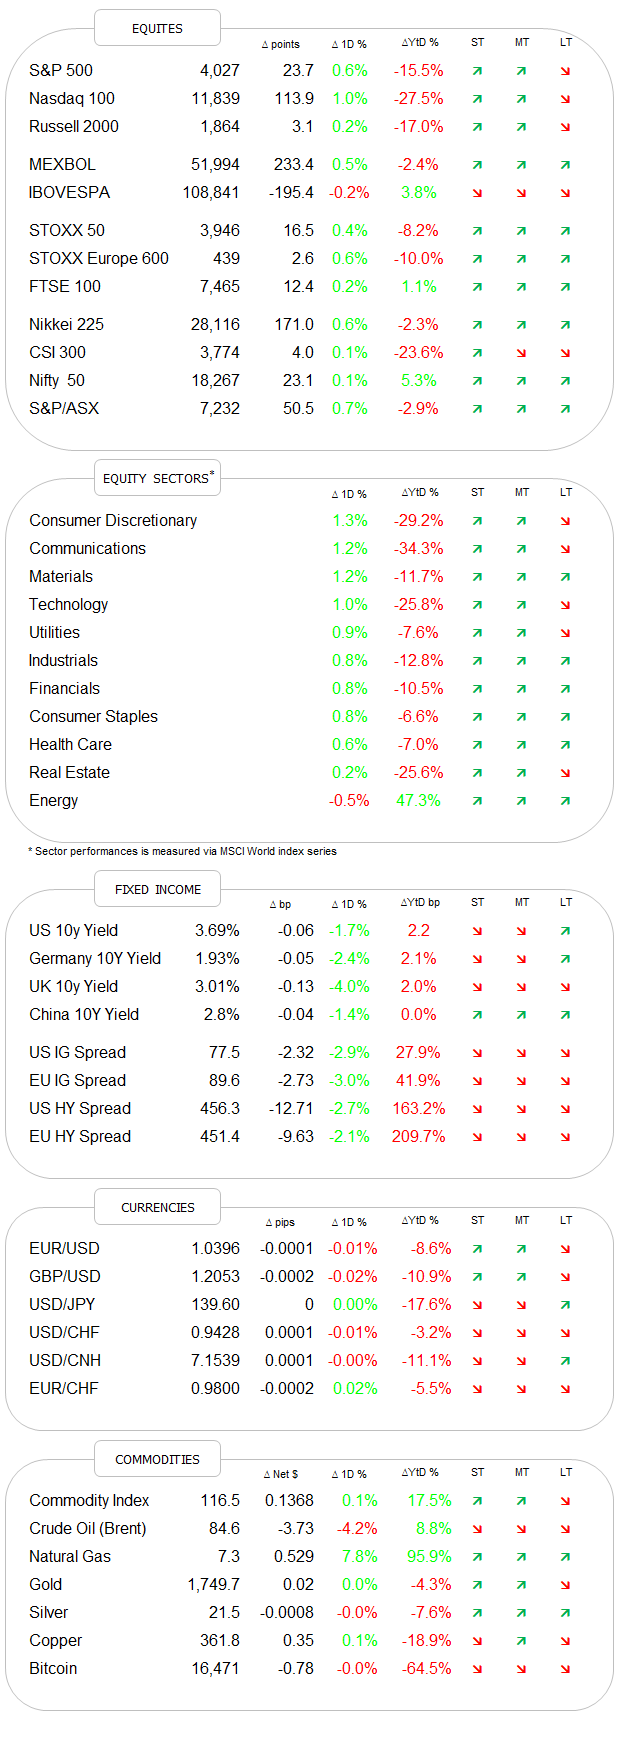
Ten out of eleven sectors where higher on the day,
leaving us with the following market heat map:
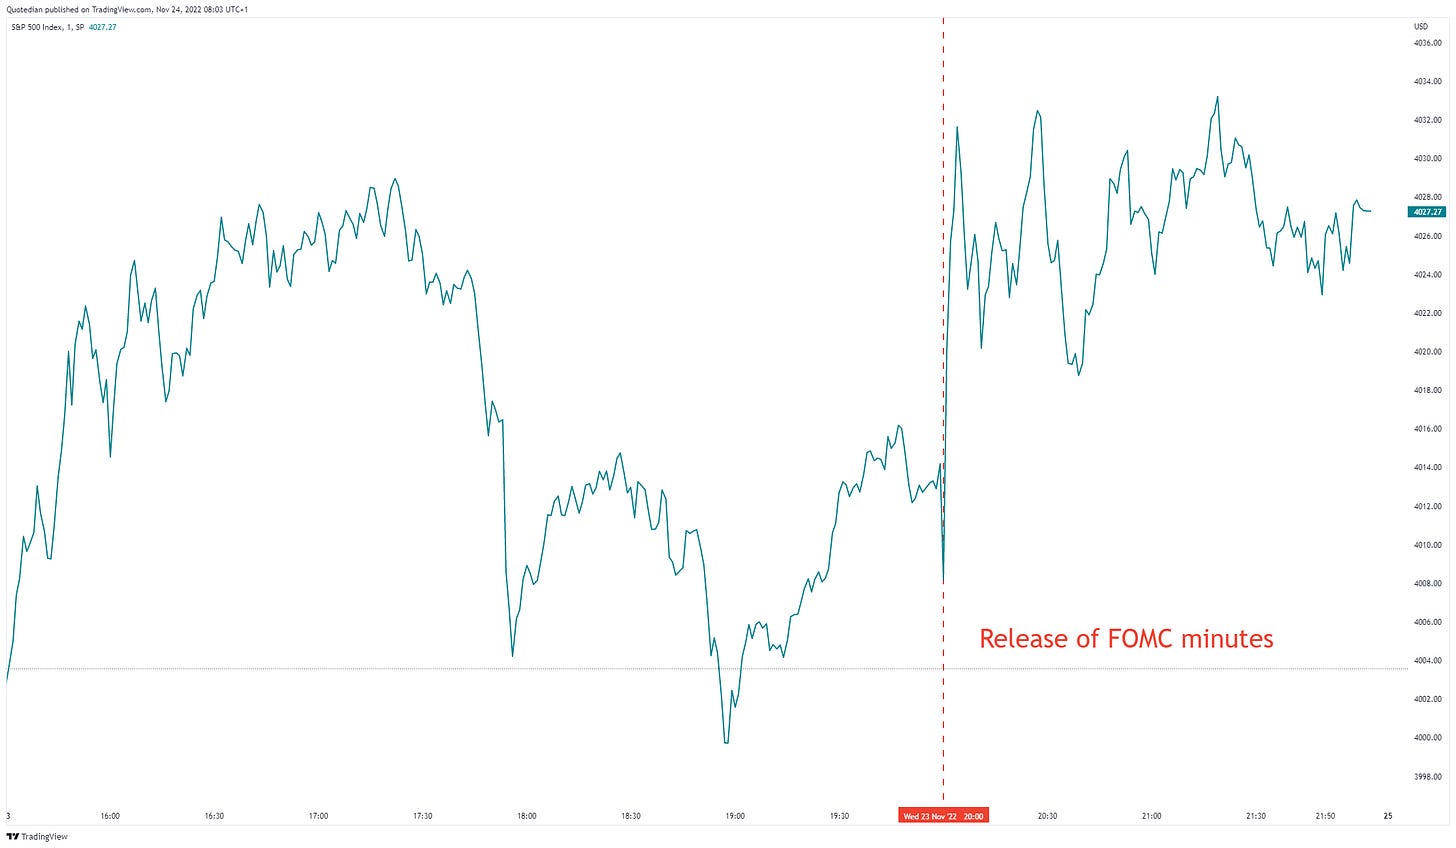
The intraday chart of the S&P 500 shows that the boost to the upside came upon the release of the FOMC minutes:
Those minutes confirmed what Fed members have been “selling” us since the last meeting:
The terminal rate will be higher than initially expected;
Rates will stay higher for longer due to their lagging impact on the economy; and
A slowdown in the pace of rate increases is likely ahead.
But maybe importantly, this section has not received enough attention (or maybe it has):
So, that’s Fed staff ‘admitting’ a 50% chance for a recession next year, and of course, pushed bond yields lower immediately (more on this below).
Asian markets are a sea of green this morning, with some of the strongest gains registered in Japan, which was playing catch-up after having been closed yesterday:
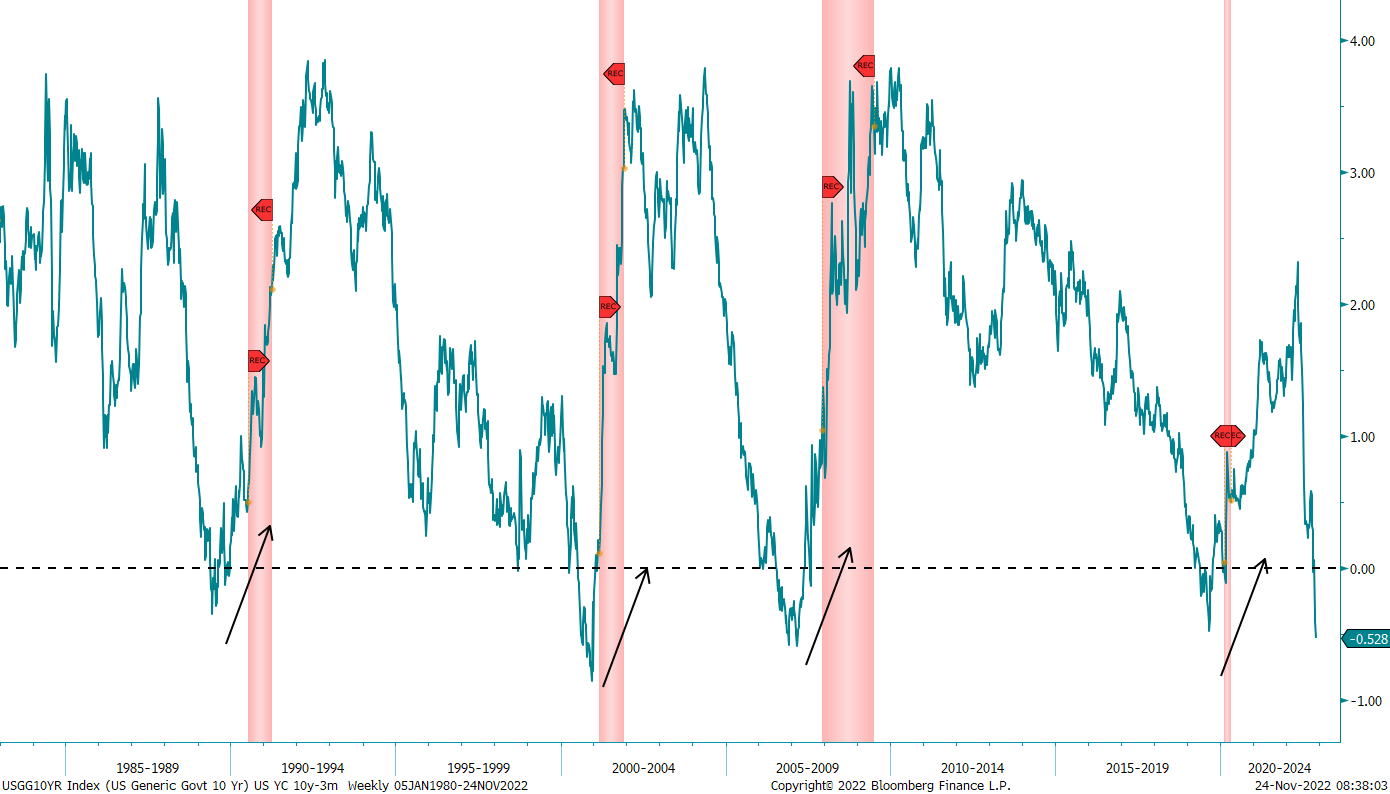
Moving on to fixed income markets, we already mentioned that yields dropped after the FOMC minutes confirmed (s)lower rates ahead:
It did not lead to an immediate steeping of the curve (but it will eventually), though that moment will be important to observe. As I have pointed out on several occasions in the past, in terms of recession definition it is NOT the inversion of the yield curve that matters, but when it starts STEEPENING again after inversion, as this chart clearly points out:
German yields, as proxy for the European Rim, just completed a technical shoulder-head-shoulder top, leaving a target zone count at around 1.40ish, though I would wait for a break of 1.77% for a more aggressive stance:
Finally, in the fixed income section, and serving as a segue into (crypto) currencies, the signs for the FTX demise were on the horizon as early as March, as high-yield bond prices in crypto exchange Coinbase started collapsing at a faster past than its peers:
The canary in the coal mine dropped dead, and most of us missed it (me included ☹).
In currencies then, the “Net’s” genius in coming up with brilliant spoofs never stop to surprise me:
In ‘regular’ currency markets, the US Dollar has started dipping again in earnest against most other currencies:
This has provoked, not dissimilar to what is seen on the equity side, a series of higher highs and higher lows, which we of course call an uptrend and which nullifies my idea of a pullback back to par (EUR/USD) before a move higher:
Finally, in the commodity complex, oil continues to be the talk of town, where prices are ‘attacking’ the $76 (WTI) pivot point for a second time this week:
Gold is setting up for a potentially interesting (and bullish) flag and pole pattern, which could take the yellow metal as high as $1,900. Aggressive traders go long after a close above $1,760; more prudent investors wait for $1,800 to be broken on a closing basis. And now please scroll down to bullet point #2 in the disclaimer below.
Ok, enough for today. As mentioned, the next Quotedian will likely be published on Sunday.
Have a great few days, behave and if you cannot behave, be safe!
André
CHART OF THE DAY
And now to today’s title to the Quotedian ‘Time for Turkey’, which of course has nothing to do with the bird they eat today across the pond, but rather with today’s COTD:
The Turkish stock market (BIST National 100) is up 163% year-to-date, which of course after currency losses (versus USD for example) is 87% ‘only’. Inflation is rampant, but for foreign investors, this is already expressed in currency losses.
Looking at the long-term chart of the MSCI Turkey ETF in USD (there is also a EUR version), we cannot help but note not only was the long-term downtrend (dotted line) recently broken, but also a multi-year base (dashed line).
As they say:
“The longer the base, the higher the space”
Stay turkey tuned!
Thanks for reading The Quotedian! Subscribe for free to receive new posts and support my work.
DISCLAIMER
Everything in this document is for educational purposes only (FEPO)
Nothing in this document should be considered investment advice
Past performance is hopefully no indication of future performance


