To Land or Not to Land ...
The Quotedian - Vol VI, Issue 13 | Powered by Neue Privat Bank AG
“If you can’t beat them, join them”
— Senator James E. Watson, 1932
DASHBOARD
CROSS-ASSET DELIBERATIONS
Already back in very early December I dedicated the intro of the Quotedian to the question of landing. At the time, “Soft” was the type of landing “en vogue”. In the meantime, the chatter turned to “No Landing”I am getting really sick and tired of all the type of economic landings, be it soft, hard or no. I mean, at the end of the day it is just a child of financial press chit-chat and economic pundits jargon (sorry jargon, for abusing you in this context. You are really a fine word.).
I mean, what’s next? Double landing? U-Landing? Green landing? King’s Landing?
So, in any case, as the chatter does not abade, I have decided to bring my two Cents/Rappen/Pesetas to the table. Here are some thoughts
Too many variables, dependent and independent, to accurately forecast what landing it will be
Even if could forecast, which one should we hope for?
Hard Landing → Hard Recovery?
Soft Landing → Soft Recovery?
No Landing → … ??
And finally, also assuming that we can perfectly forecast the type of landing and associated forms and shapes of recessions, what’s the applicable investment implication?
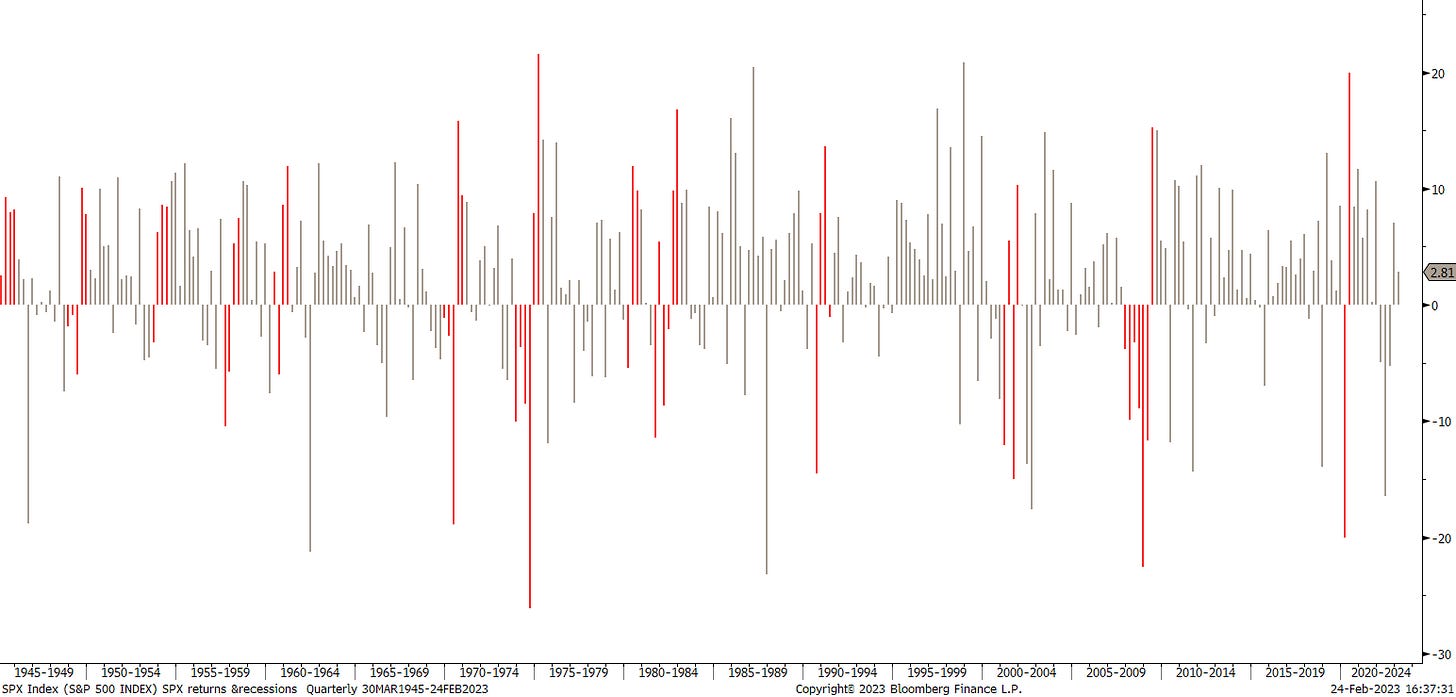
Consider this chart of quarterly S&P 500 returns, with the red bars representing recession periods:
So, with the exception of the 2008-2009 GFC recession, which arguably was not a landing but an outright high mortality crash, even perfect foresight did not really give you an investment edge.
But anyway, ‘nuff said. Let’s commence with our usual weekly review!
The good old Quotedian, now powered by Neue Privat Bank AG
NPB Neue Privat Bank AG is a reliable partner for all aspects of asset management and investment advice, be it in our dealings with discerning private clients, independent asset managers or institutional investors.
Starting with global equities, the weekly performance table quickly reveals that it was a difficult week for stocks:
Of course, was the theme of the week the equity market’s realization that the Fed is far from pivoting (higher for longer), a sentiment reinforced by additional hotter-than-expected inflation numbers. Friday saw the Fed’s (at least previously) favourite inflation measure, the PCE Deflator, coming in ahead of expectations.
As the PCE Deflator was released one hour before US trading started, stocks opened weak, but then were able to recover after marking a low about two hours into the session:
This is important on the daily candle chart, as the S&P 500 recovered precisely at its own 200-day moving average (black line):
Nevertheless, the chart does not look overly encouraging for bulls, with the target at 3,770 we set a few weeks becoming more likely to be visited over the coming weeks.
Turning our attention to equity sector performance and given that inflationary pressures dominated the investment narrative throughout the week, it should follow that longer-duration sectors such as tech and consumer discretionary are amongst the worst performers:
Indeed.
Unsurprisingly, the 5-day heat map of the S&P 500 gives a similar picture:
Talking individual stocks for a moment, here are our usual performance statistics for the year’s best performers and their development over the past five days. Here’s the US list:
And here its European counterpart:
In both leaderboards, there was quite a lot mean reversion…
One tech stock that bucked the trend this week was NVIDIA, up 5% on the week after a strong earnings report:
If you think AI is the future, think (and buy) NVDA. Here’s the long-term chart of the same stock:
In terms of investors’ sentiment, the VIX indicates that investors are not in Fear-mode yet, but made an important step in that direction:
Let’s this as a segue into the bond section, where the VIX’s equivalent for the fixed-income market is on the MOVE higher since the beginning of the month, signalling a very clear warning sign for the overall market, as it is closing on the previous highs:
We already mentioned that yields have been moving higher over the past few weeks, which of course means that bonds are producing negative price returns:
Taking the popular iShares 20+ Year Treasury Bond ETF (TLT) as proxy for the overall bond market, we take note that bonds are about on the verge of giving back all year-to-date gains:
And if the following chart of the 10-year US treasury yield were a stock, I’d be super-bullish on it …
As mentioned previously, and please do not shoot the messenger, from a technical viewpoint 5% is the ‘price’ target for the Tens:
But of course is the real action at the shorter end of the curve, with the 2-year yield for example hitting a 16-year high,
leaving the yield curve (10y-2y) in historical negative territory:
Over in Europe (using German rates as proxy), things do not look much friendlier:
Credit spreads on both side of the Atlantic are rising again, though are far from expressing any distress:
Moving into the currency section, we note that the US Dollar had a very strong week versus nearly all other major currencies:
In other words, the Dollar wrecking ball has started swinging again. Here’s the US Dollar Index (DXY):
On the chart above, resistance has already been taken out (mainly due to USD/JPY) strength, but on the EUR/USD chart support is holding (for now and just about):
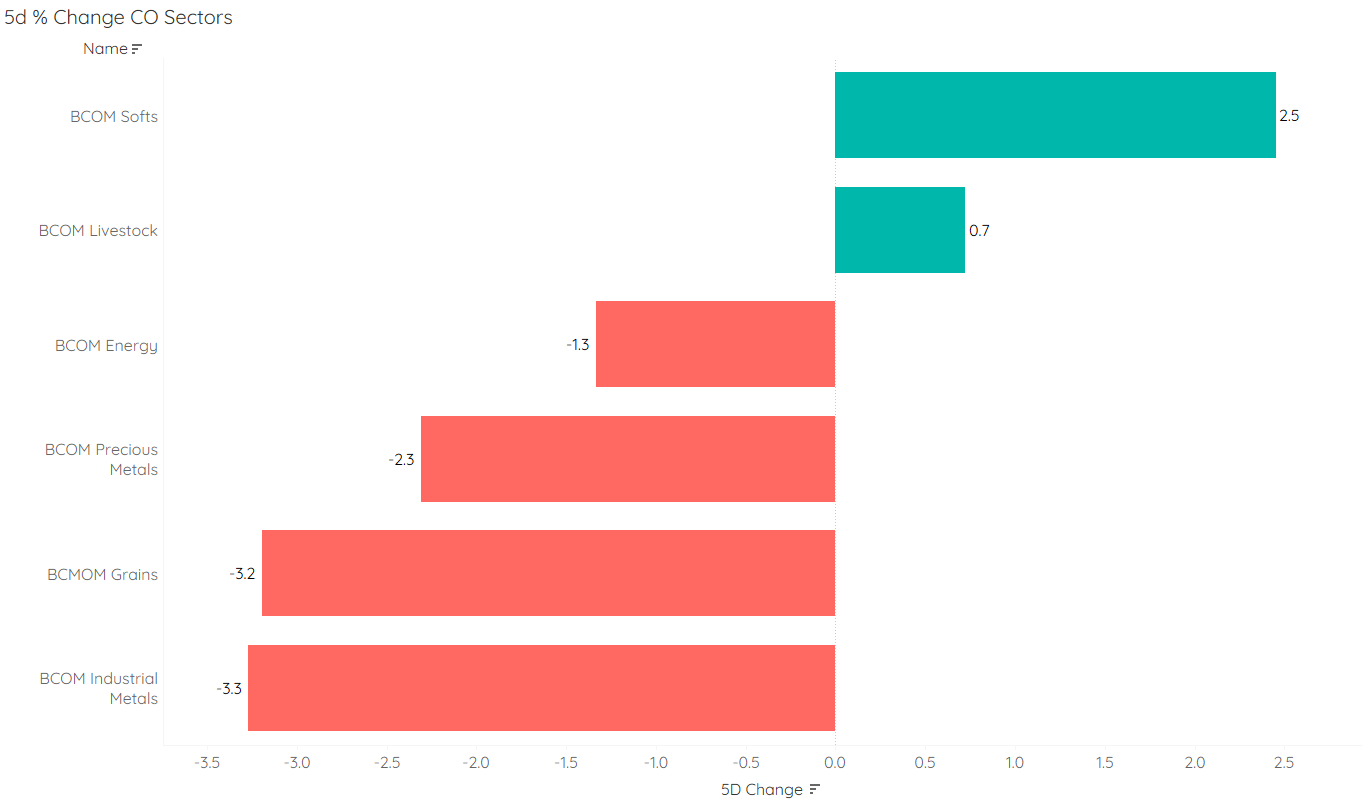
And finally, in the commodity complex, given the USD strength described above, it will come at no surprise that commodities struggled last week. Here are the main commodity ‘sectors’
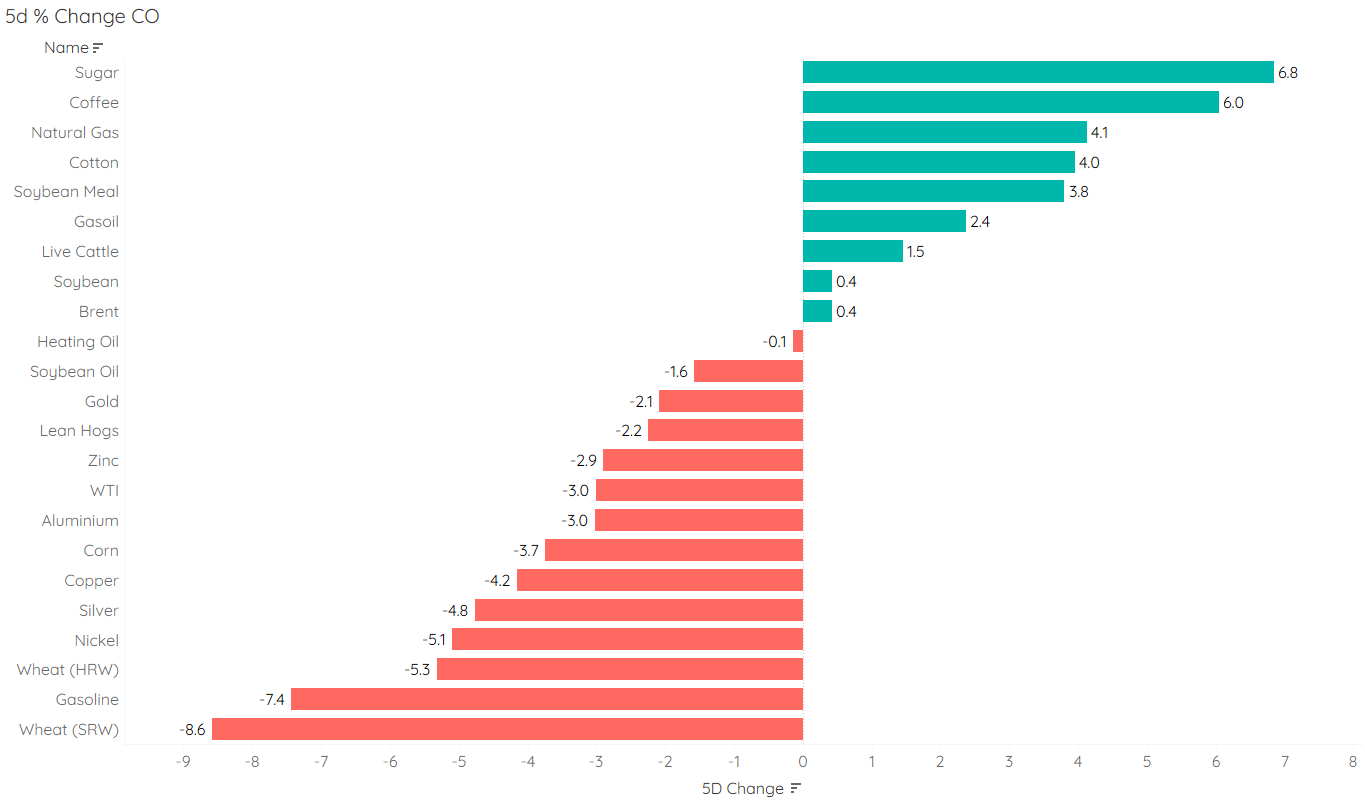
And here are some of the main commodity futures:
Gold continues its corrective move, but for now held above the $1,800 level:
However, it is to note, that versus other currencies, Gold is holding up pretty well. Here’s XAU/EUR for example:
or XAU/JPY:
Or even Gold measured in Silver (XAU/XAG):
As they quote goes:
Everything is relative; and only that is absolute.
— Auguste Comte
I had, as usual, much more to share, but also as usual, have run out of time again. But don’t despair, some good news is coming to you from The Quotedian next week. So, stay tuned…
Happy weekend and happy landing!
André
CHART OF THE DAY
And now to a variation of today’s Quote-of-the-Day:
“If you can’t beat them, hit ‘em harder”
The Quotedian
How many scientific evidence are they still going to throw at us to make their point that passive beats active? I totally get it - given the implied laziness and expected outcome of passive, it should be the choice of many. However, this does not take away the ACTIVE decision on which PASSIVE instrument.
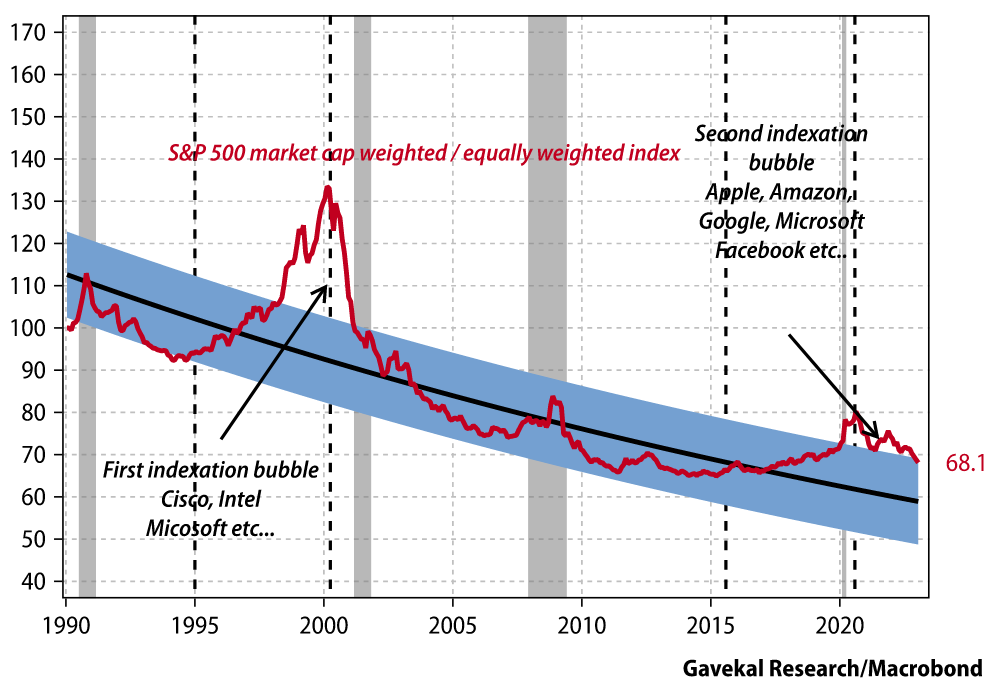
Point in case, this fantastic chart from legend Charles Gave at Gavekal, which neatly points out that an S&P 500 equal-weight index (SPW) beats the S&P 500 (standard) market-cap weighted index (SPX) over the long run:
As a matter of fact, except for two bubble periods, the outperformance of SPW over SPX was constant and smooth.
In conclusion, before you run and go and buy your SPY ETF, consider that in a longer-term context you are buying big companies that have done well and are now expensive.
Here’s the alternative view on the above:
Thanks for reading The Quotedian! Subscribe for free to receive new posts the moment they are published.
And as you’re at it, mail me here if you would like to find out more regarding private banking and wealth management at Neue Private Bank AG:
DISCLAIMER
Everything in this document is for educational purposes only (FEPO)
Nothing in this document should be considered investment advice
The views expressed in this document may differ from the views published by Neue Private Bank AG
Past performance is hopefully no indication of future performance


