


“The suspense is terrible. I hope it will last.”
— Oscar Wilde

For good or for worse, and even more outside-the-box than this unusual newsletter already is, this week will take a completely different approach.
Usually I talk you through the different asset classes, completing my rambling with a lot of charts.
This week, we will go through a wide variation of charts, sometimes connected, sometimes not, but never sorted …
We will mark each chart, with either Trick

or Treat,

or undecided:

So, let’s go ringing at the first door bell…

Let’s start with the chart giving the subtitle to this week’s letter.
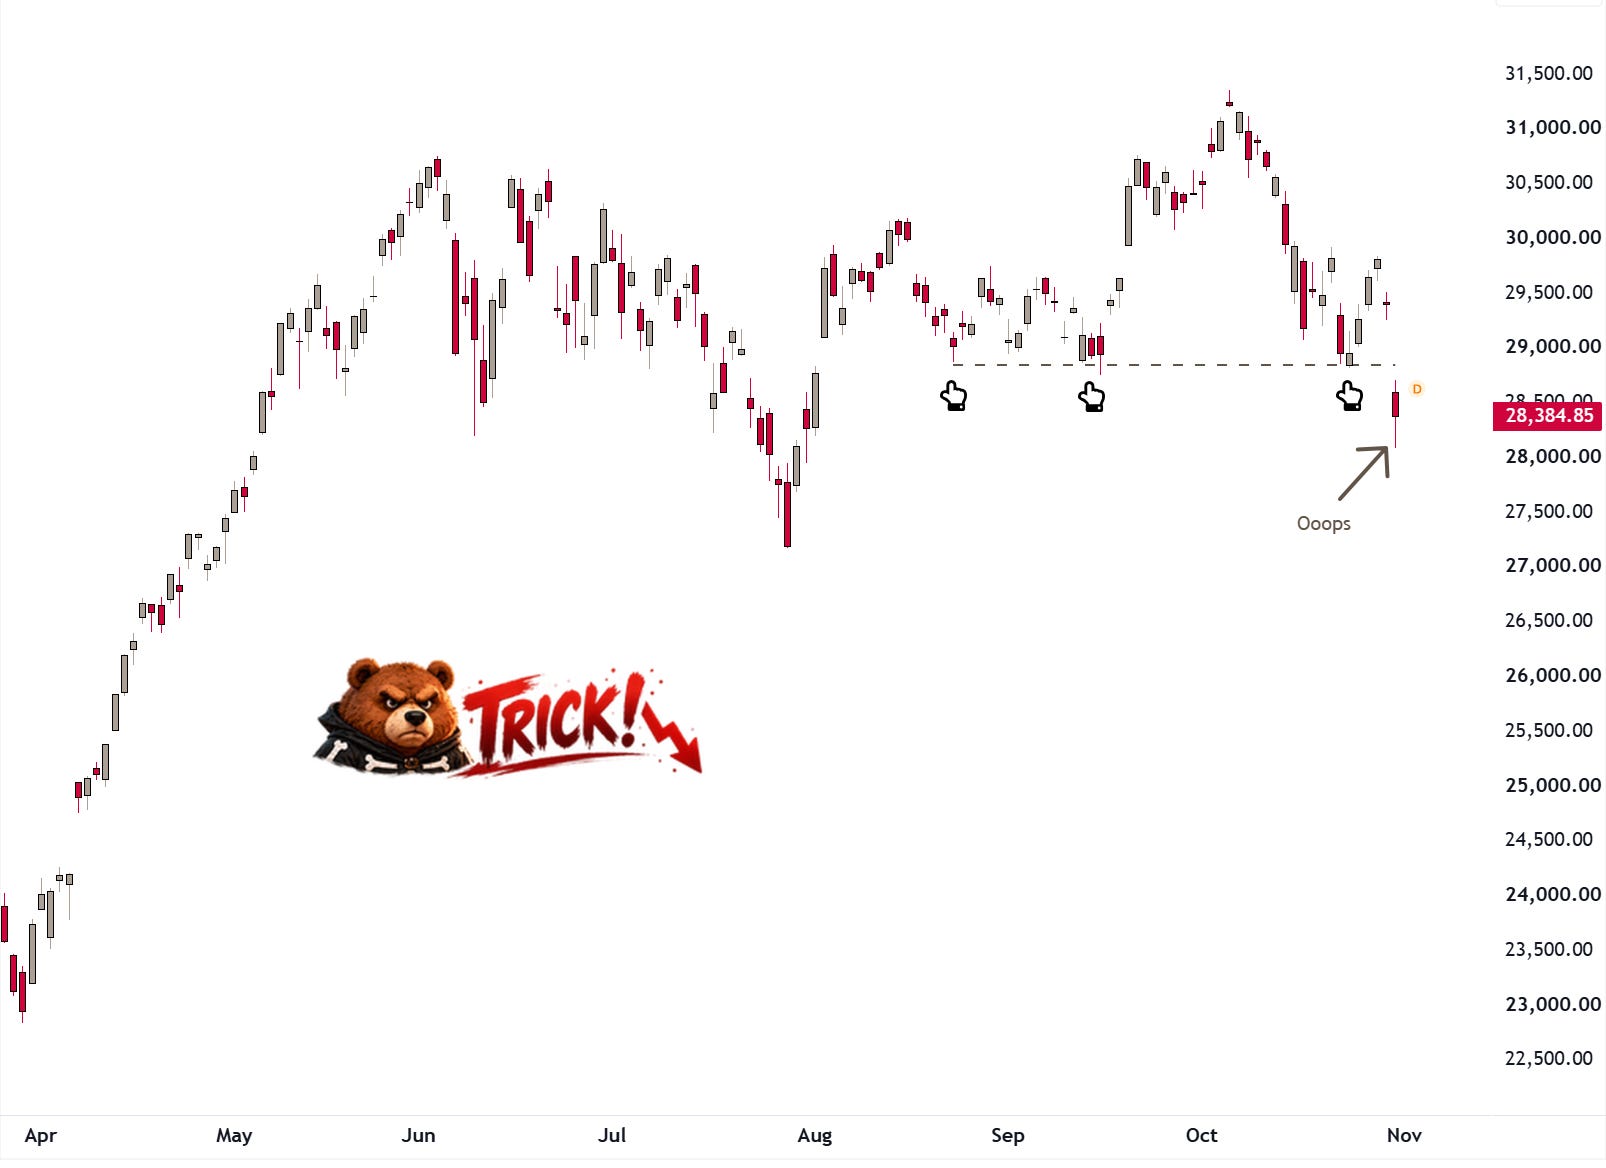
We have seen quite some disappointing numbers from some of the most iconic names in the tech spaces (GOOGL, AMZN, NOW, INTC, others).
The market, especially the Nasdaq 100 then has reflected all of this by Friday’s ugly downside gap:
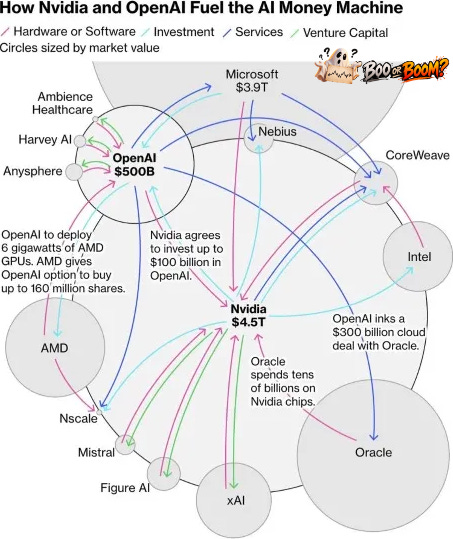
Now, imagine for just a moment, that Nvidia, the company at the centre of the circular AI-economy,
and the darling of all analysts,
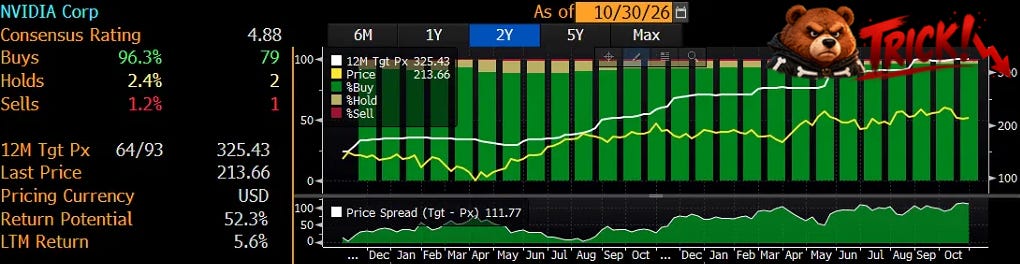
disappoints with its earnings announcement on Tuesday, 17th November:
“It’s The End of The World as we know it!”
So, just a bit over two weeks to go till doomsday!
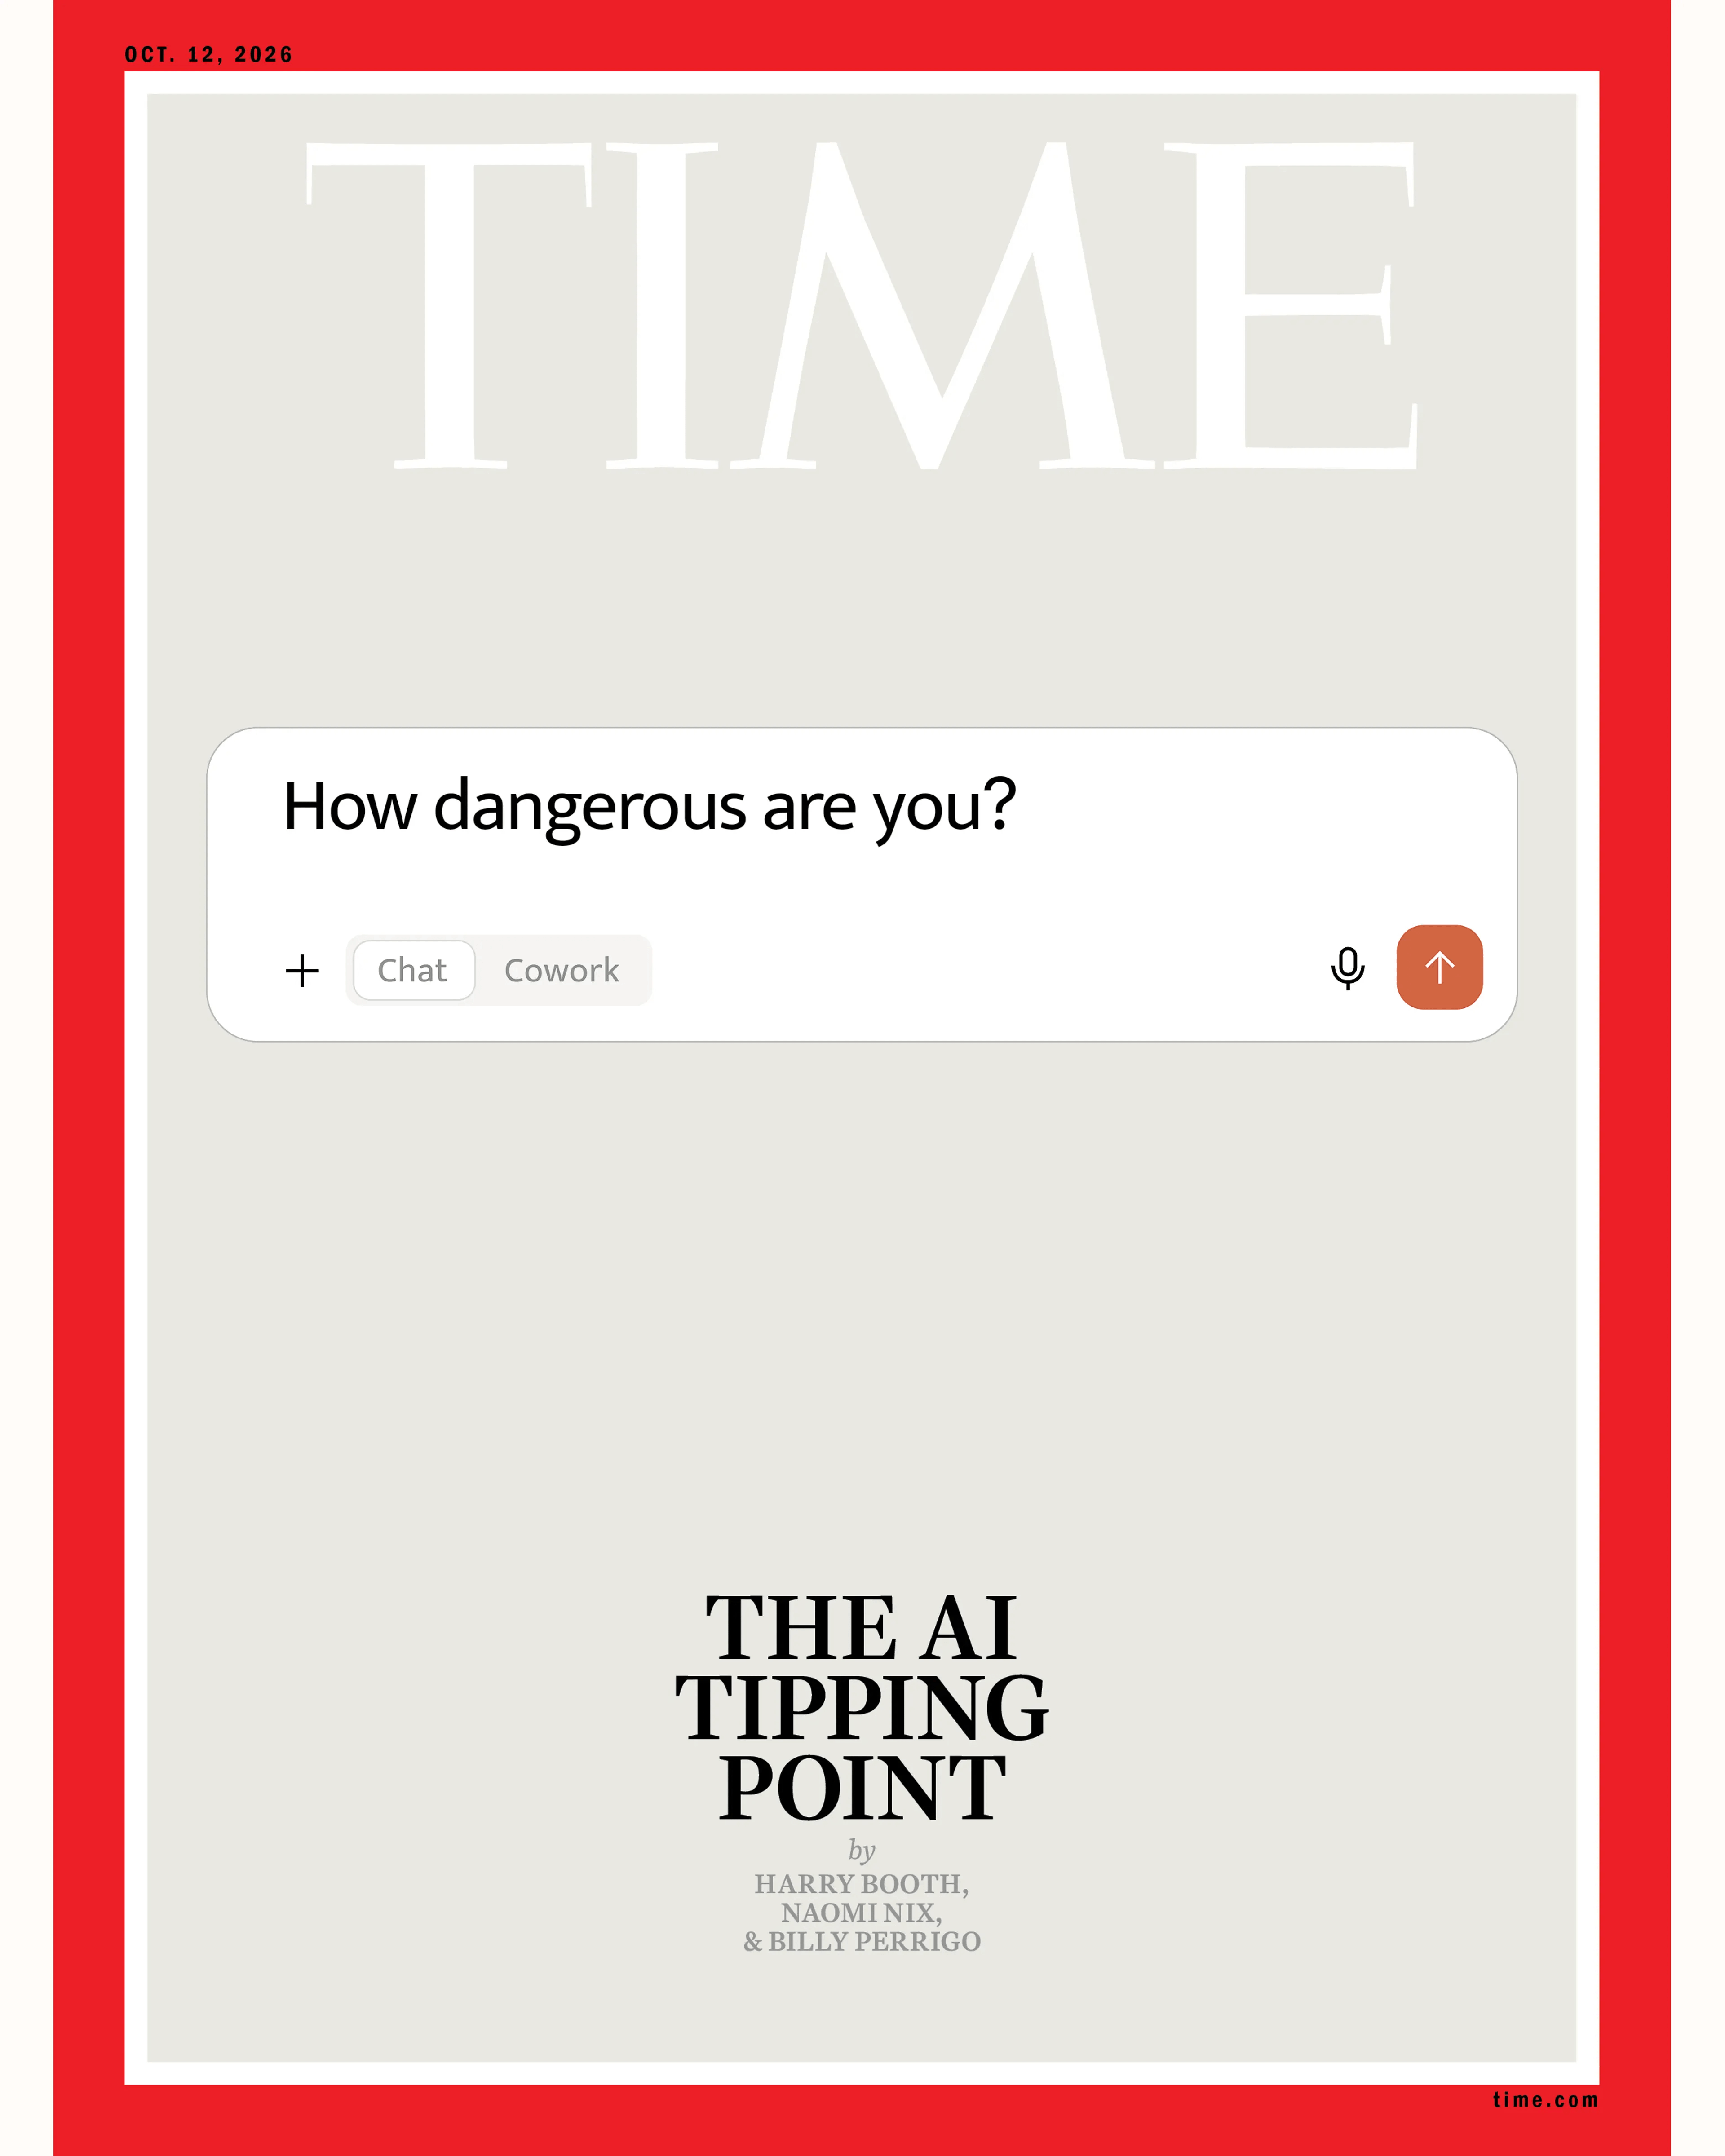
And if NVDA does not disappoint, the end may be coming rapidly anyway, according to the frontier LLM companies, such as OpenAI or Anthropic:


I think, it’s time for a TREAT chart!
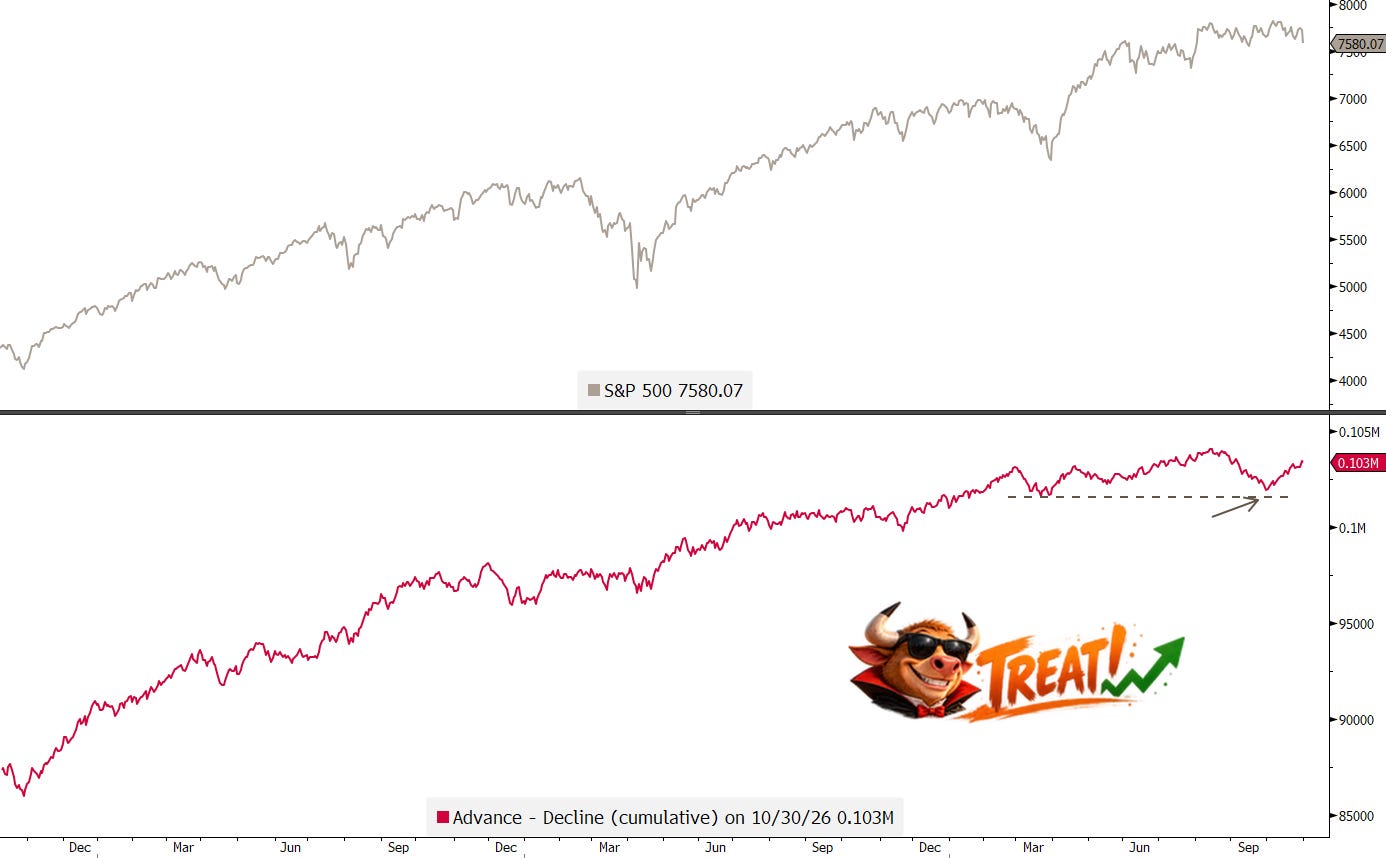
Thursday’s -0.30% retreat on the S&P 500 was astonishingly accompanied by 409 stocks up and only 97 down on the day!
And even during Friday’s 1.82% decline, decliners (277) were only marginally higher than advancers (226).
In general, breadth has been expanding, which should be interpreted as a positive:
Which in turn means our S&P 500 equal-weight (RSP) over cap-weight (SPY) trade should be paying off handsomely:
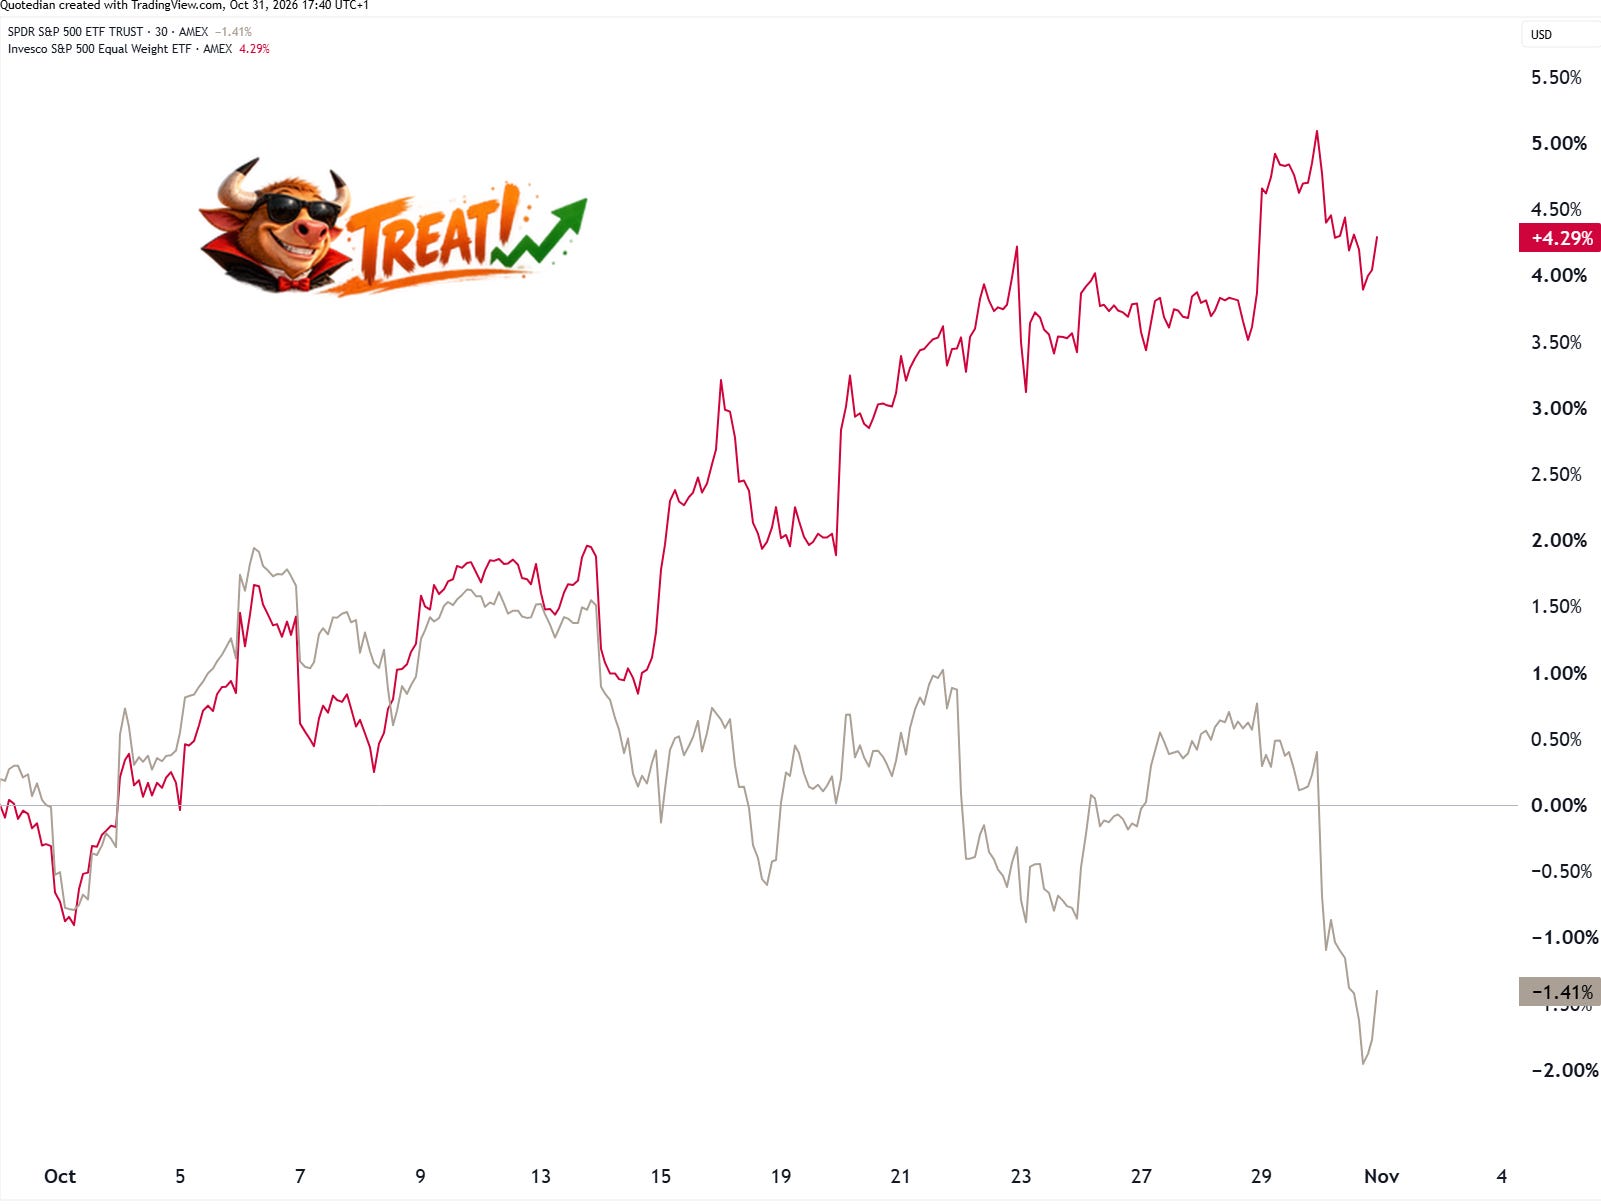
Indeed!
Also, whilst the number of stocks down 20% or more from their all-time highs is close to 60%, the number of stock hitting new 52-week lows has halted abruptly:
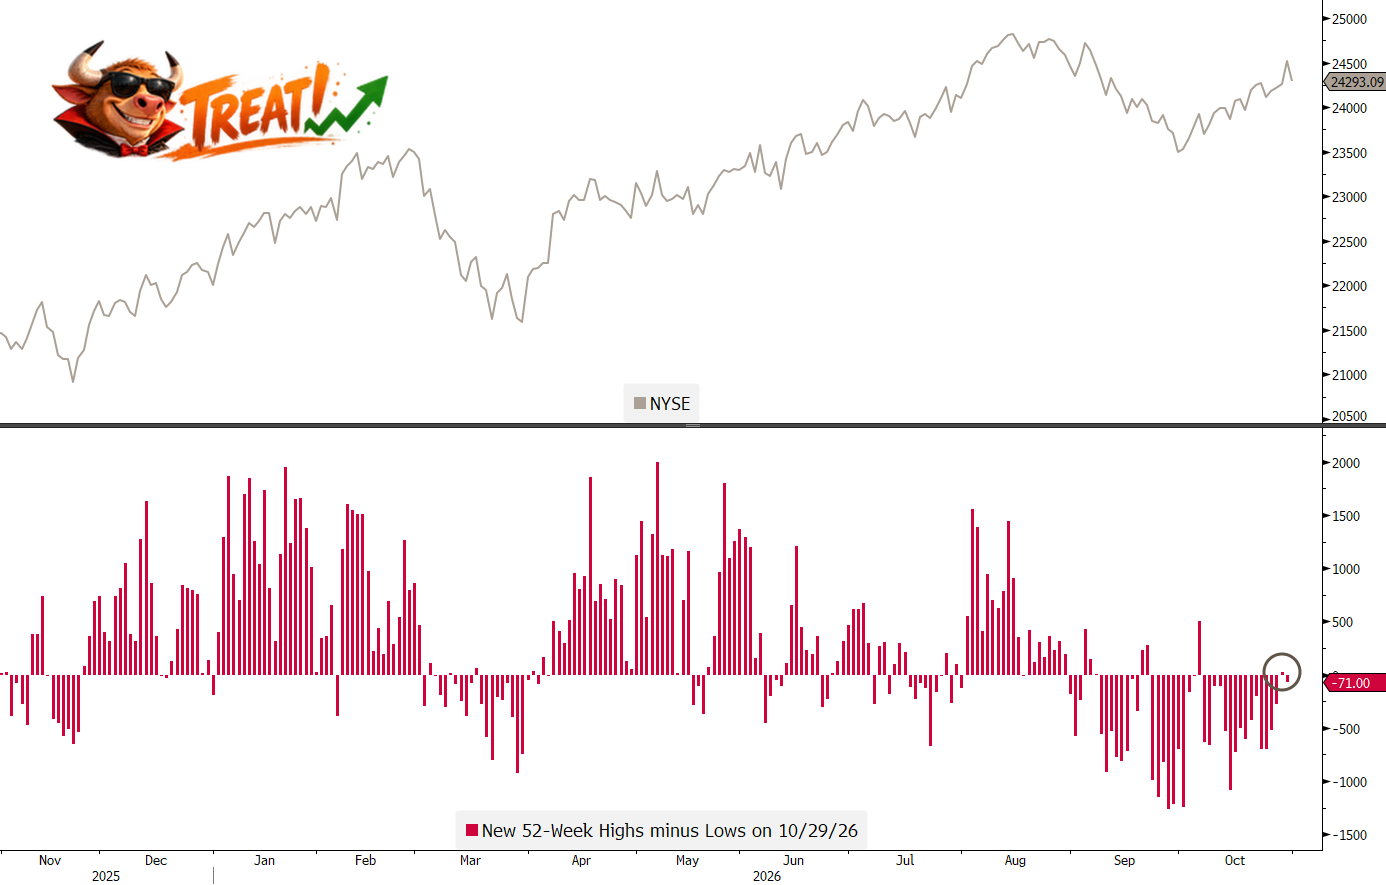
And all this, as we are
a) moving right into the best month for stocks over the past 75 years,
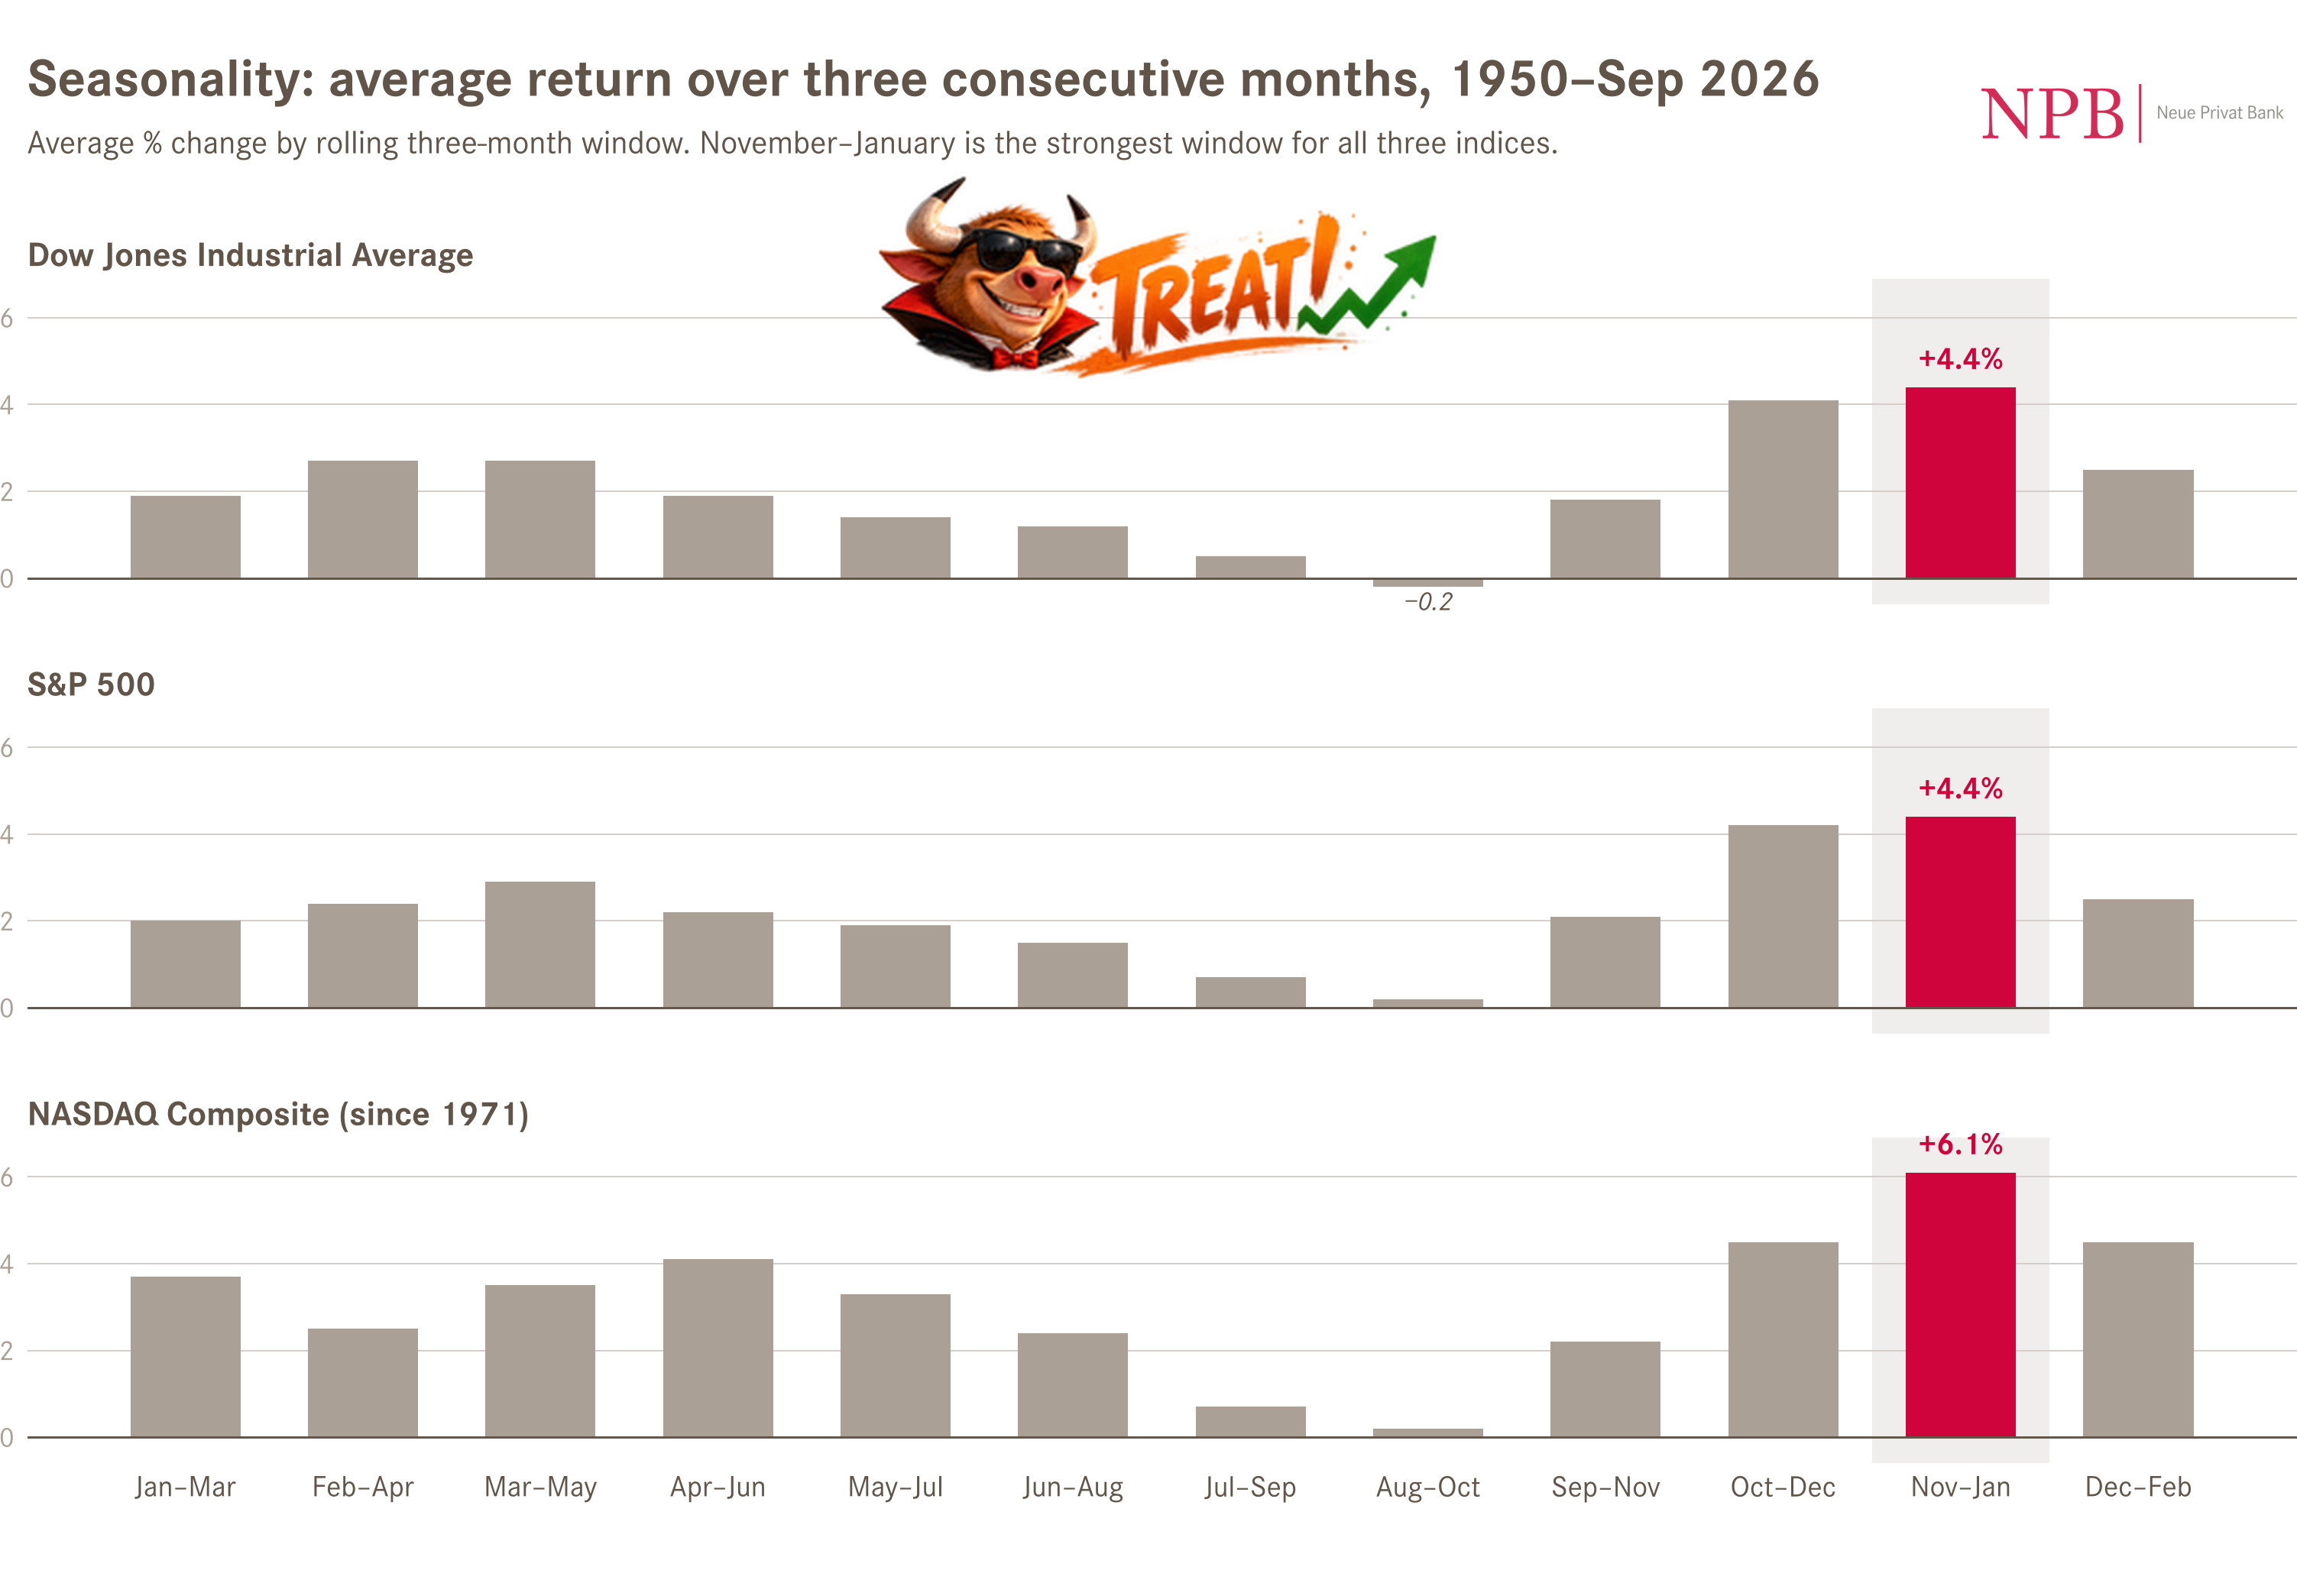
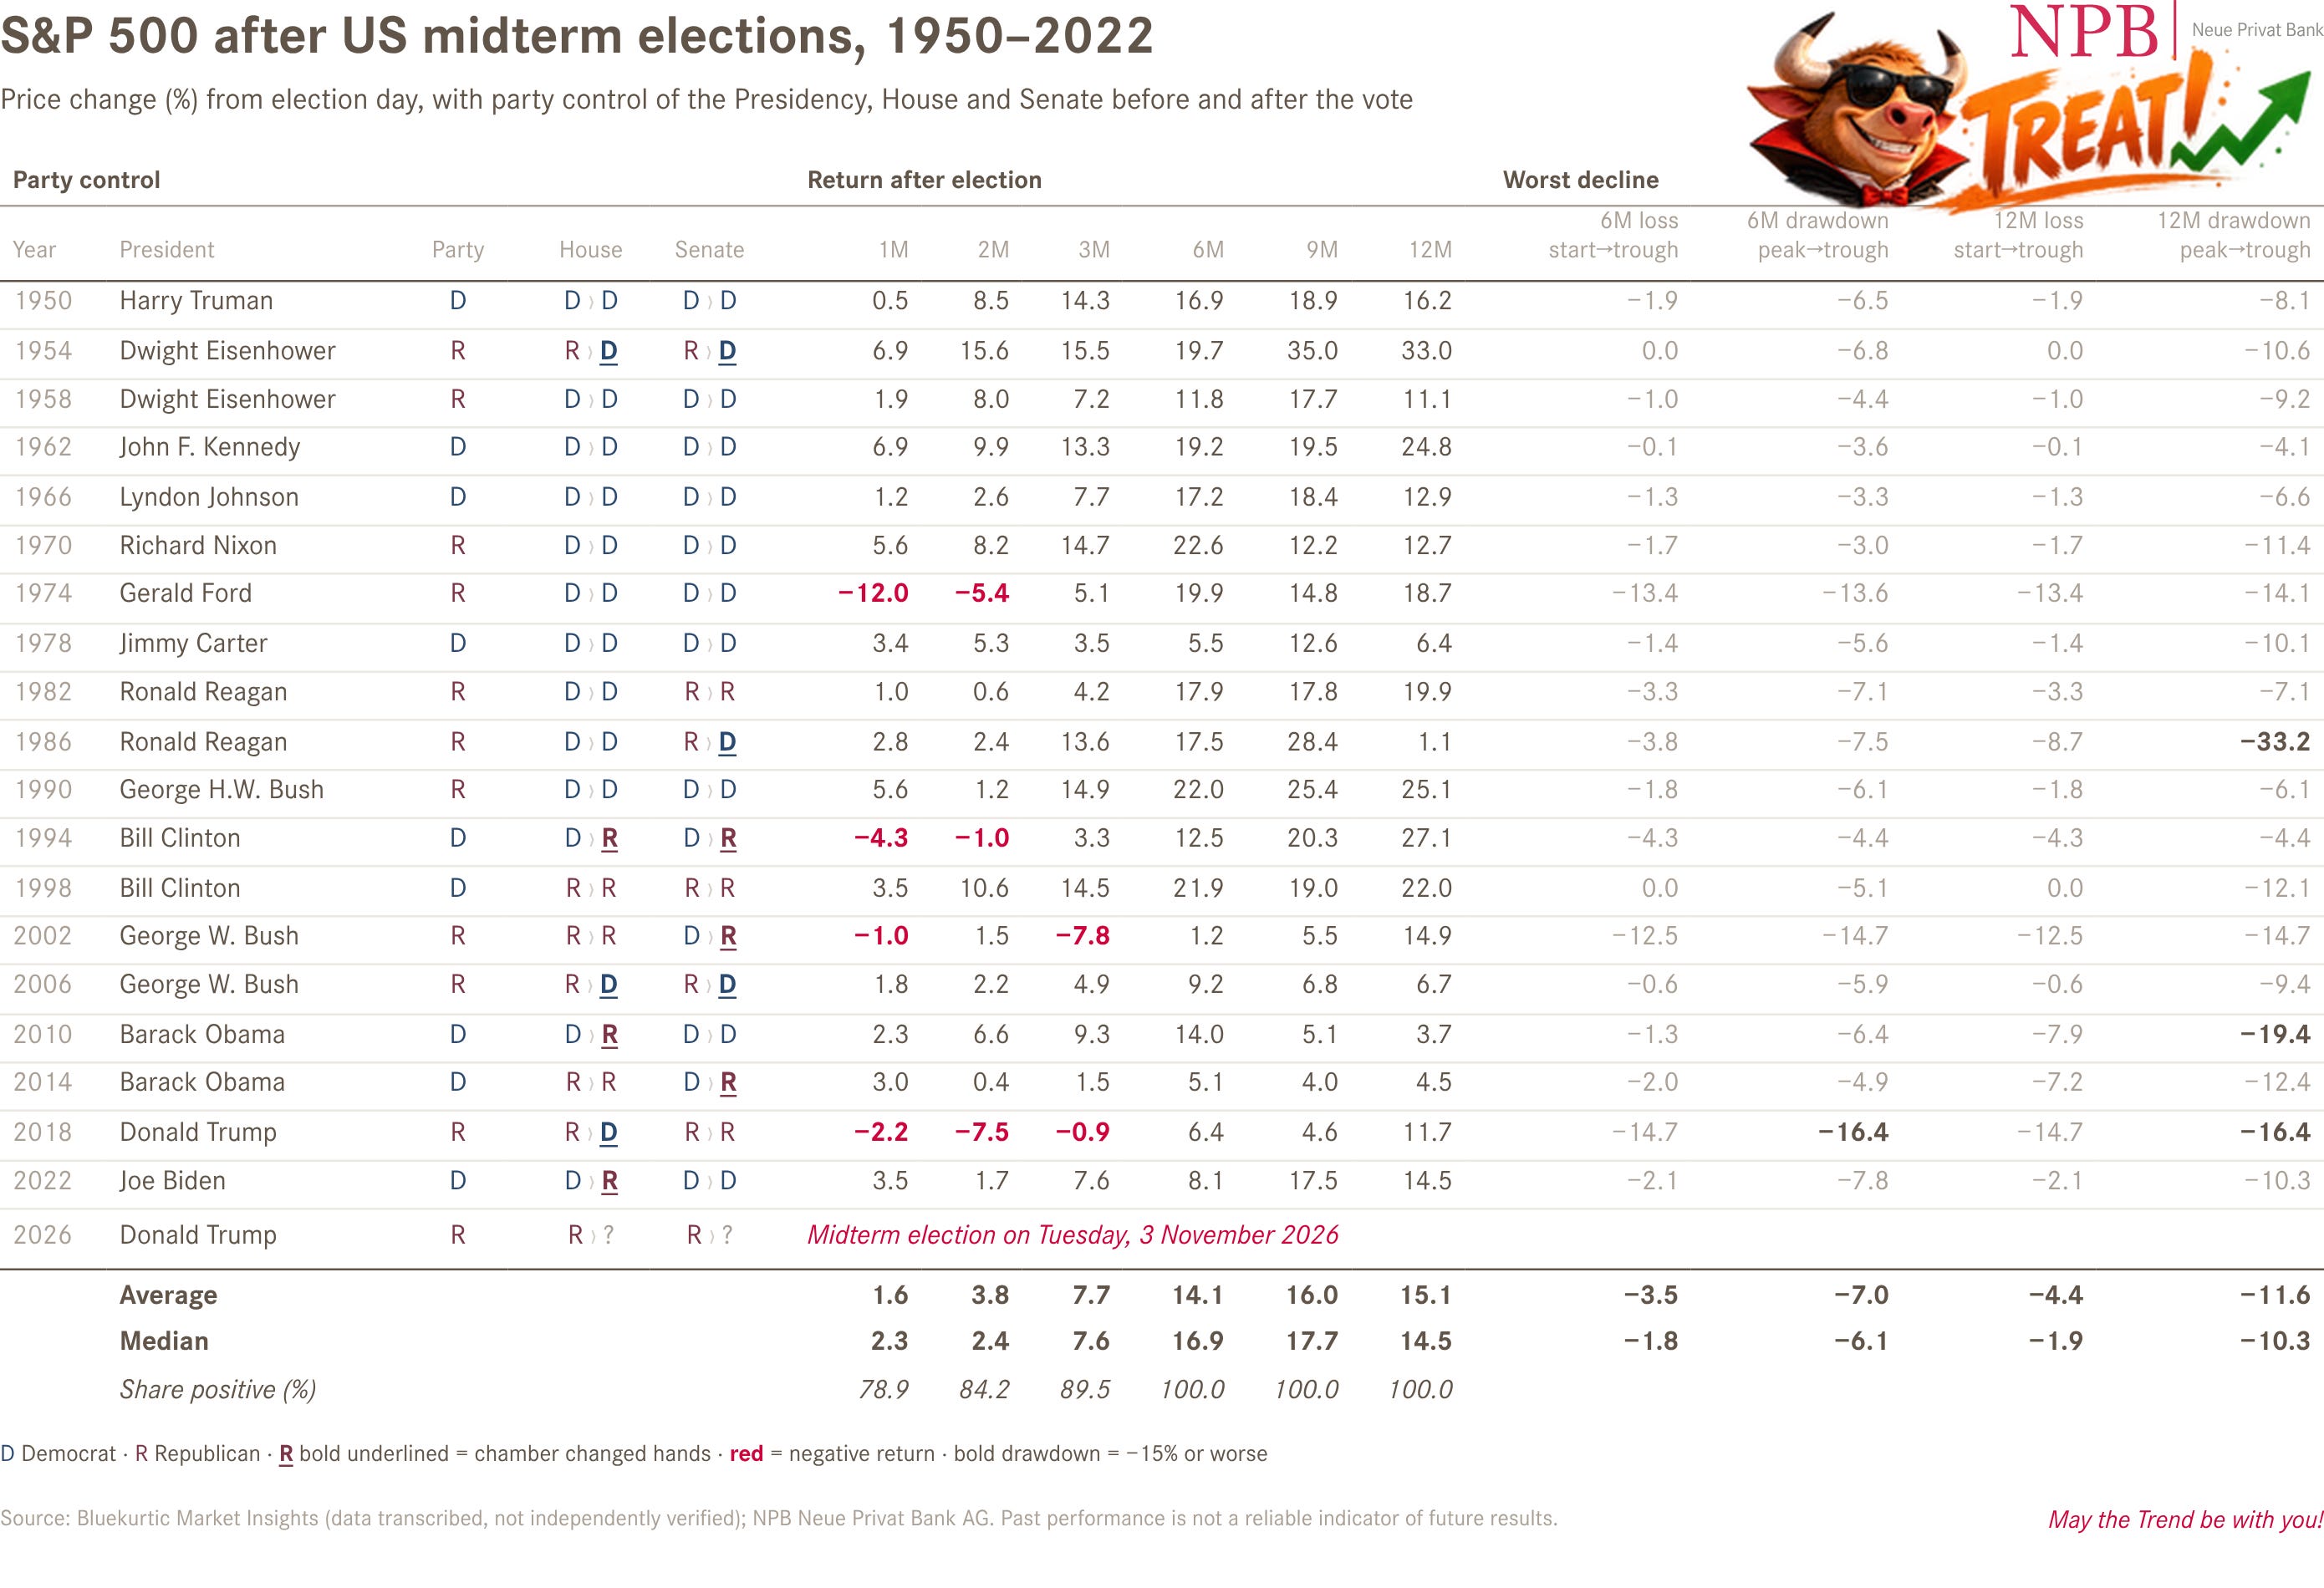
and b) getting a possible tailwind post the US midterm election according to this statistic:
But back to the AI trade for a moment.
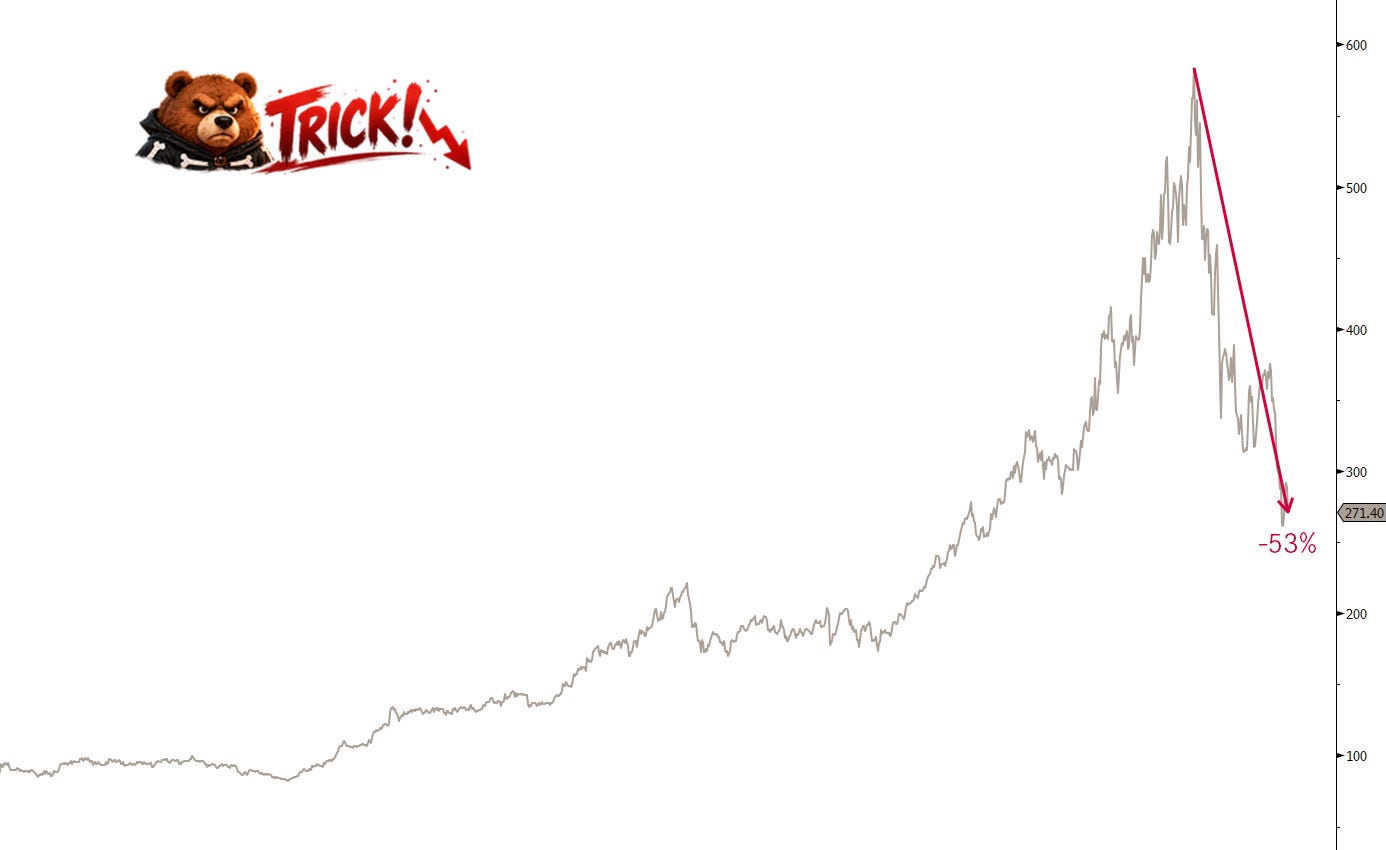
According to the Goldman Sachs US AI Beneficiaries vs At Risk Index (GSPUARTI), which is a pair trade of long AI beneficiaries versus short AI losers, the AI trade ended already back in June!
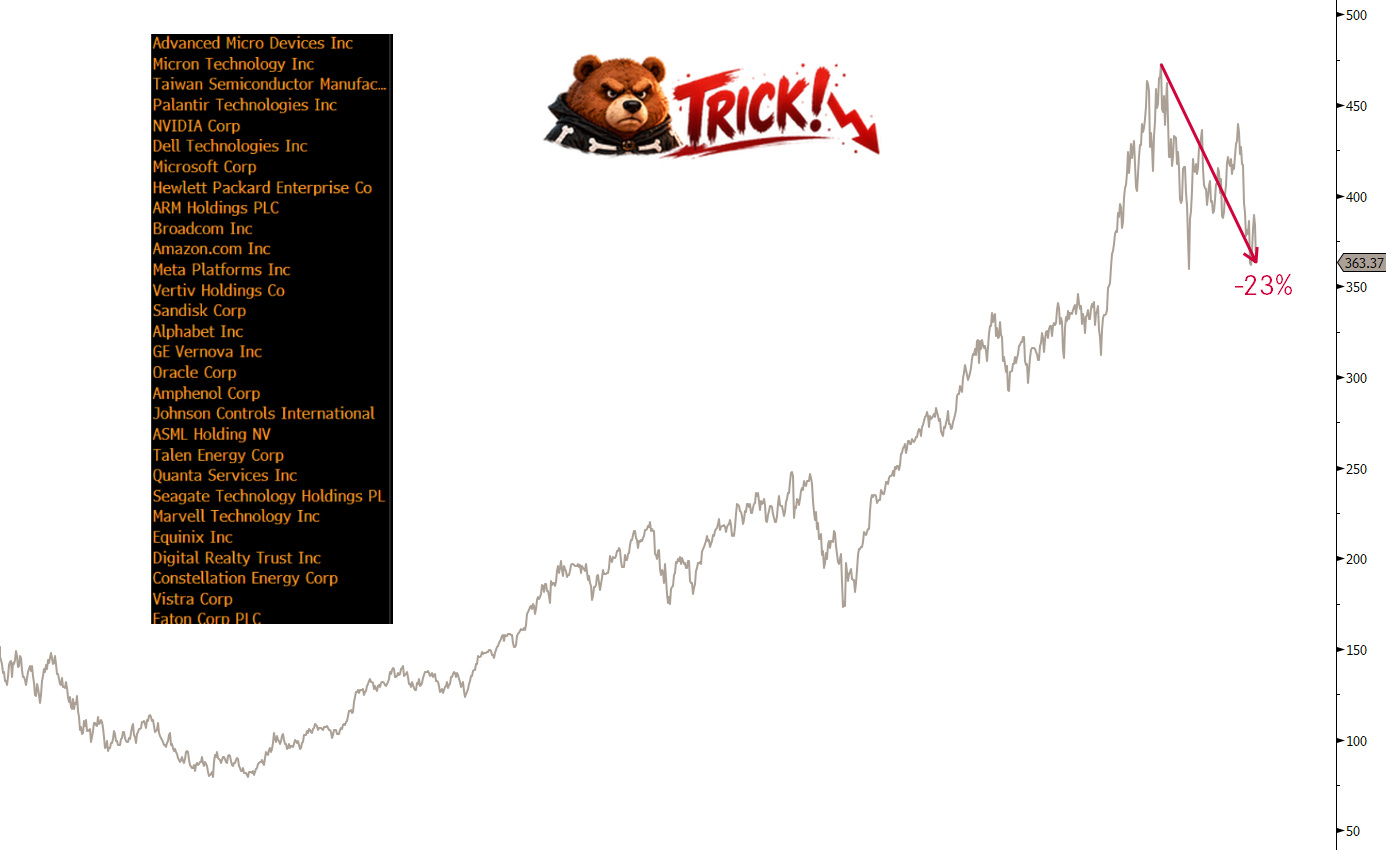
Even when looking at the long leg only of the above pair trade, we realize that with Friday’s 5%-plus drop AI beneficiaries are now officially in a bear trend:
The Mag 7 themselves seem to be losing the shootout:
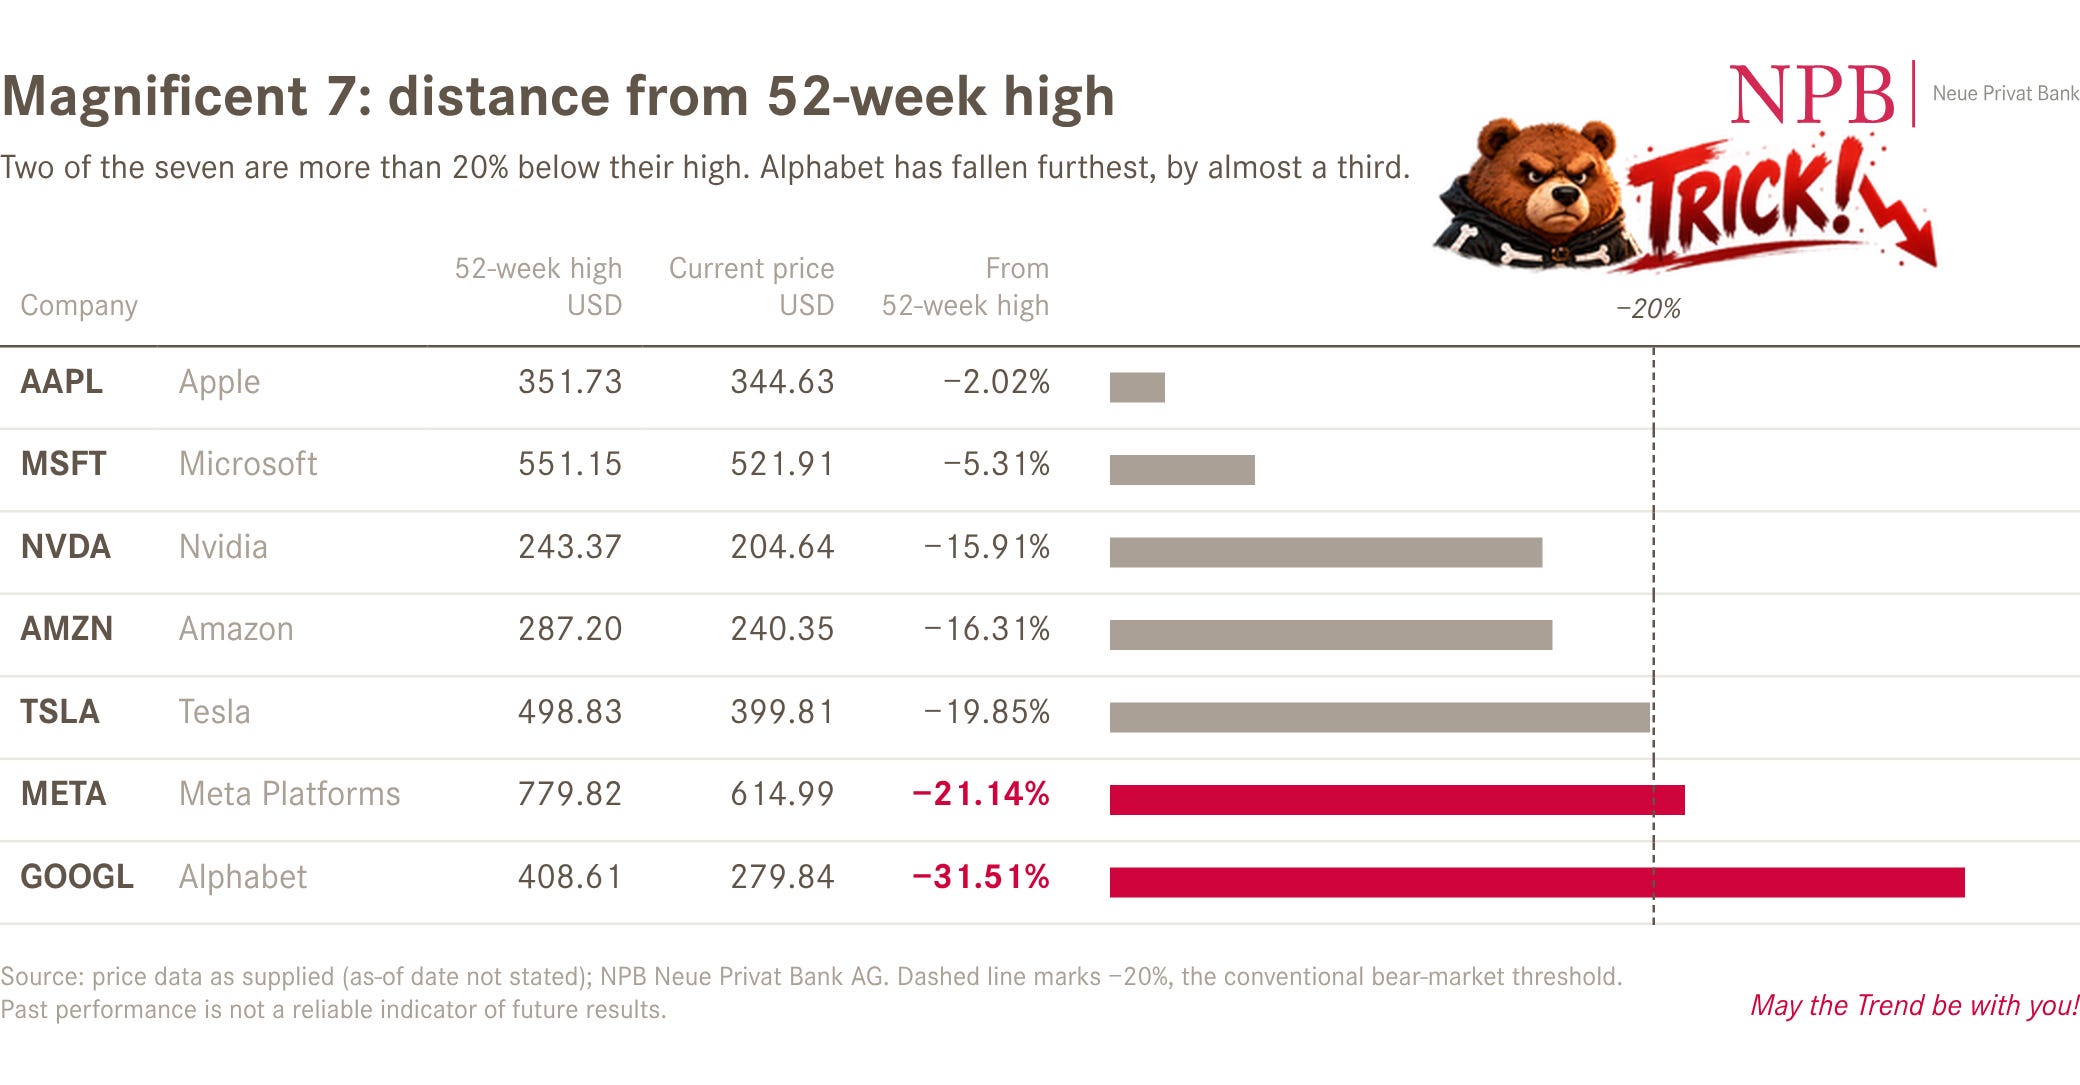
Or, as a picture is worth more than a thousand words:

I was going to give you a TREAT again now, pointing out that as long as sector rotation is happening, as opposed to outright net selling, the bull market is alive.
HOWEVER,
the sector rotation over the past month is happening into all the traditional defensive sectors, i.e. the market is indeed moving into risk-off mode:
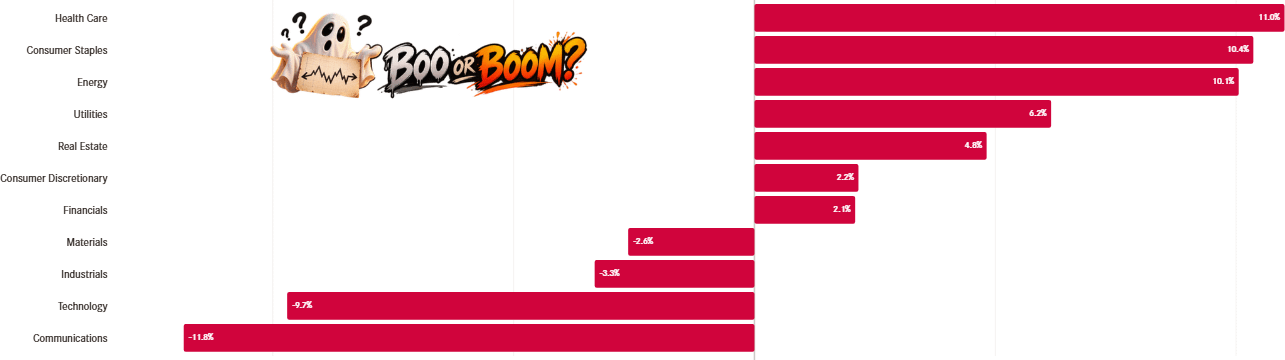
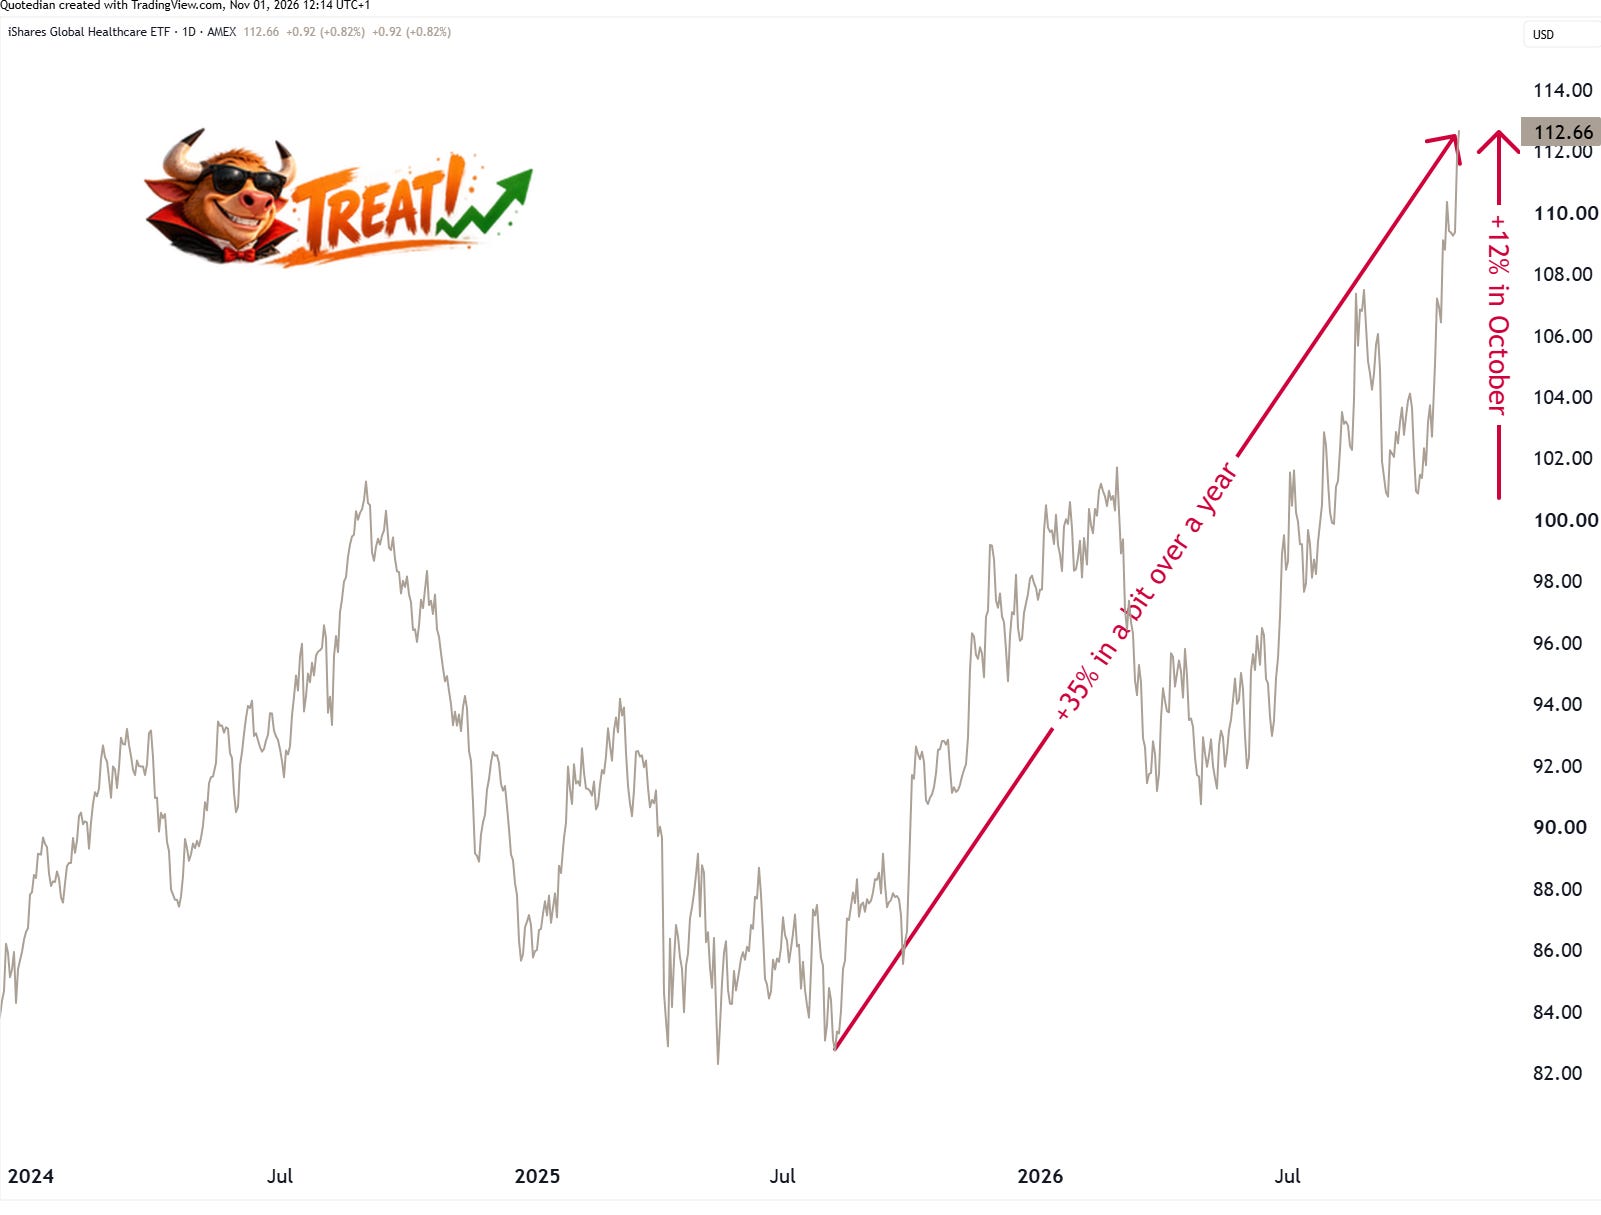
But, to remain positive, and provide you with a probably much-needed TREAT again, these sectors are not only outperforming in relative, but also in absolute terms.
In other words, traditional, long-only investors can actually make money by buying Global health care (IXJ) stocks, for example:
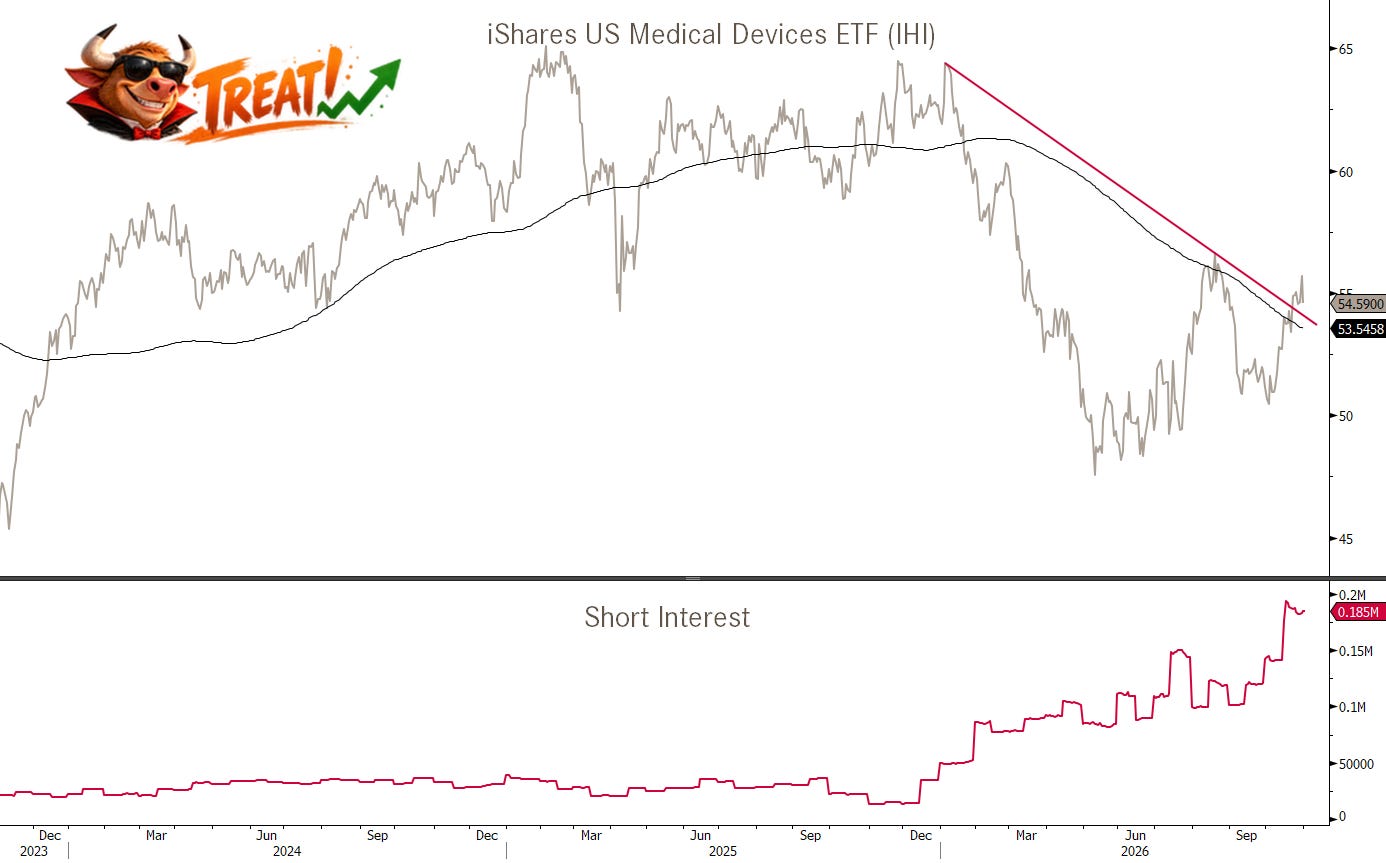
One possible interesting trade could be buying a subsegment of health care. The iShares US Medical Devices ETF (IHI) is showing a short interest not seen since 2008, just at a time when it is breaking above trendline and 200-day moving average. Short covering could squeeze this ETF higher rapidly:
Ok, time to look at some other asset classes/indicators…
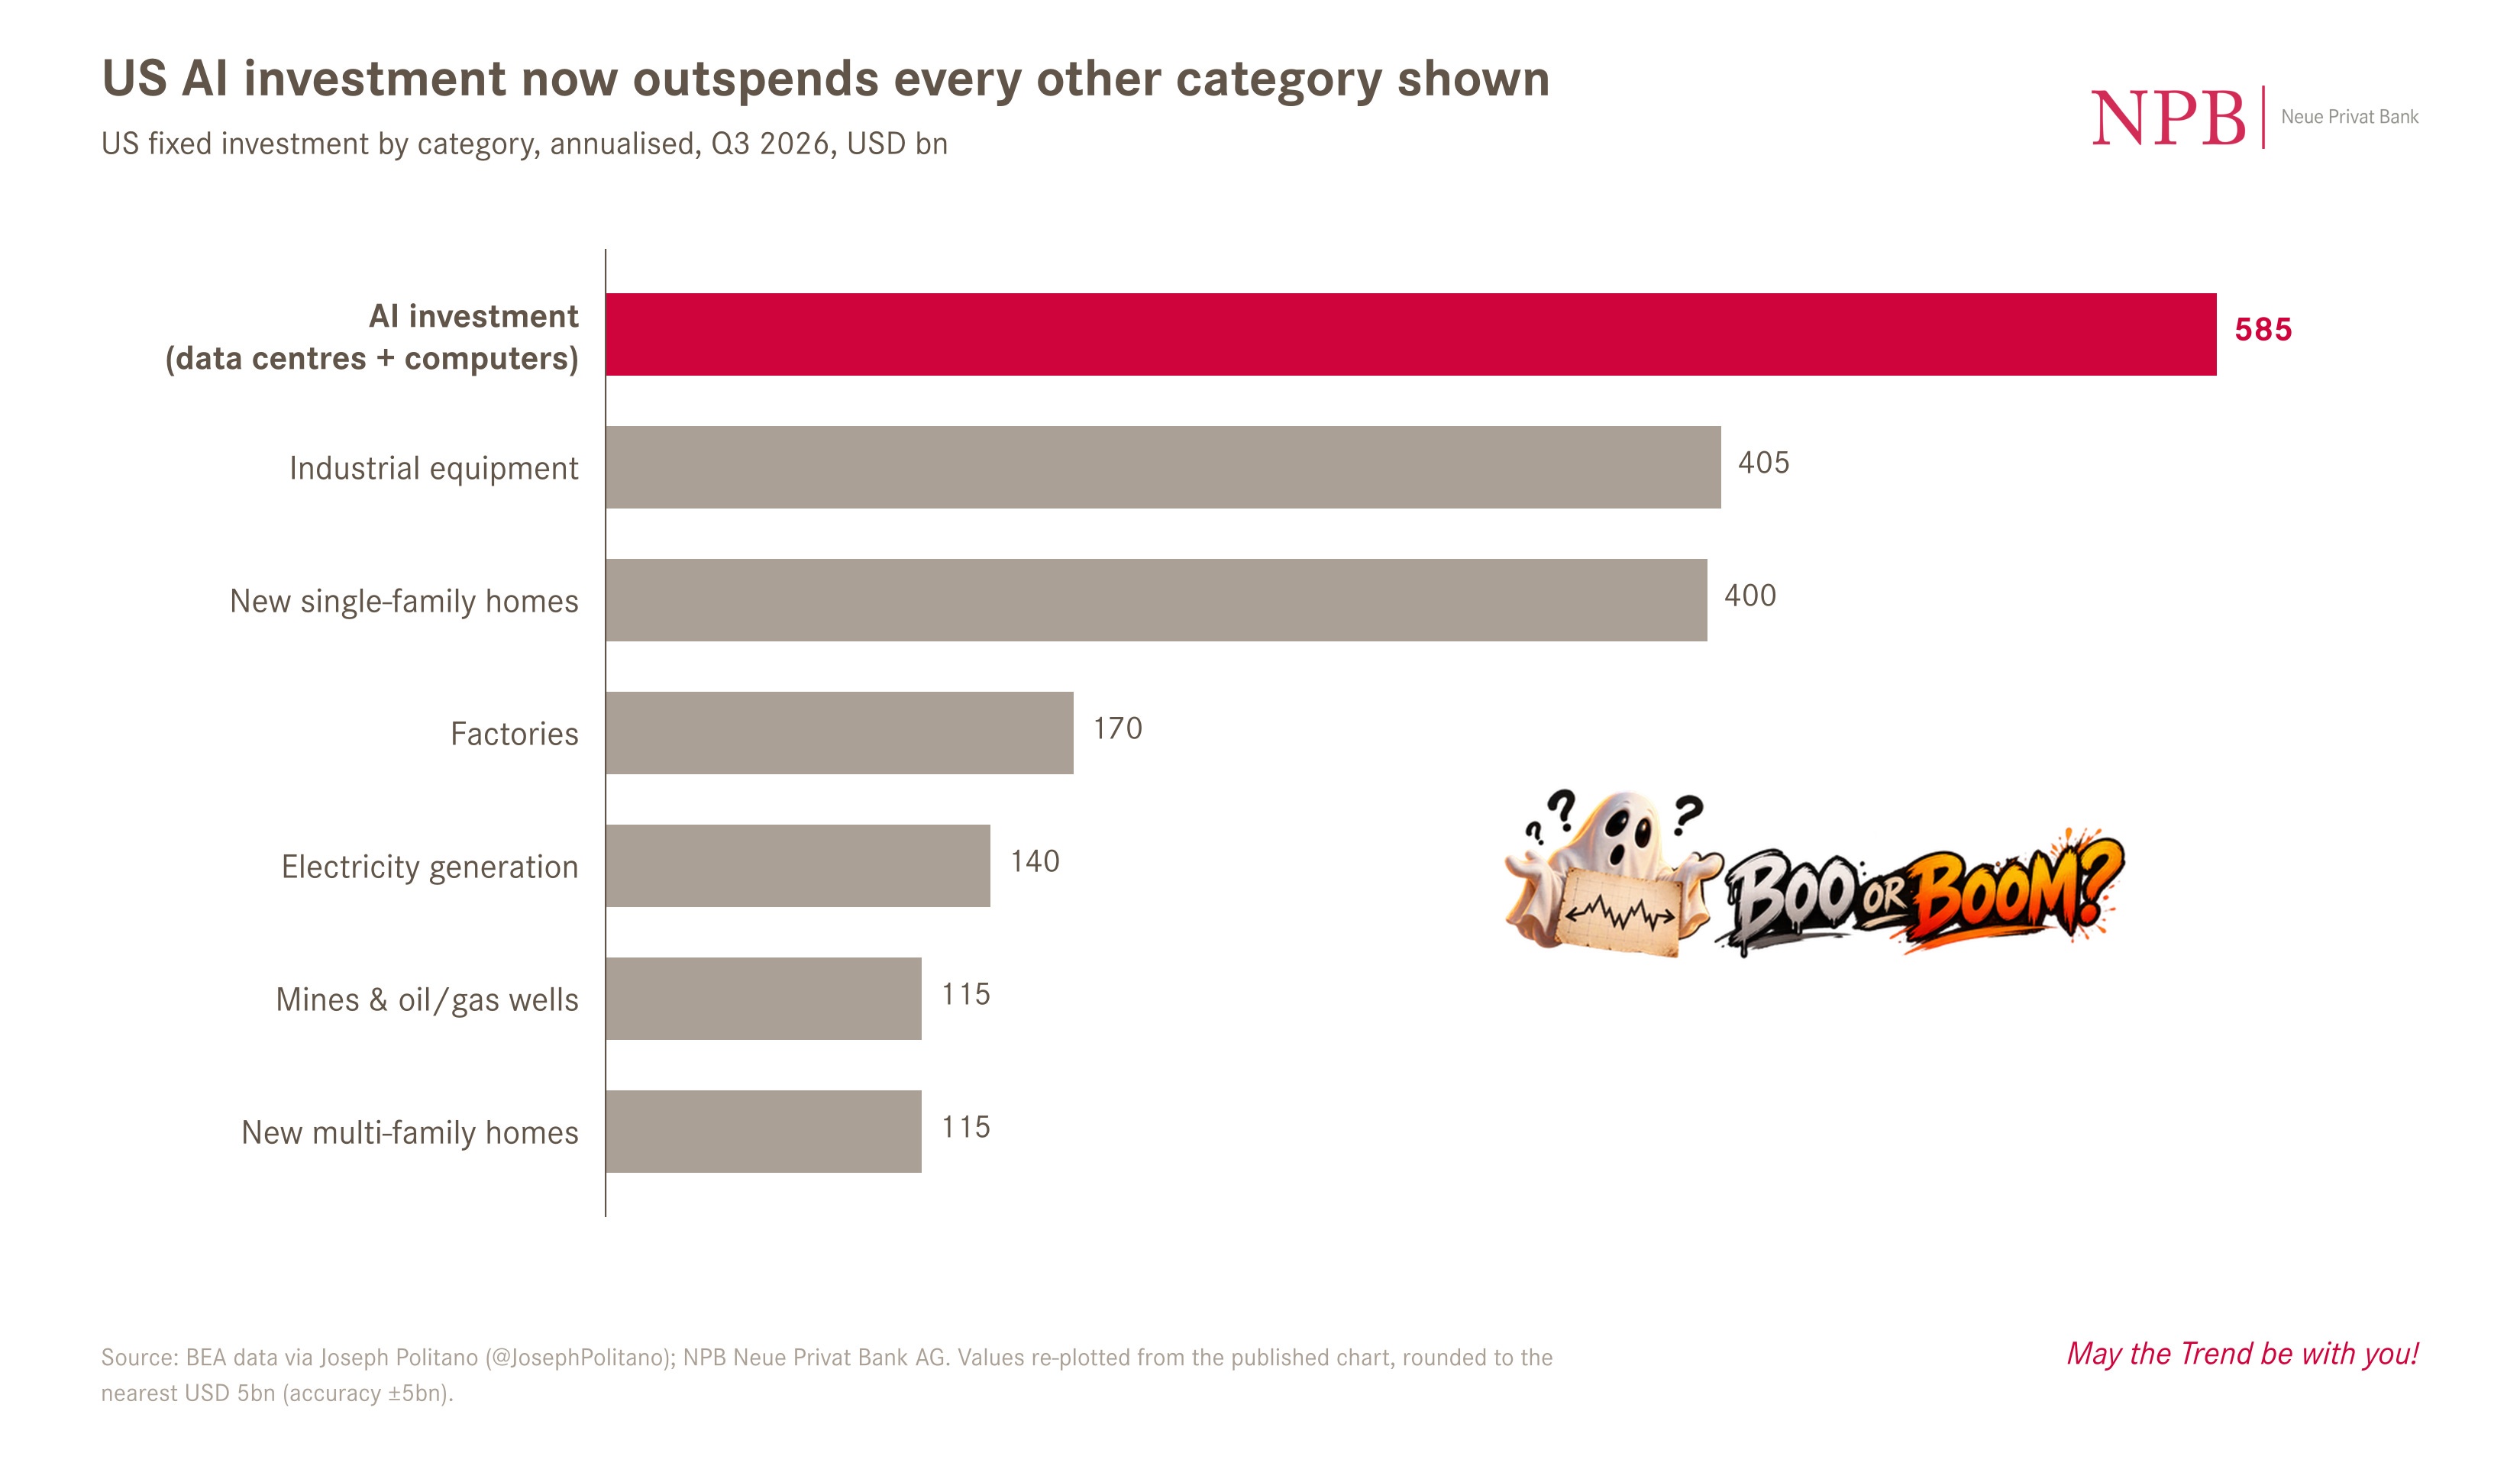
For example, the following chart demonstrates the importance of the AI trade on the US economy:
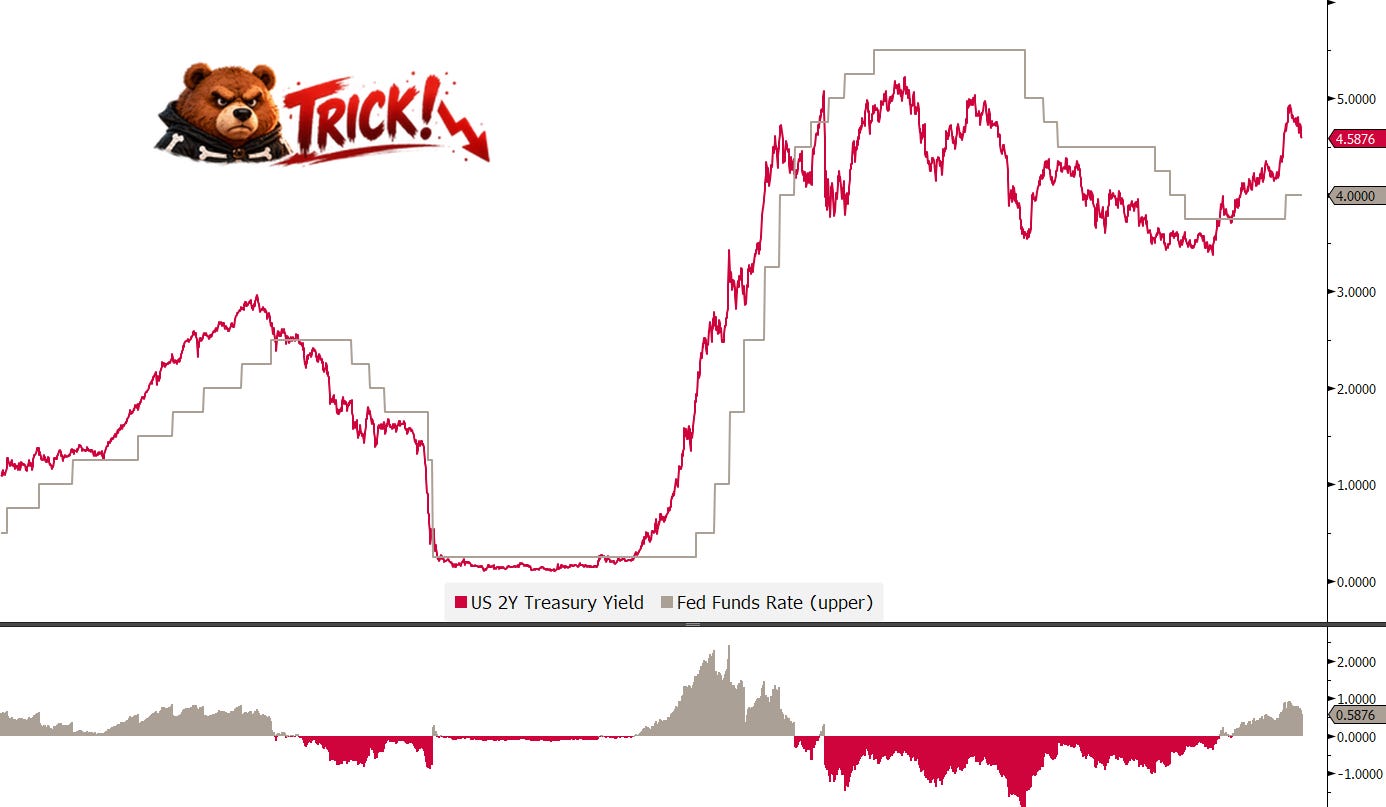
The Fed, which has the dual mandate of minimizing unemployment and keeping inflation in checkers, and not, of assessing the impact of AI on the economy, should have raised rates last week, but decided it “unpolitically” (tongue in cheek, yes) prefers to fall further behind the curve:
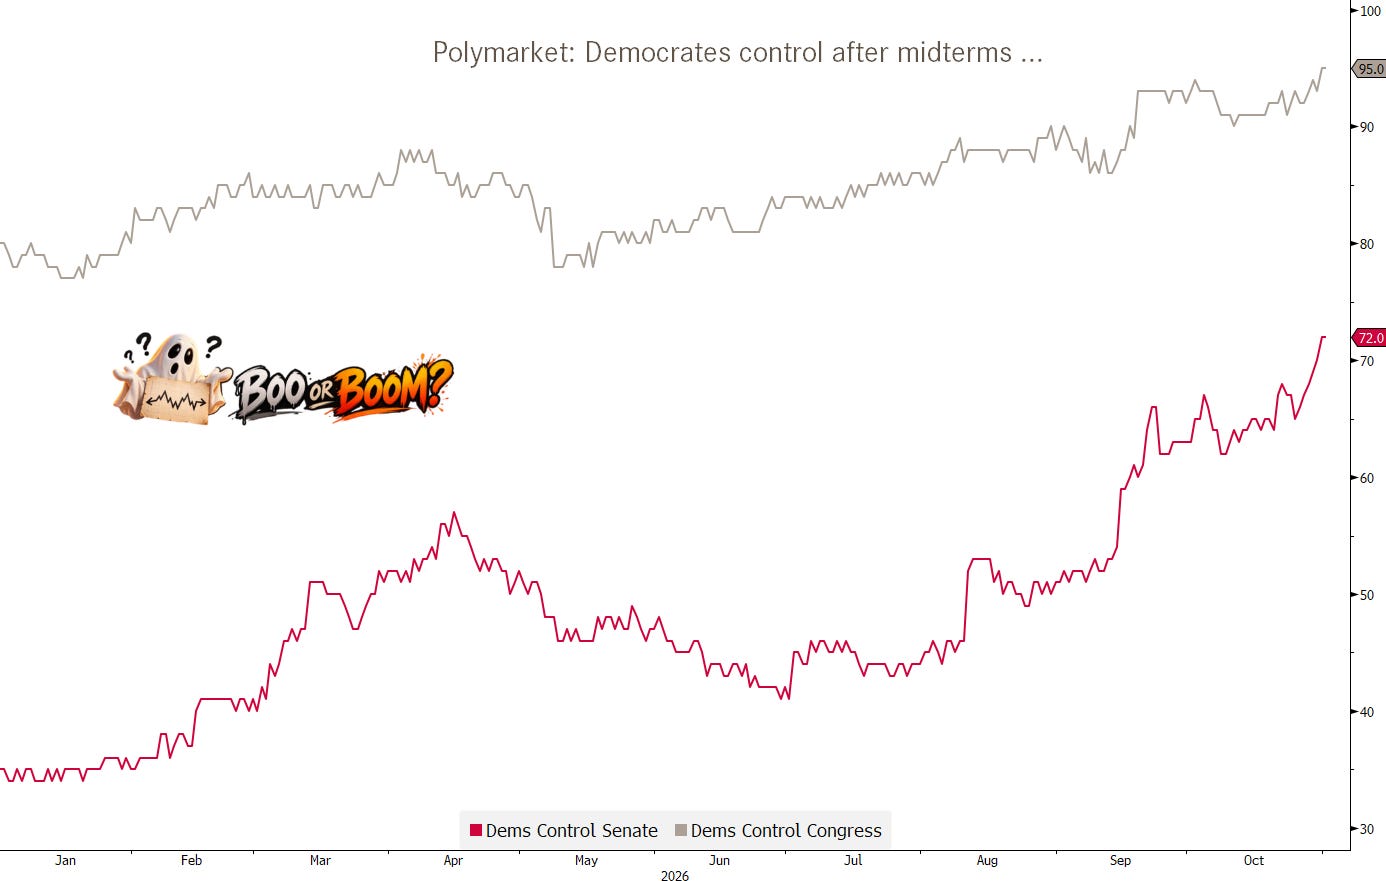
One curve ball for markets in general could be if one particular member of the US cabaret cabinet proves to be a bad loser and throws the Monopoly board of the table by contesting the mid-term election results:
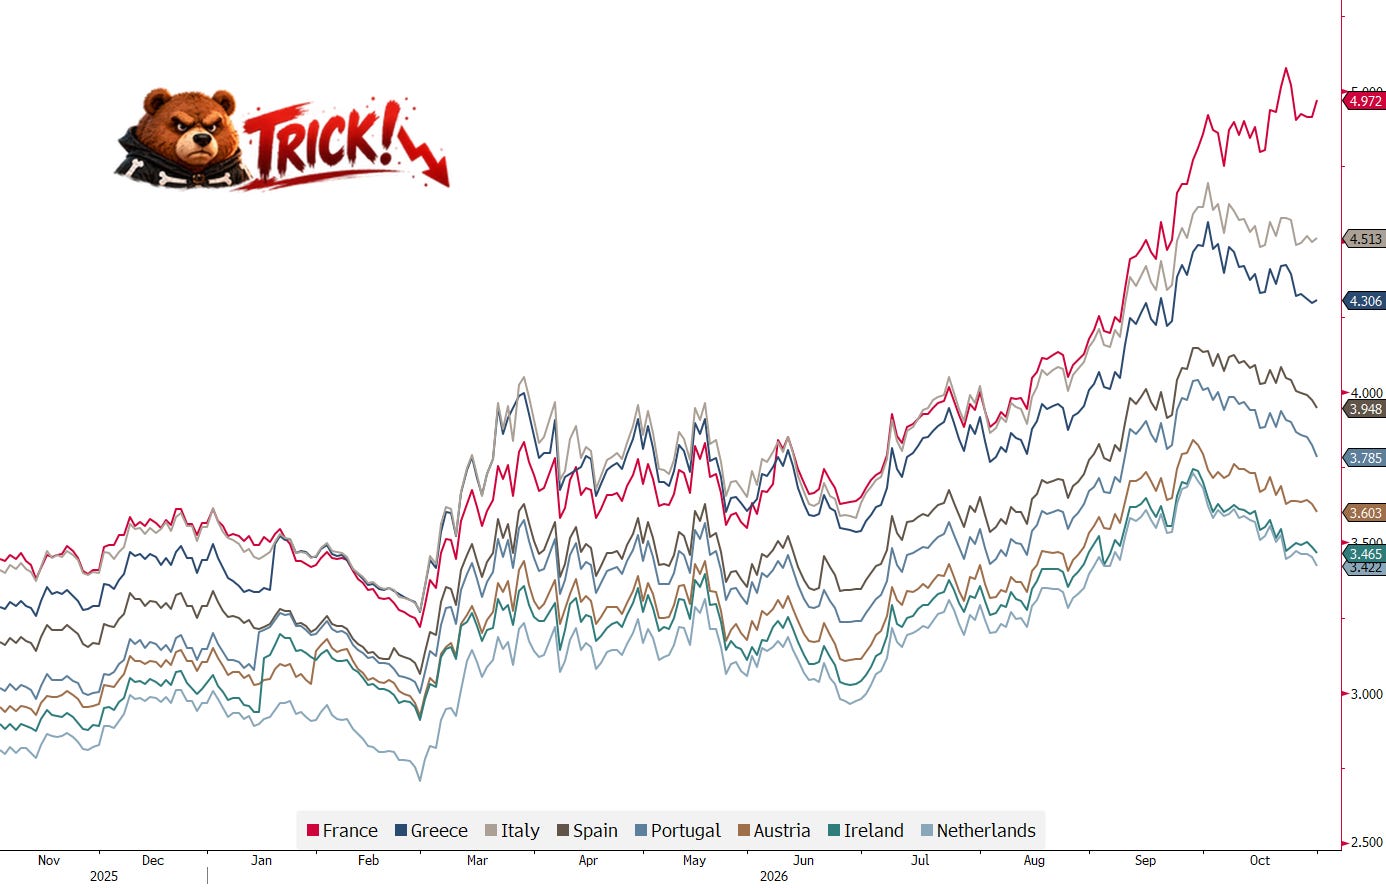
In Europe in the meantime, French government bonds not only carry the highest 10-year yields of the majors in the Eurozone, but there is also something very disturbing about the direction in comparison to the others:
The credit spread blow-out in the CCCs is starting to contaminate the other quality buckets:
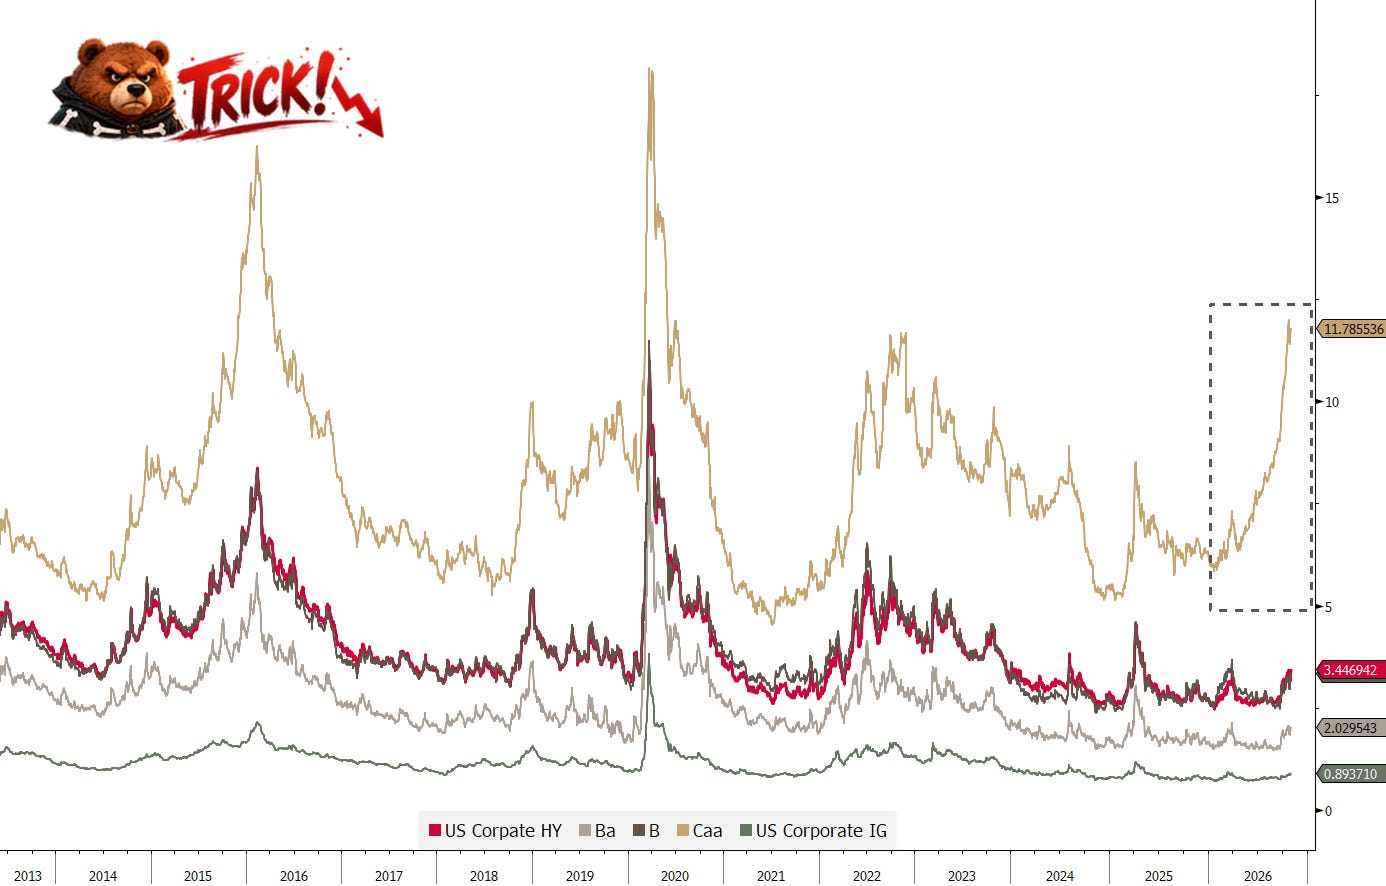
Which in turn could be another drag on stocks (surprised it has not been more of one so far):
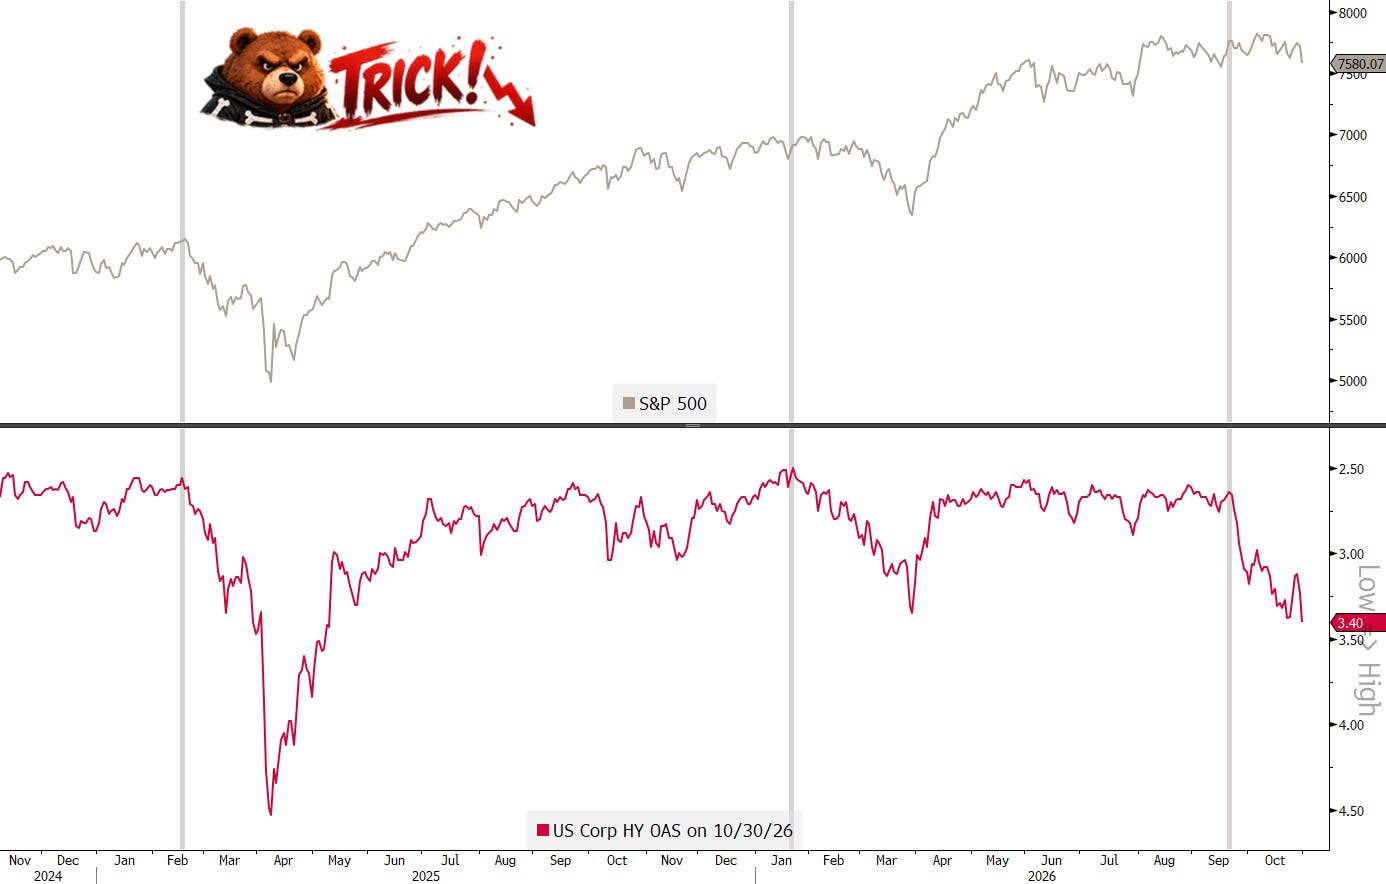
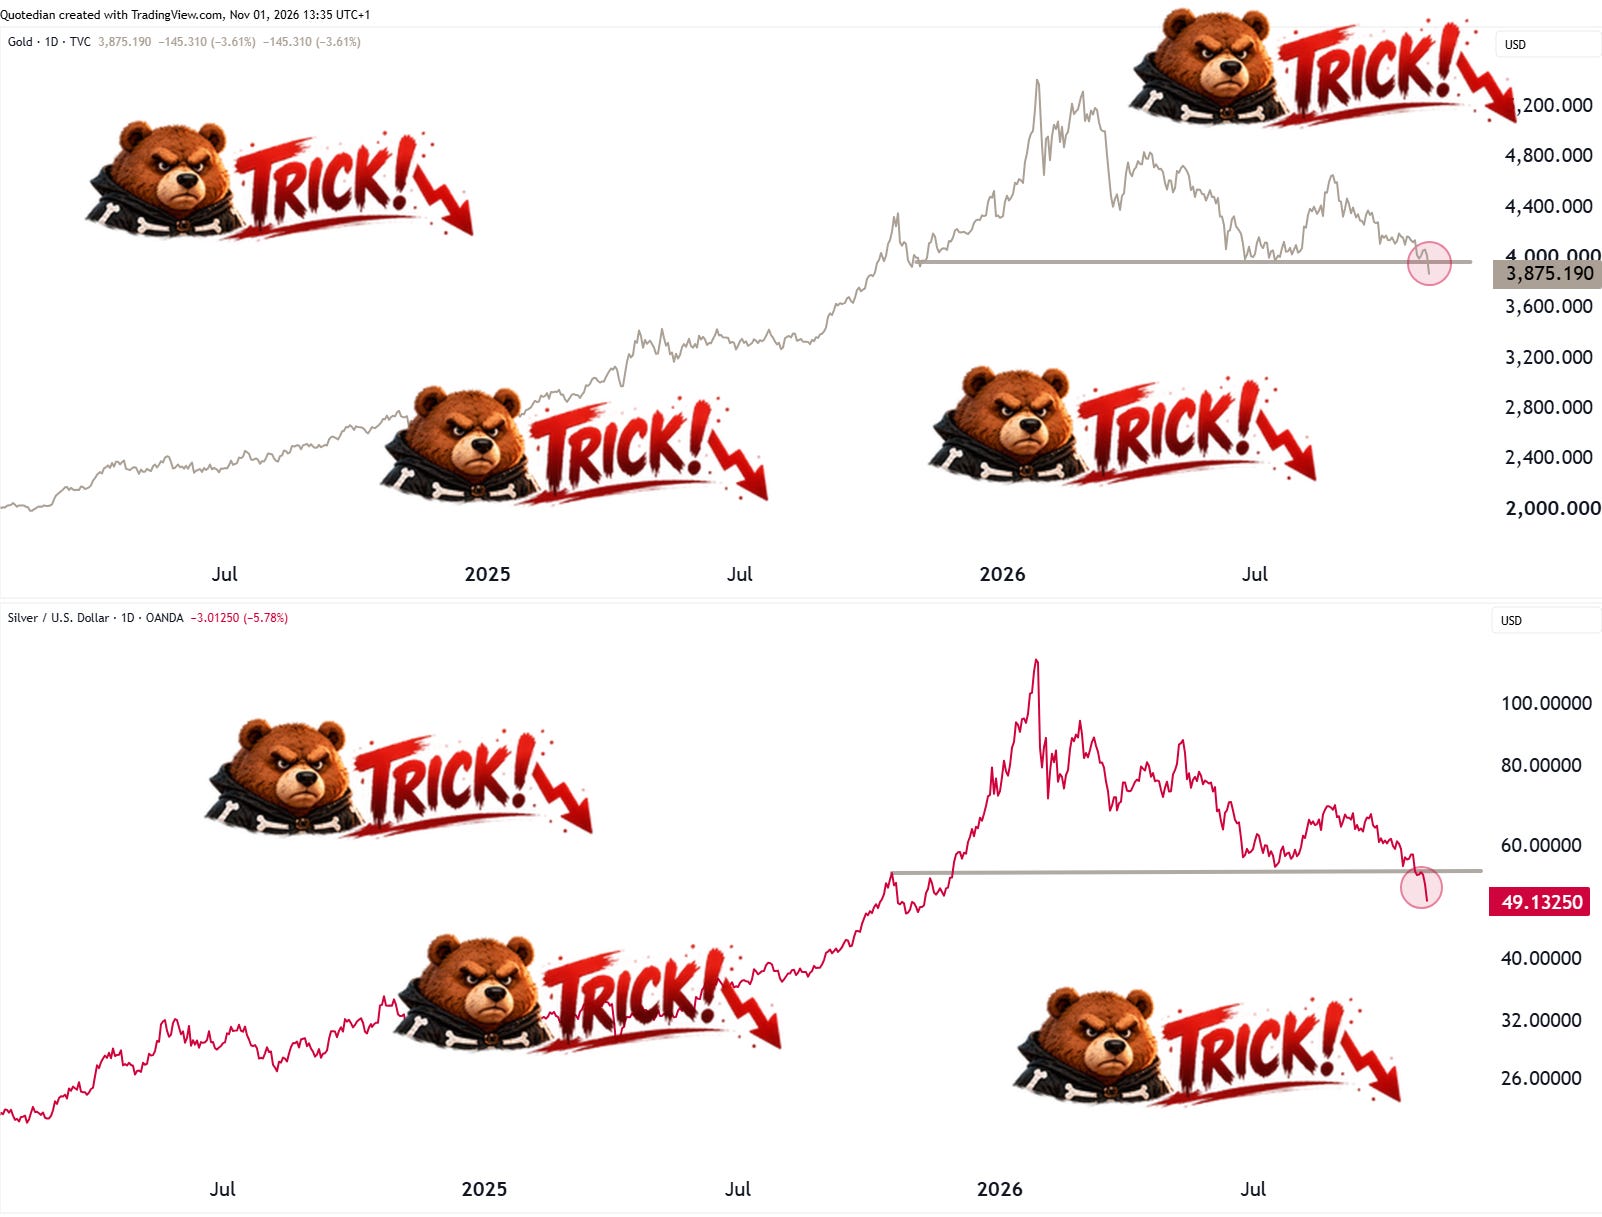
Ok, this is already a longer letter than I ever intended and in order to avoid a Halloween-scare induced by Mrs Quotedian, I will conclude here with just one more scary chart:
Unless Friday’s session turns out to have been a washout/liquidation in the precious metal space by providing a quick recovery next week, it is may duty to report that Gold and Silver have departed:

So, are we all gonna die? Probably not.
Will the world end? If so, nothing to prepare for; hence, chill.
But most of all, as the most vivid R.E.M. amongst you have detected much further up in this essay, is that the song title does not end at :
“It's the end of the world as we know it”.
Rather:

May the Trend be with You!
André

The Important One:
Everything in this document is for educational purposes only (FEPO)
Nothing in this document should be considered investment advice
Investing real money can be costly; don’t do stupid shit
Leave politics at the door—markets don’t care.
Past performance is hopefully no indication of future performance
The views expressed in this document may differ from the views published by NPB Neue Privat Bank AG
The Legal One: