

Wake Me Up When September Ends
Vol VIII, Issue 25 | Powered by NPB Neue Privat Bank AG

“September tries its best to have us forget summer.”
— Bernard Williams
Enjoying The Quotedian but not yet signed up for The QuiCQ? What are you waiting for?!!

September tends to be a volatile month, as I discussed in a LinkedIn post (click here) a week ago:

However, so far (grey line) the market has ‘failed’ to live up to its September reputation:
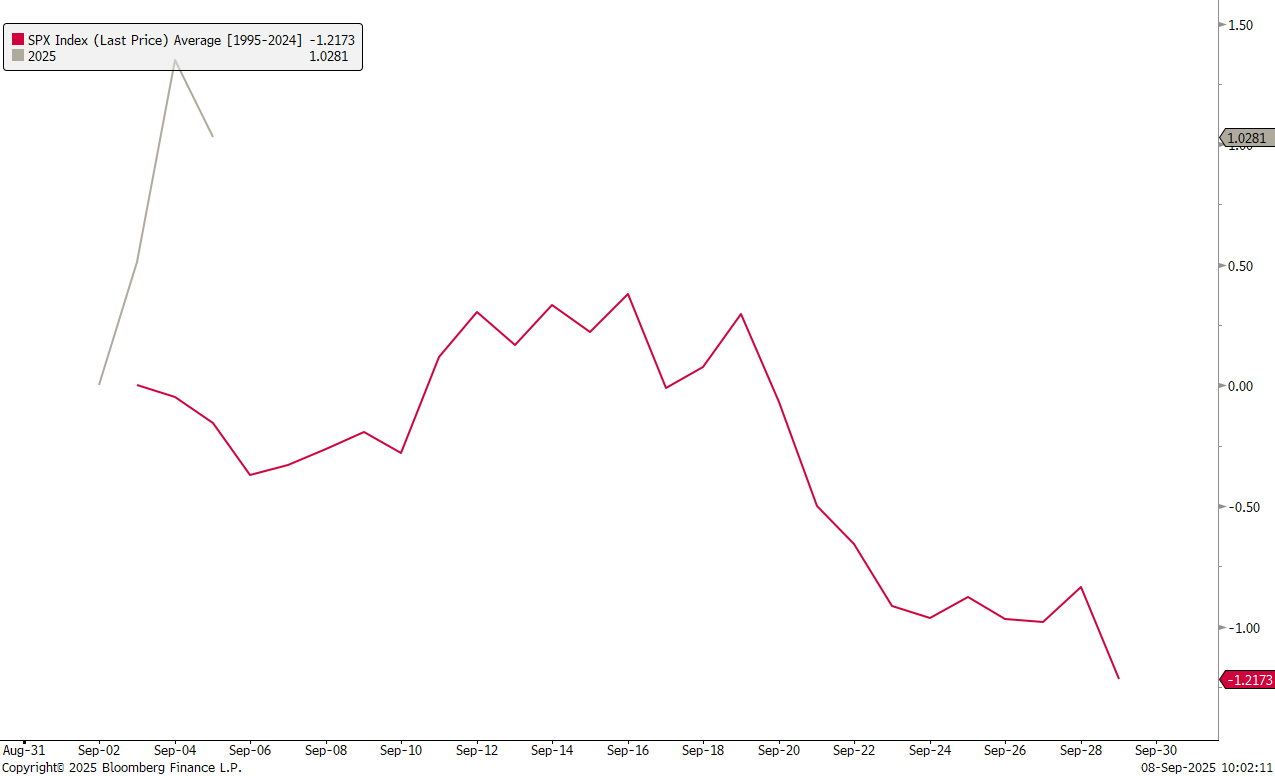
Though for some reason, Friday’s intraday reversal, at least today, feels like it could have marked an intermediate top:
So, are we finally in for a more meaningful equity market correction? Perhaps.
Maybe we should heed to Green Day’s advice and only wake up once September ends …

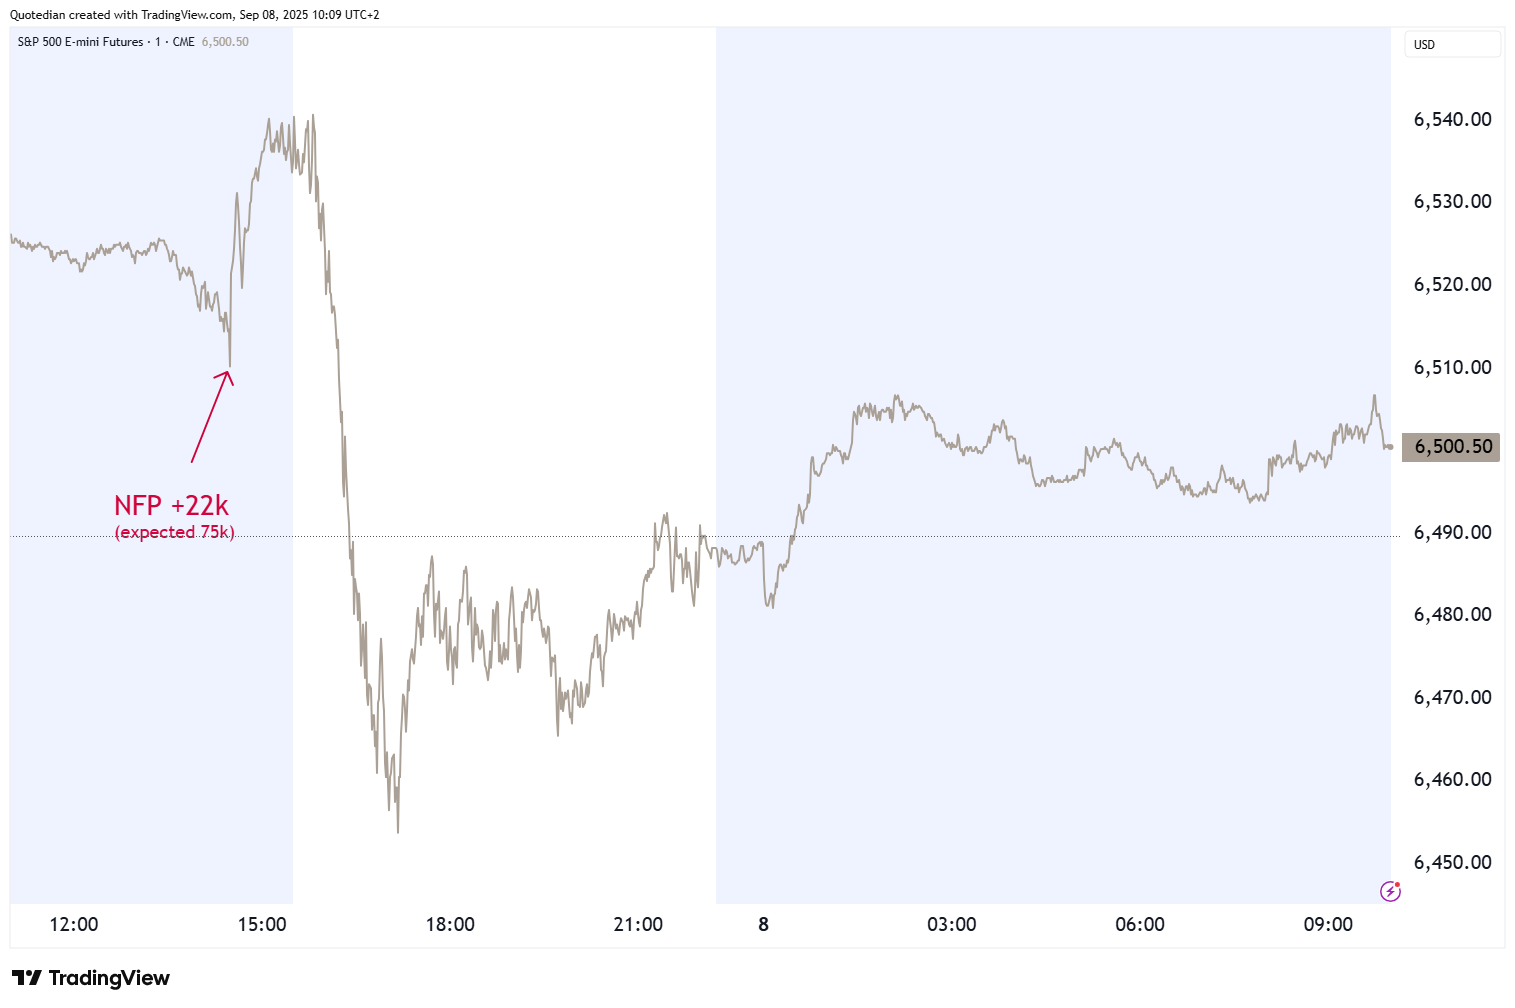
As the monthly non-farm payroll came in substantially weaker-than-expected
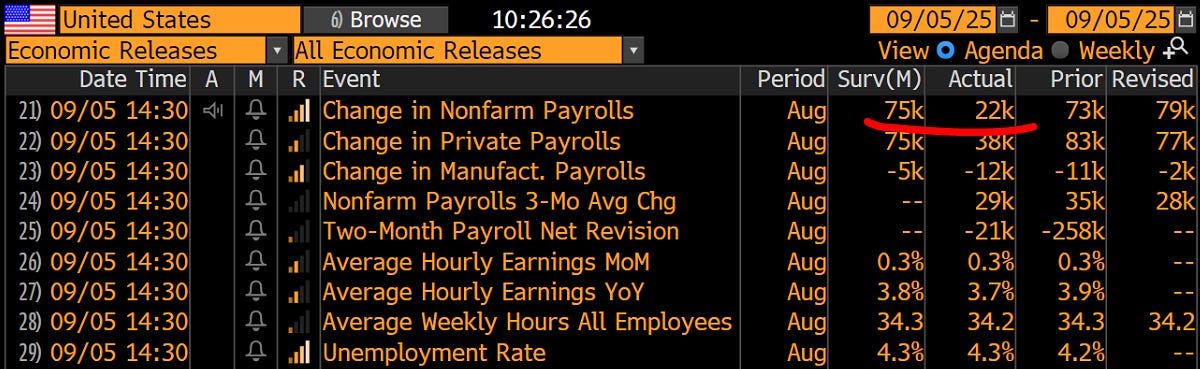
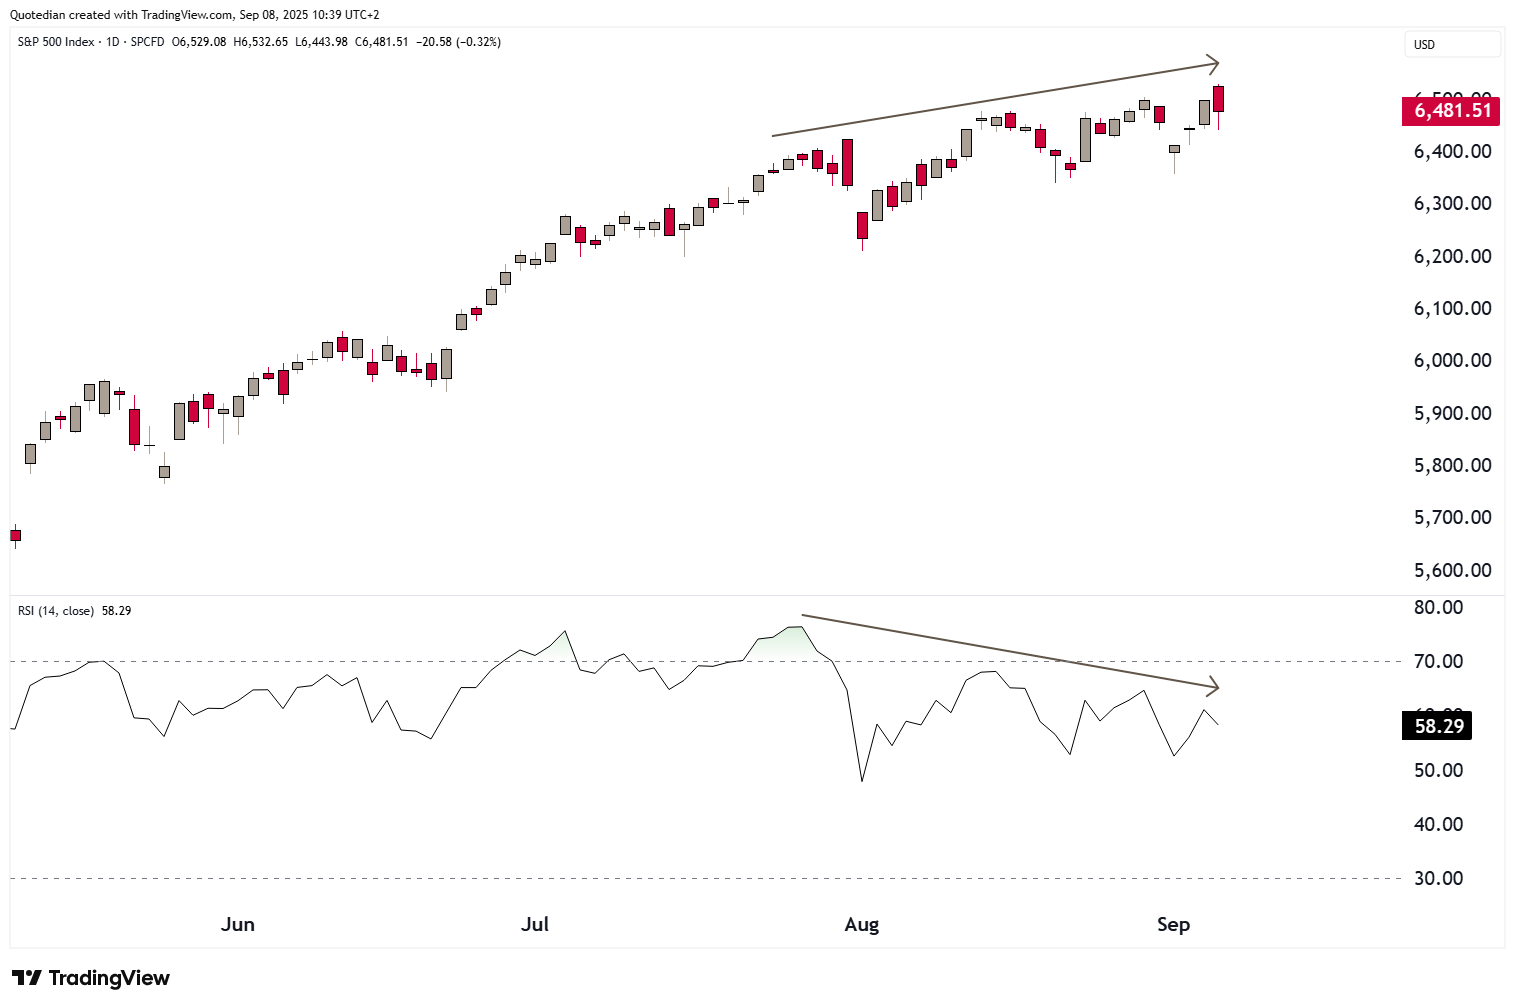
on Friday, the S&P 500 was briefly pushed to a new all-time high (ATH) on the notion that the Federal Reserve bank now for sure would be cutting rates next week. However, a few minutes into trading, market participants somehow collectively thought that bad news (lesser job) should be interpreted as bad news and started selling off their equity holdings. The chart now looks like a classical bull trap:
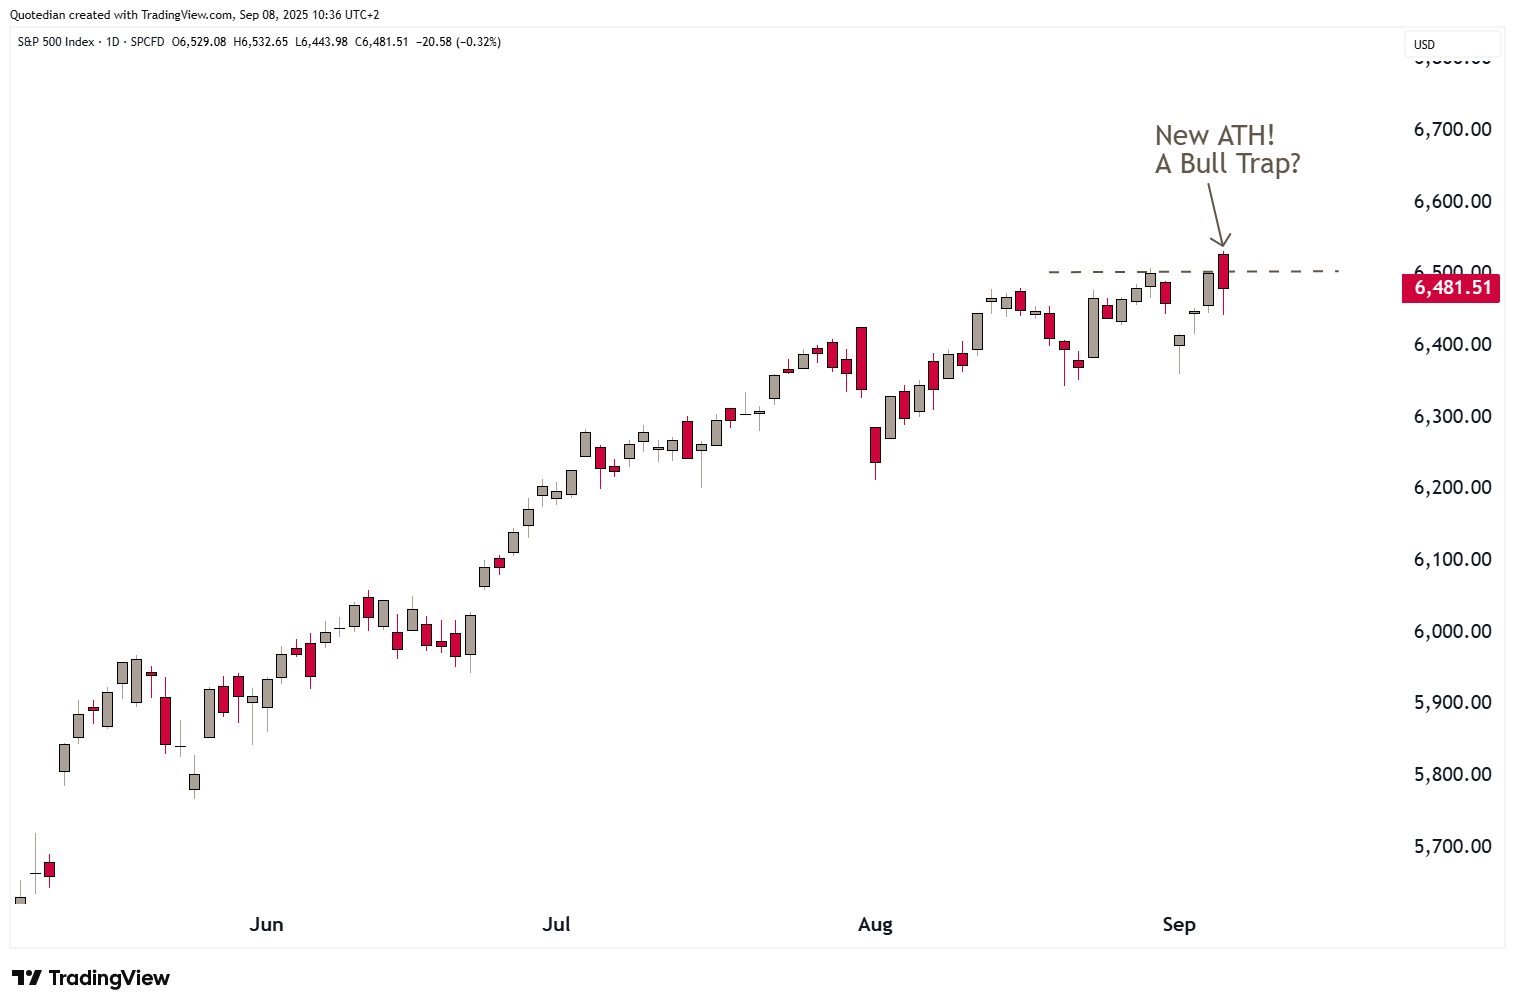
It is however also true that by the time the closing bell rang, stocks were well off their intraday lows, hence, it will be important to see if there is any follow-through over the coming sessions.
One sign that we indeed could be in for a pause in the equity rally is that momentum (RSI) has been diverging from price (see arrows) for over a month now:
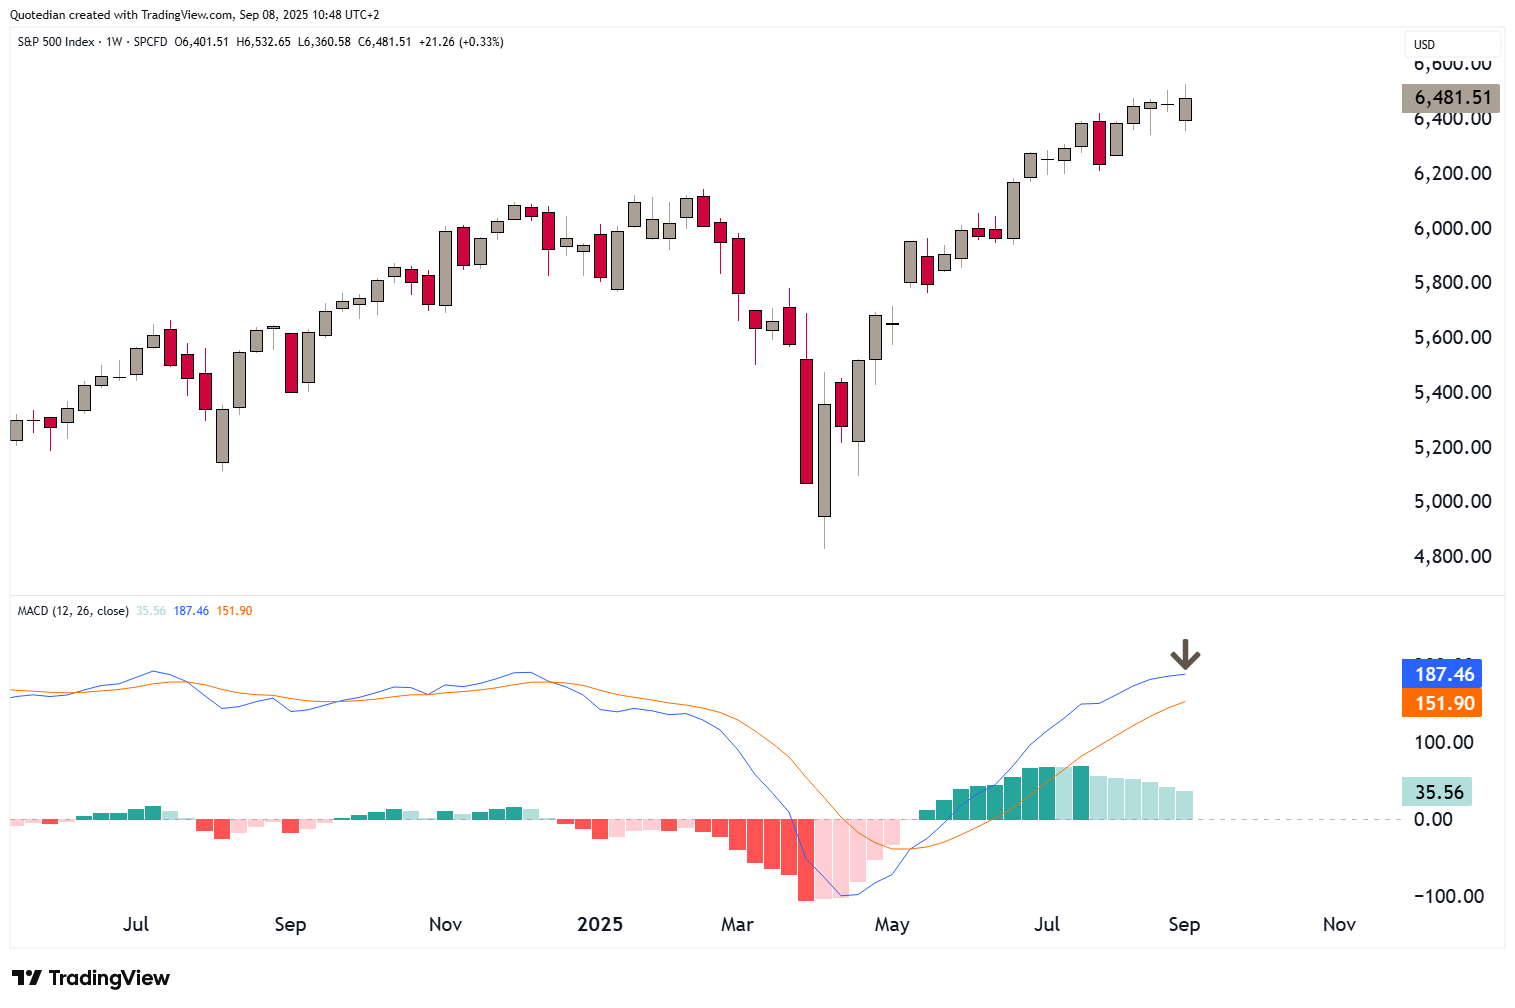
This at a time where the weekly MACD also seems to be rolling over:
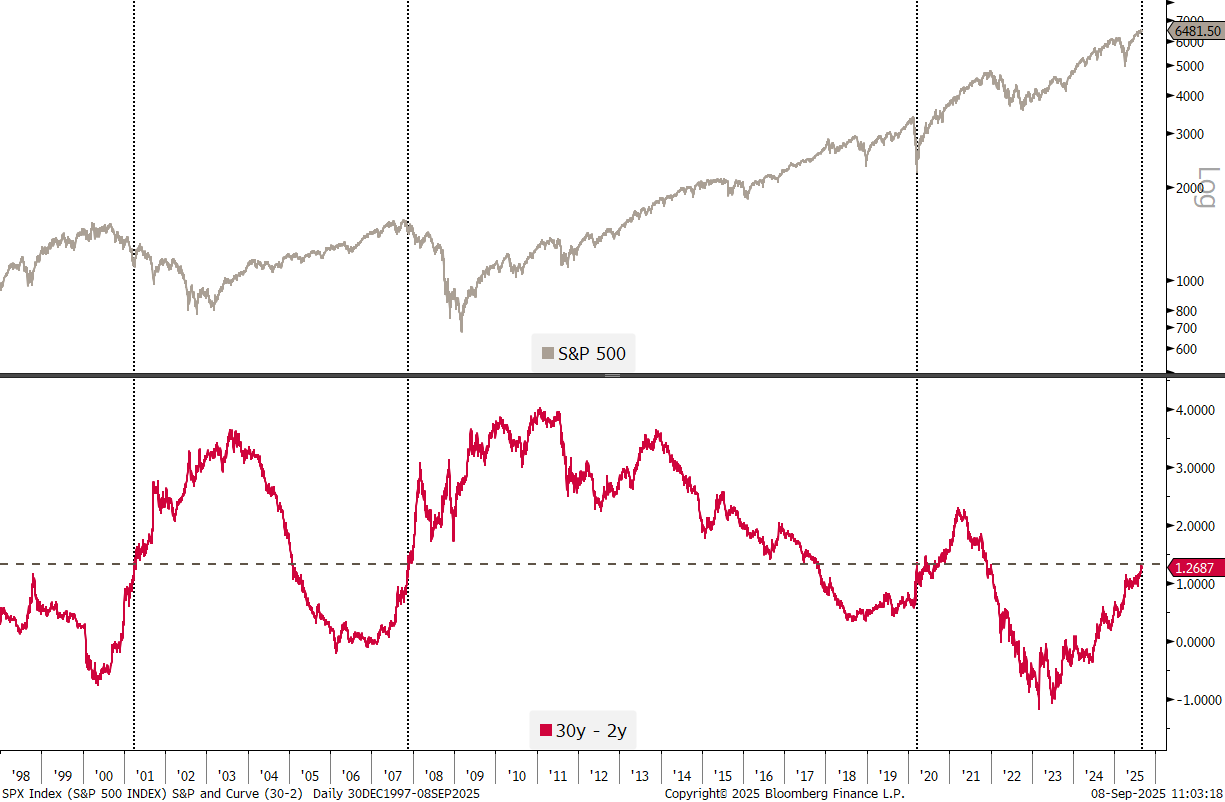
The yield curve (30y-2y) has been steepening rapidly to a level which on previous occasions broke the camel’s (read: equity market) back:
While it has been frustrating if not outright dangerous to call for a market top over the past months (years?) evidence of an least short-term correction is mounting as we show above.
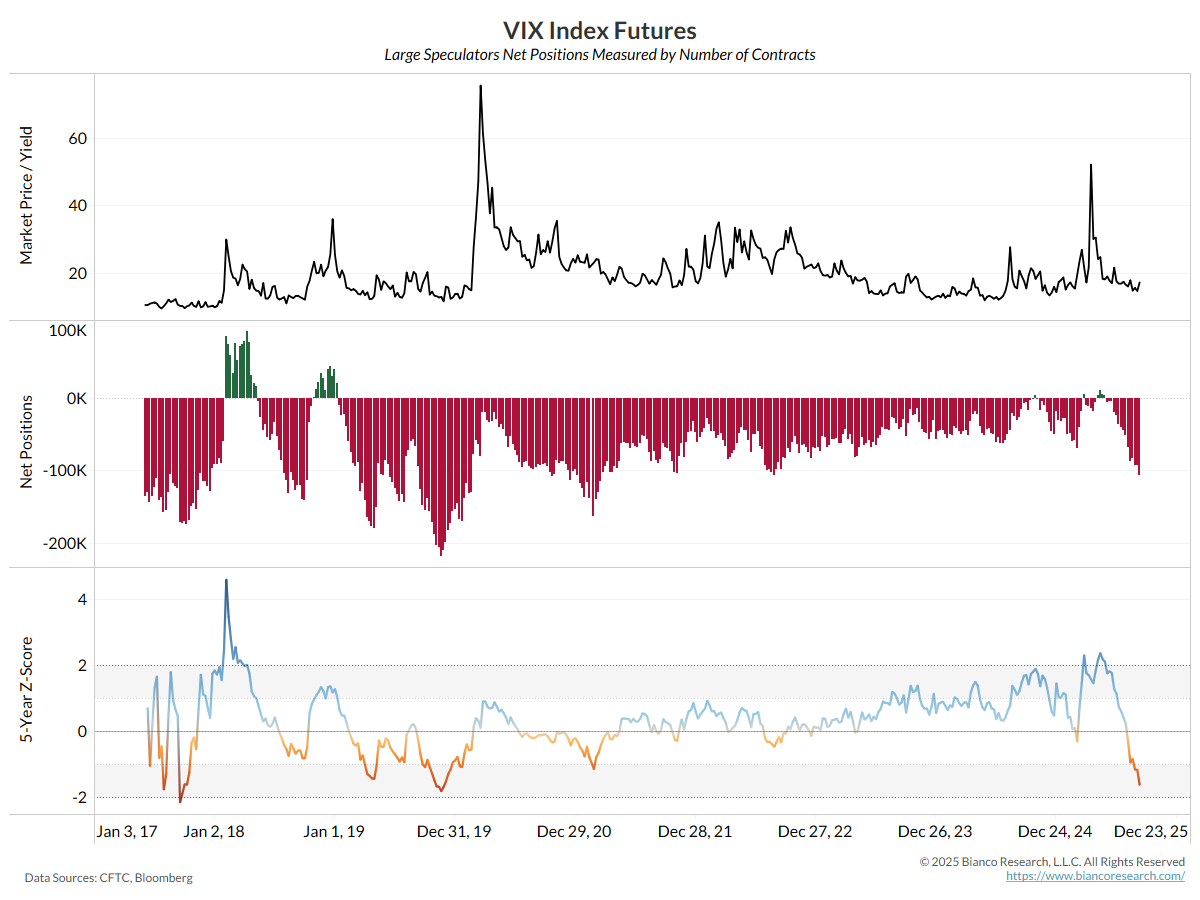
And then add in that large speculators have one of their largest short-positions on the VIX of the past years:
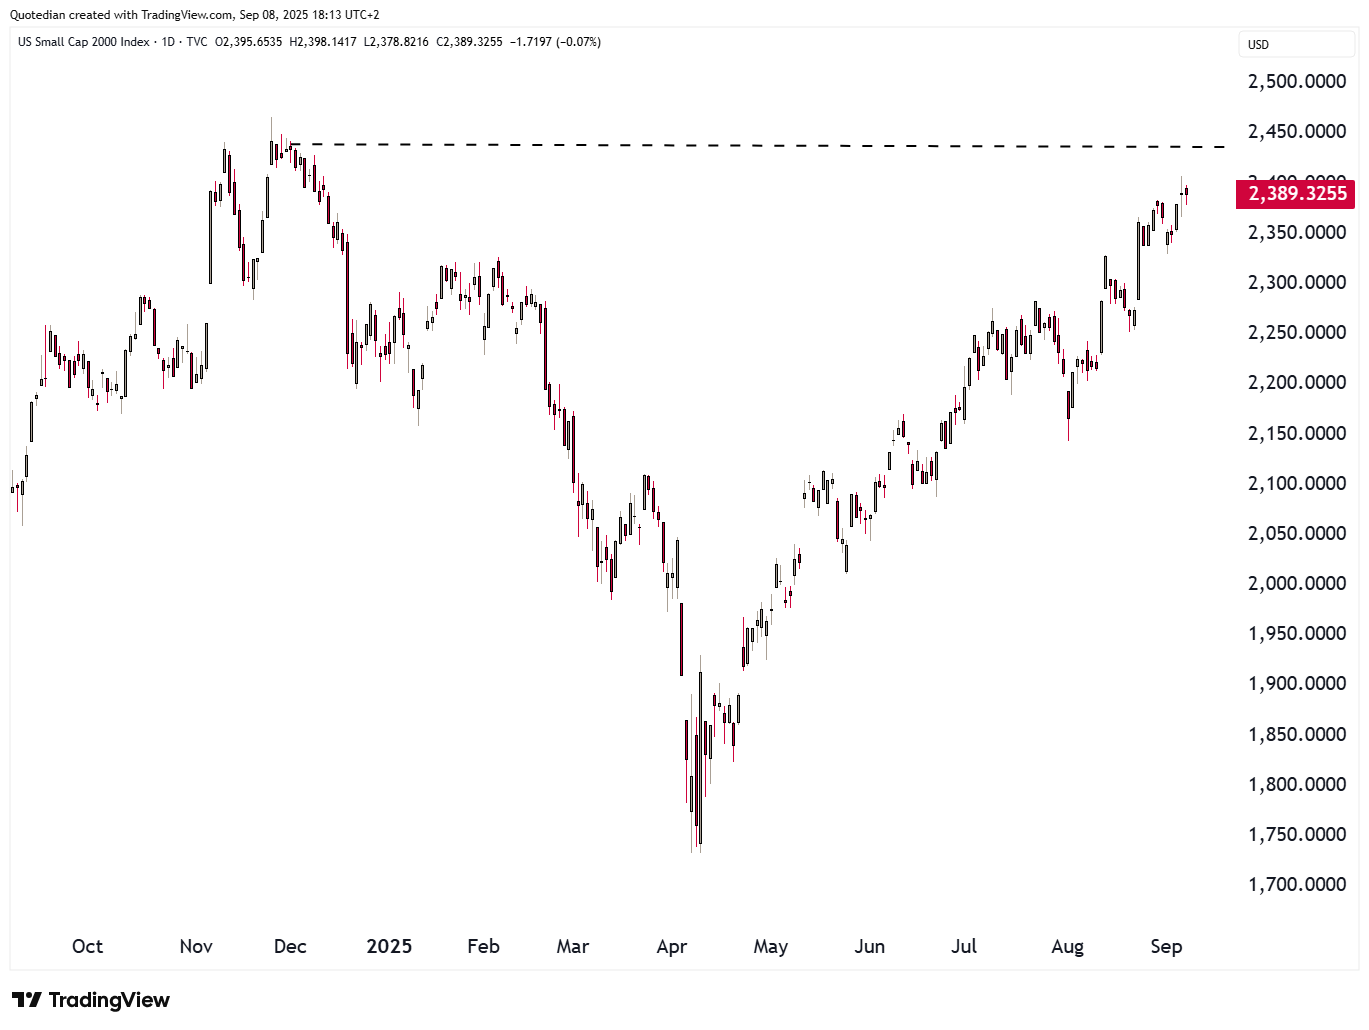
To be long small cap stocks (Russell 2000) seems to be good call, especially since it became clear that the Fed is embarking on the second leg of its easing cycle:
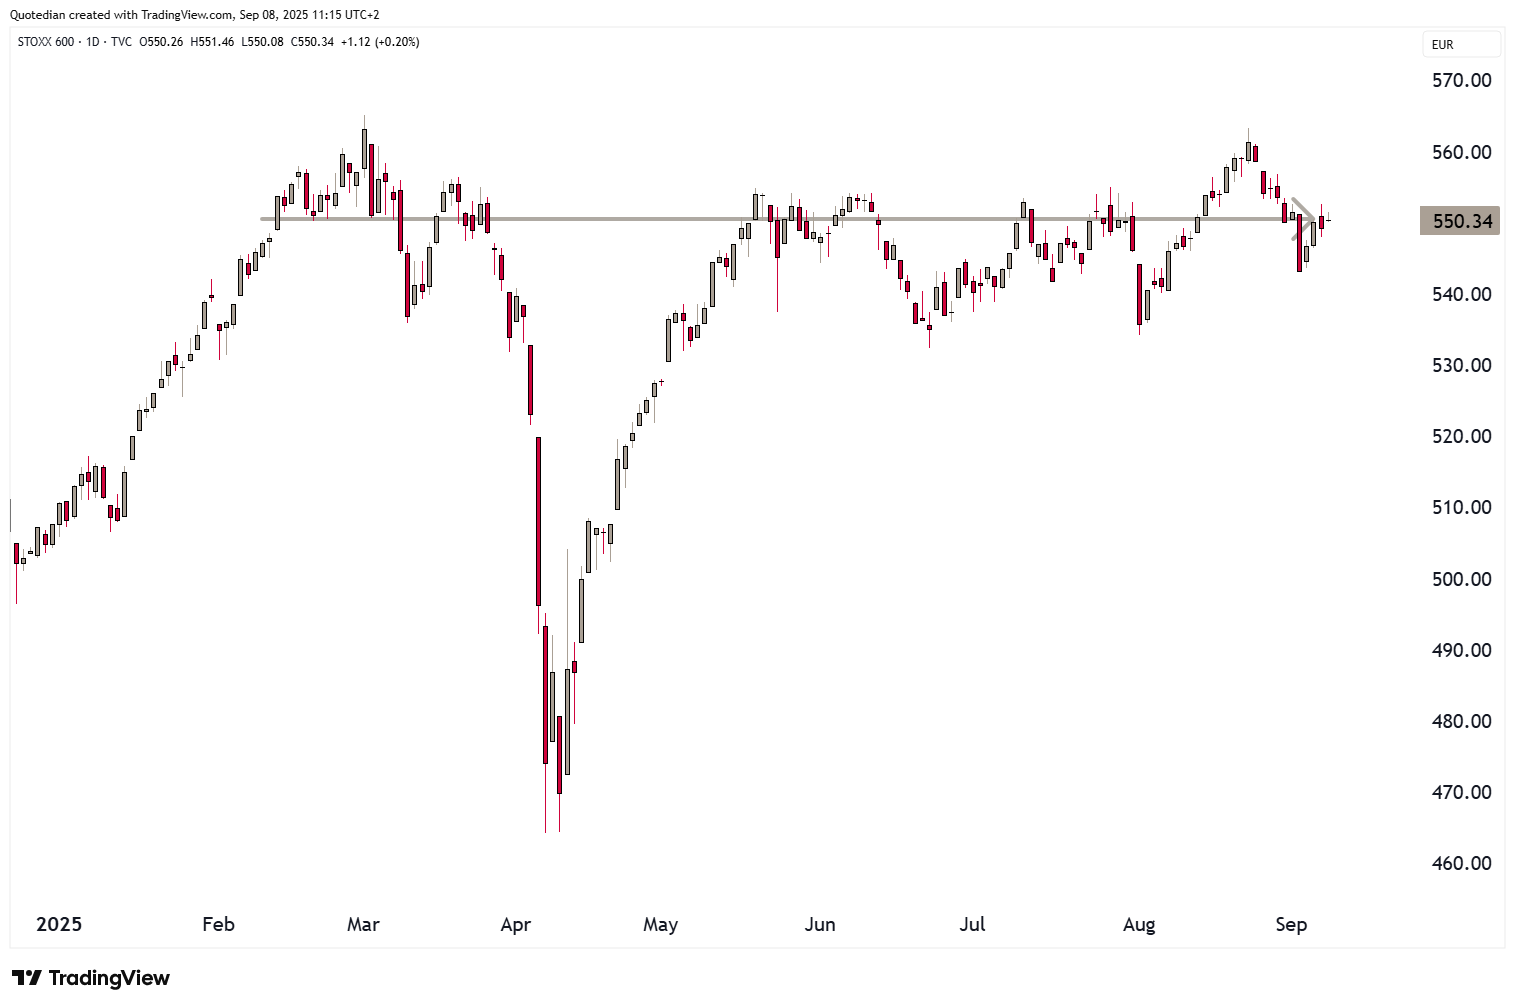
European stocks (SXXP) meanwhile have seen no net progress since February now:
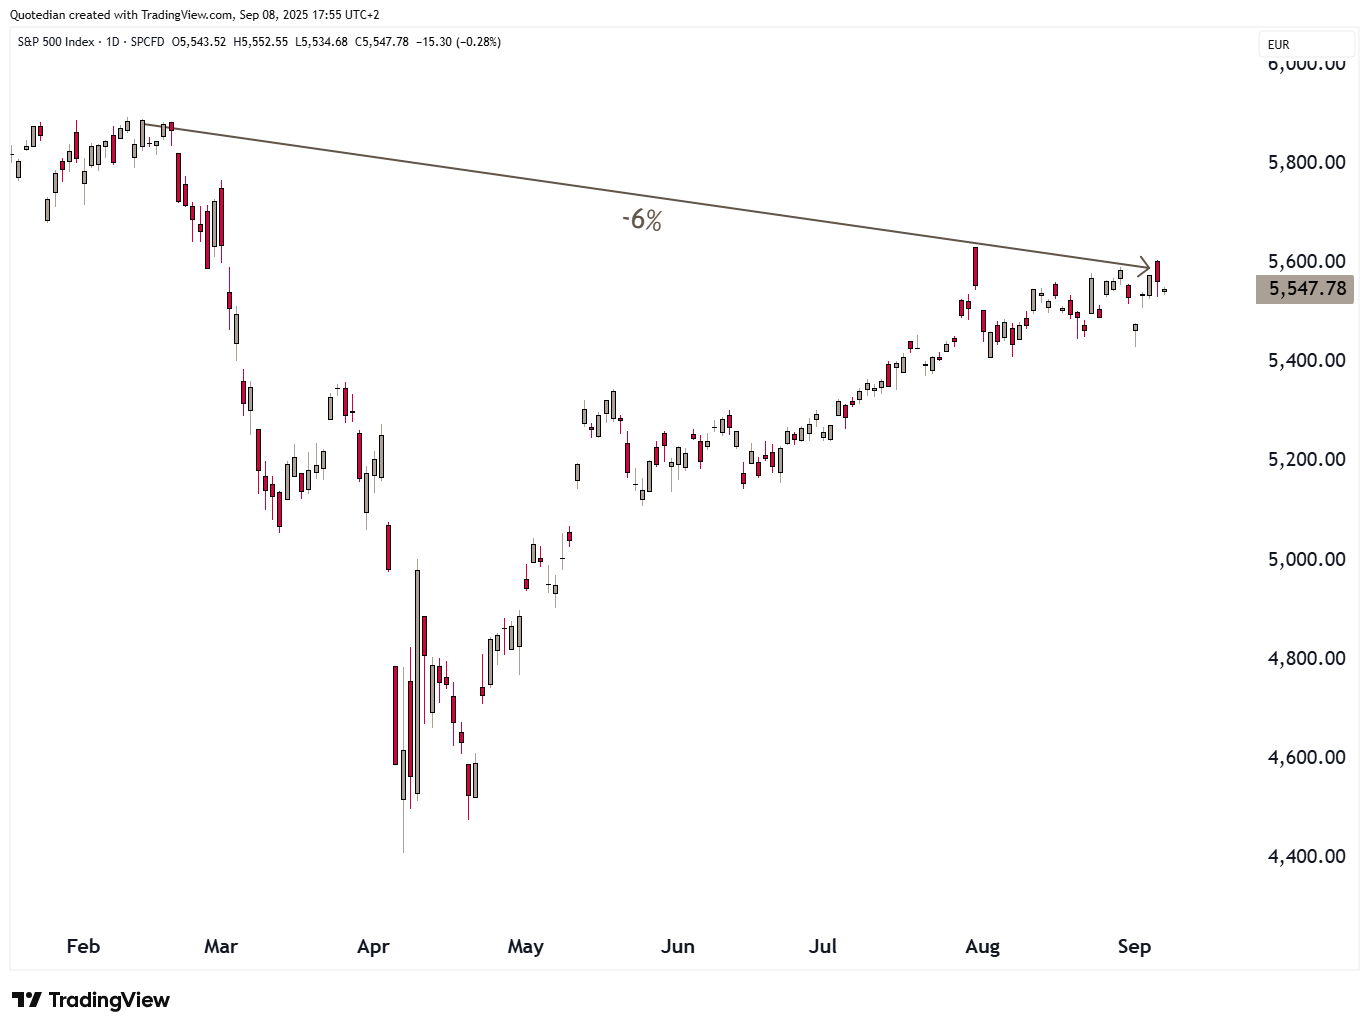
However, we must remember that this is also true for US stocks, if measured in Euros:
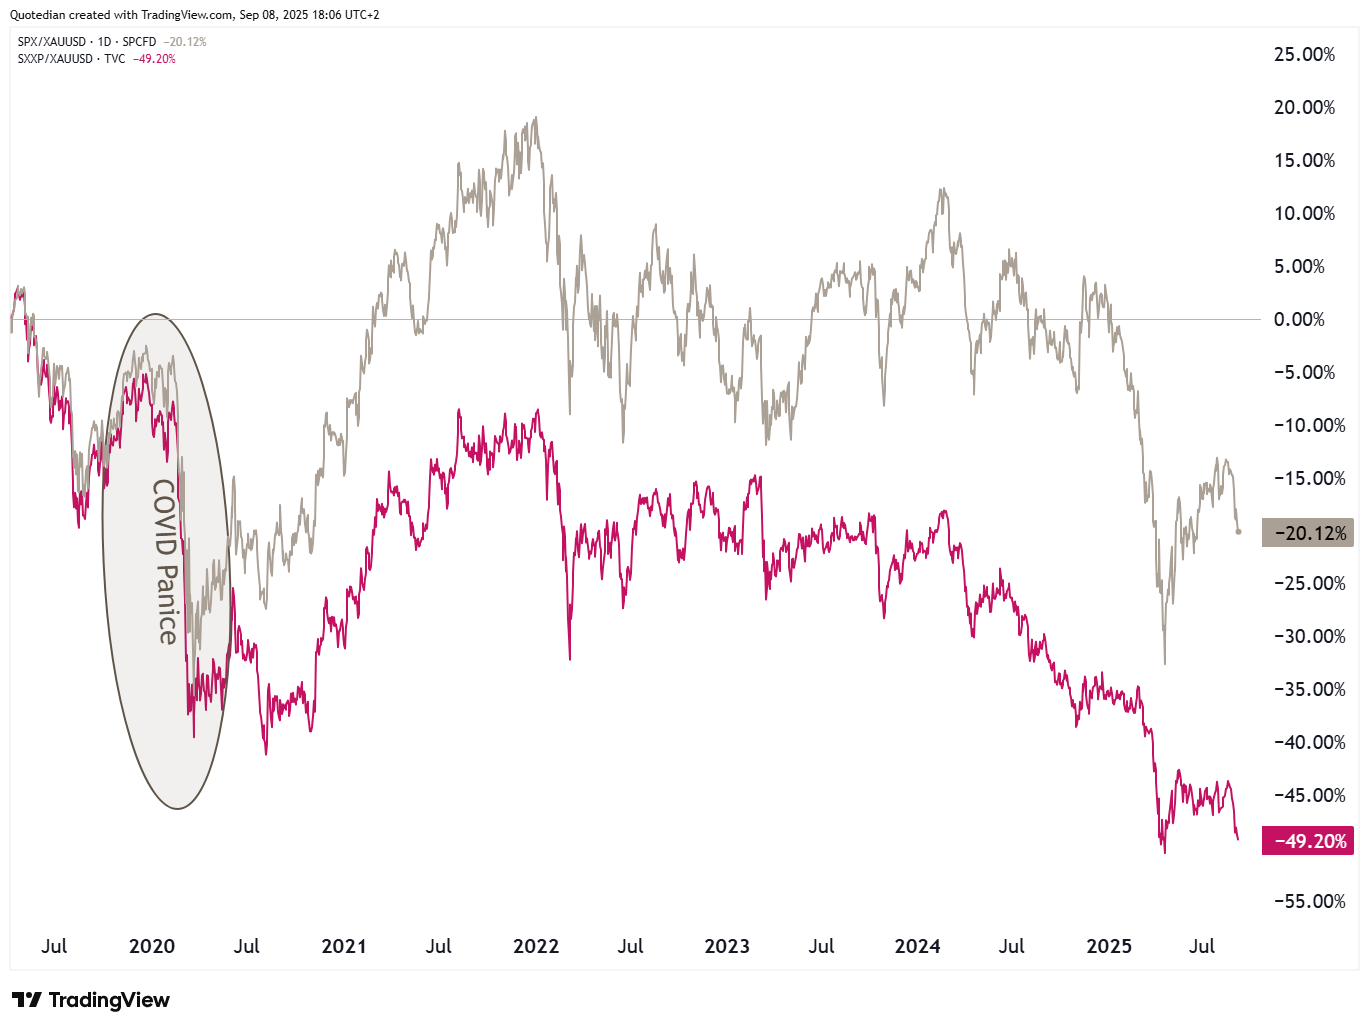
Actually, it gets even worse for both indices if we follow JP Morgan’s wise words:

So, when measuring the S&P 500 (grey) and the STOXX 600 (red) in Gold, we sadly realise that both are showing negative returns since the top just before the COVID-crash back in 2020:
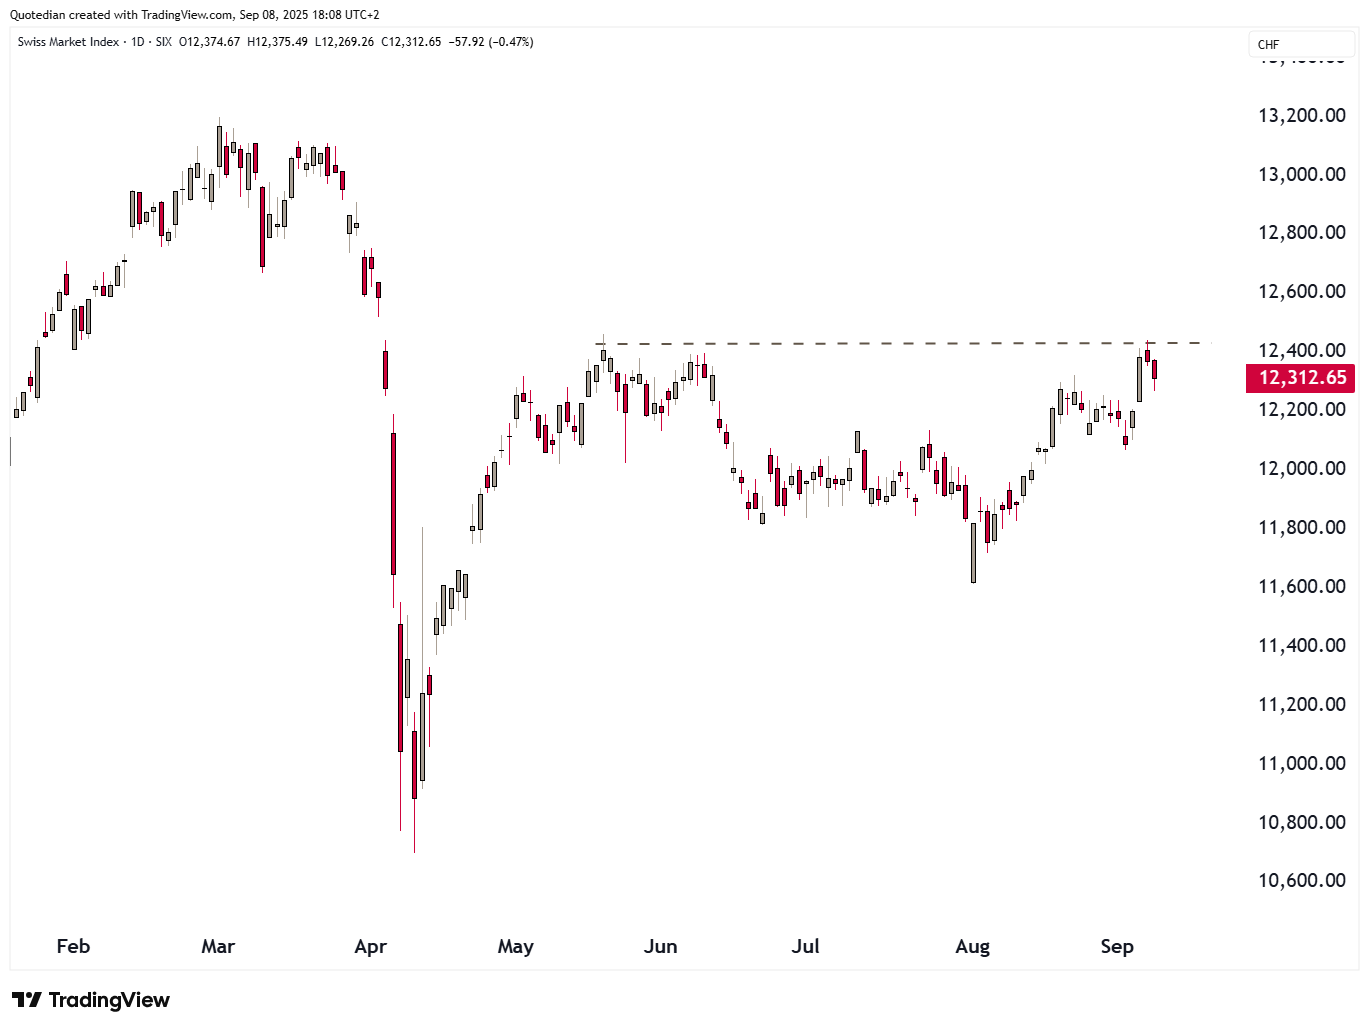
But back to European equity markets in Fiat. Switzerland’s large cap index, the SMI, continues to be one of the weaker performers in Europe, certainly not least due to its expensive currency:
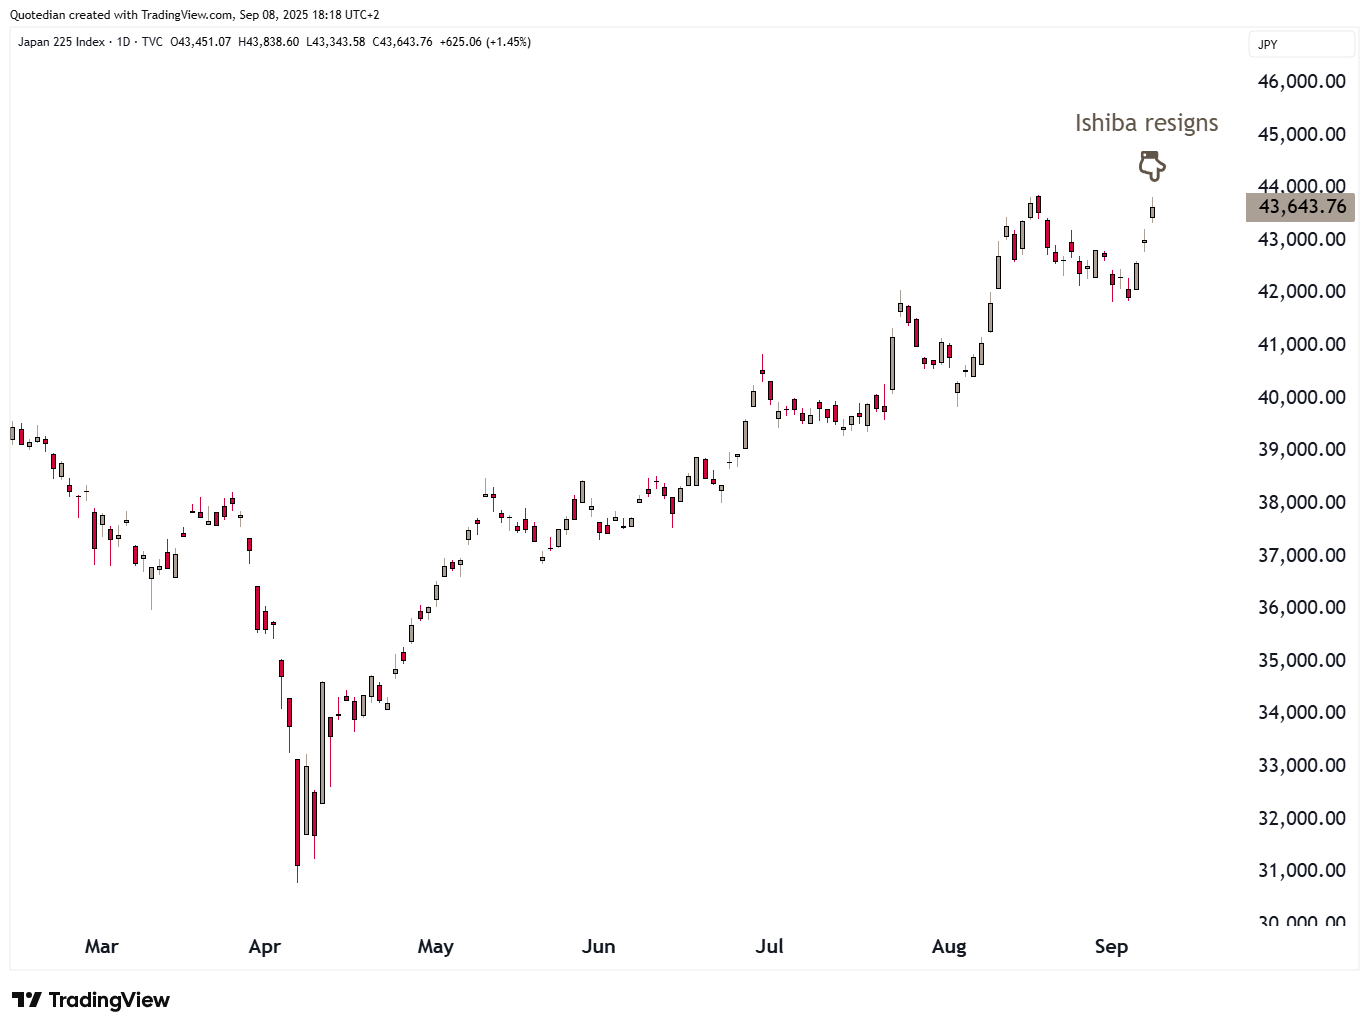
Over in Asia, stocks rallied in Japan after Prime Minister Ishiba announced his stepping down:
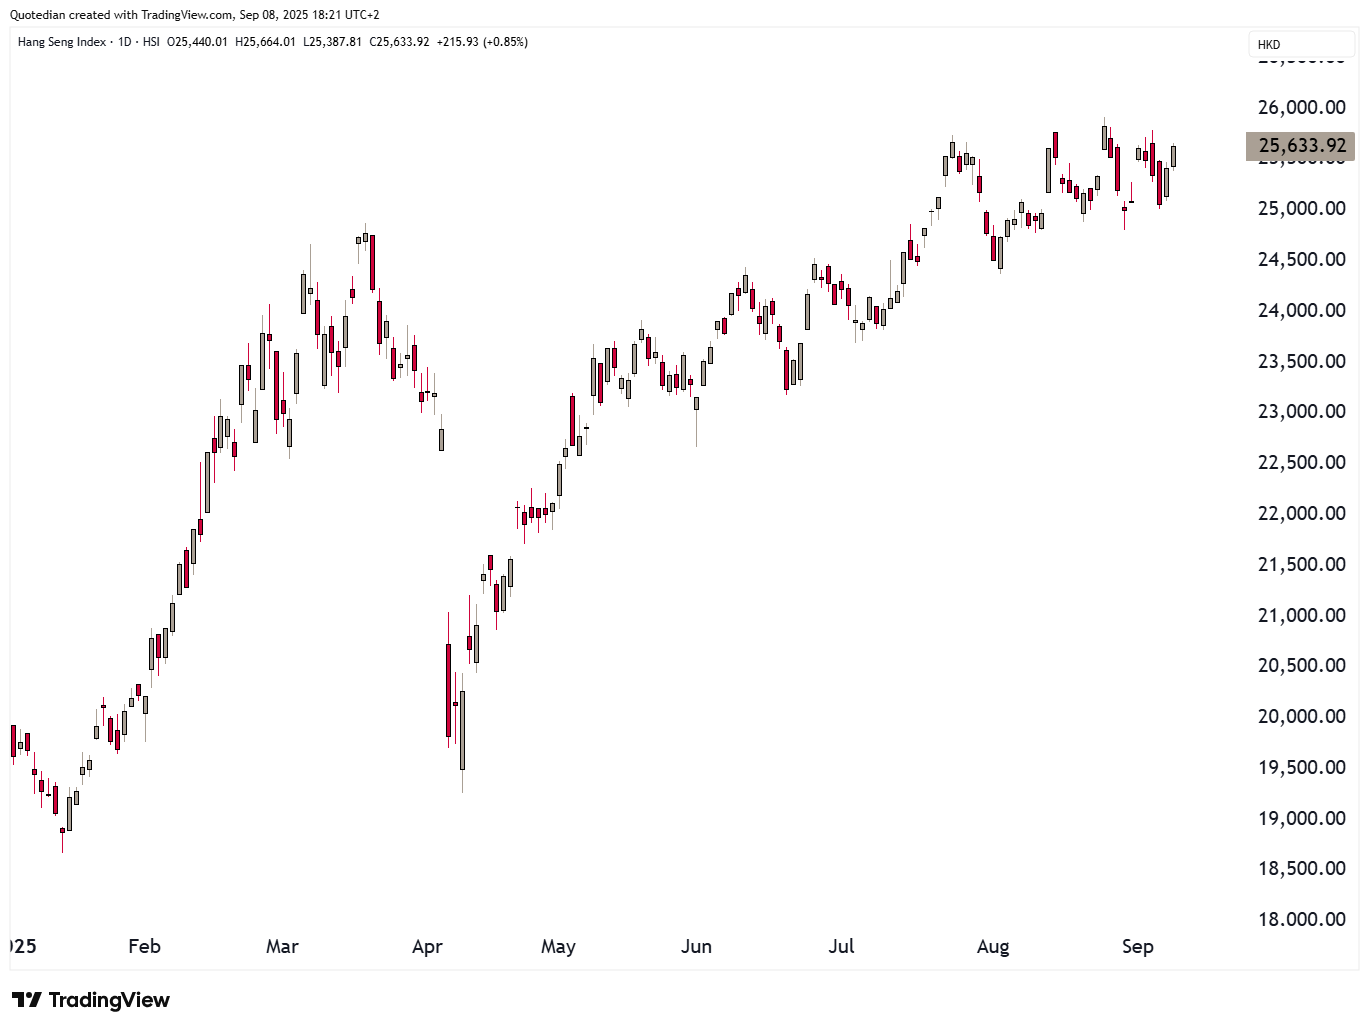
The Hong Kong (HSI) market also seems poised to advance to new cycle highs,
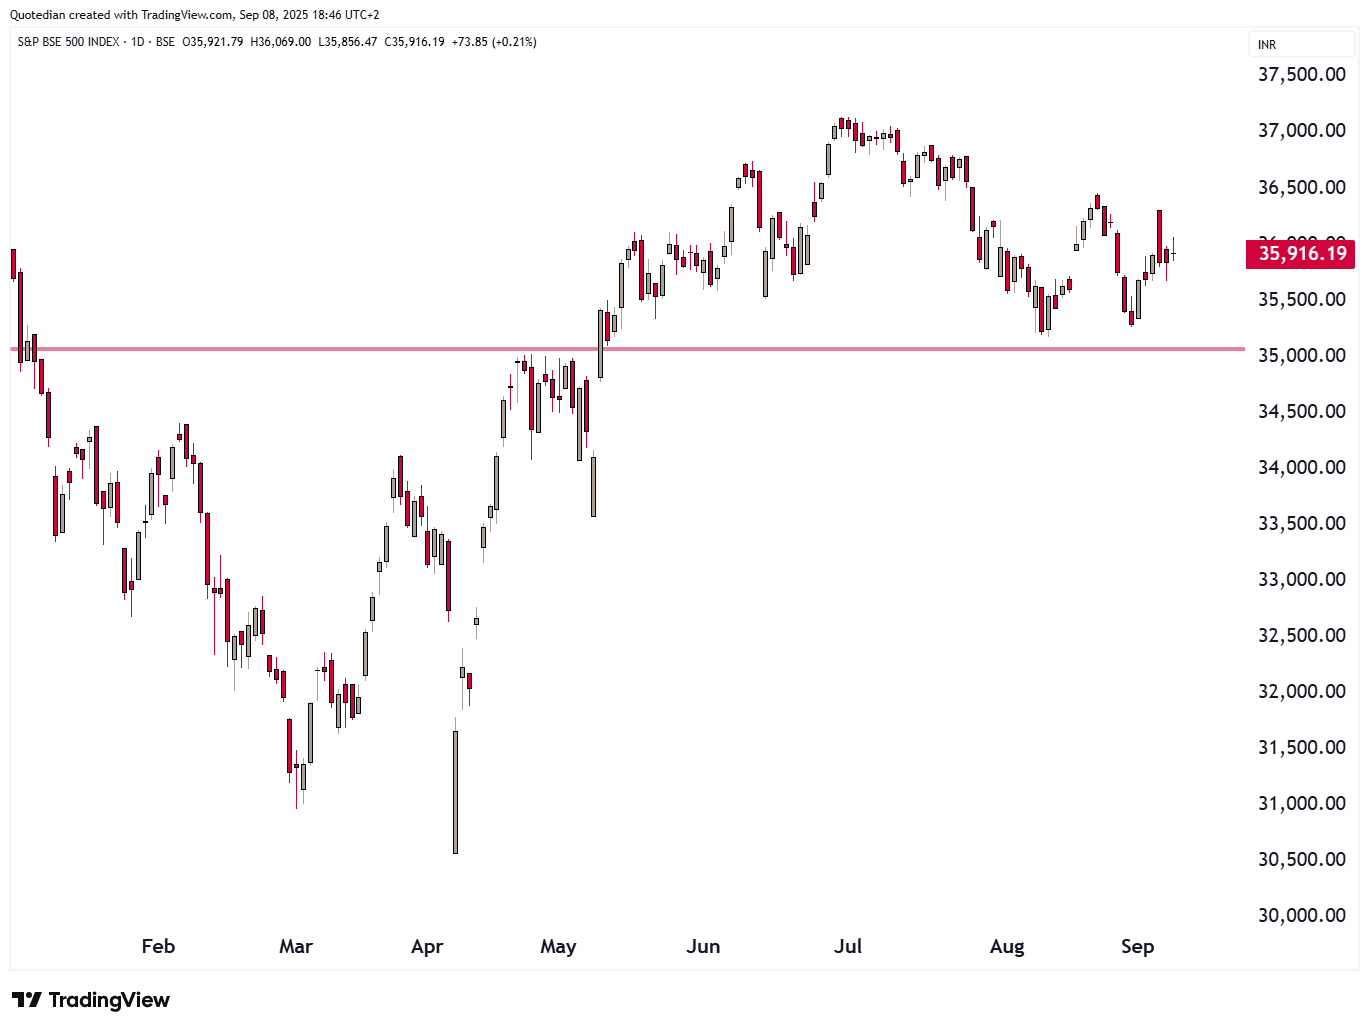
whilst the Indian equity market (BSE500 below) continues to chew on that 50% US tariff slap:
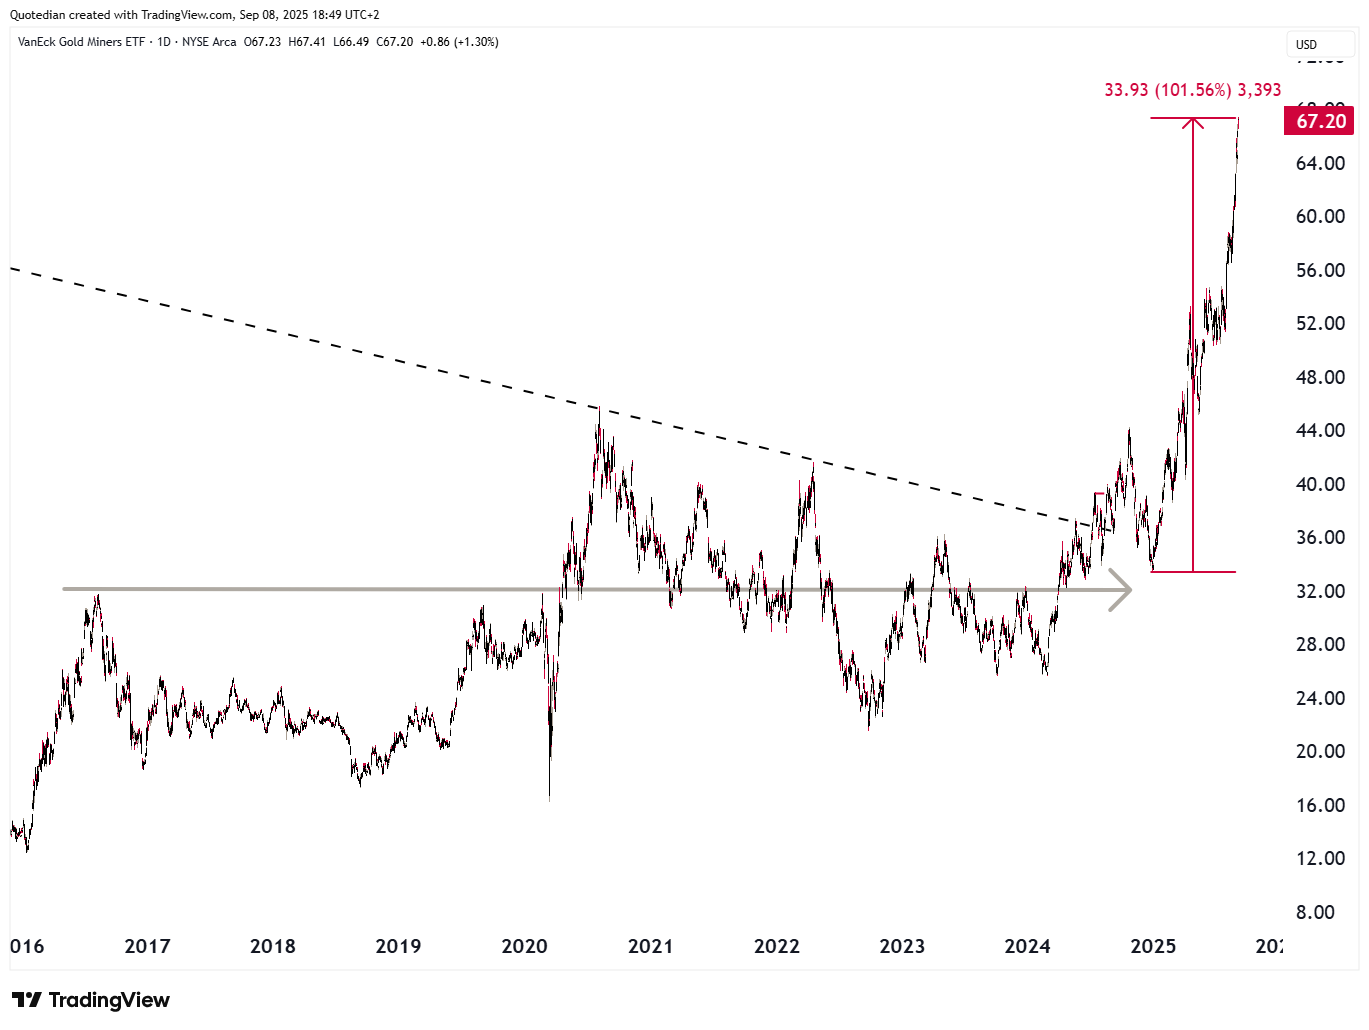
To finalize the equity section, a couple of charts of ‘things’ that have been working well lately.
Point in case, Gold mining stocks (GDX ETF). After not having worked for nearly a decade, they have now doubled in 2025 alone:
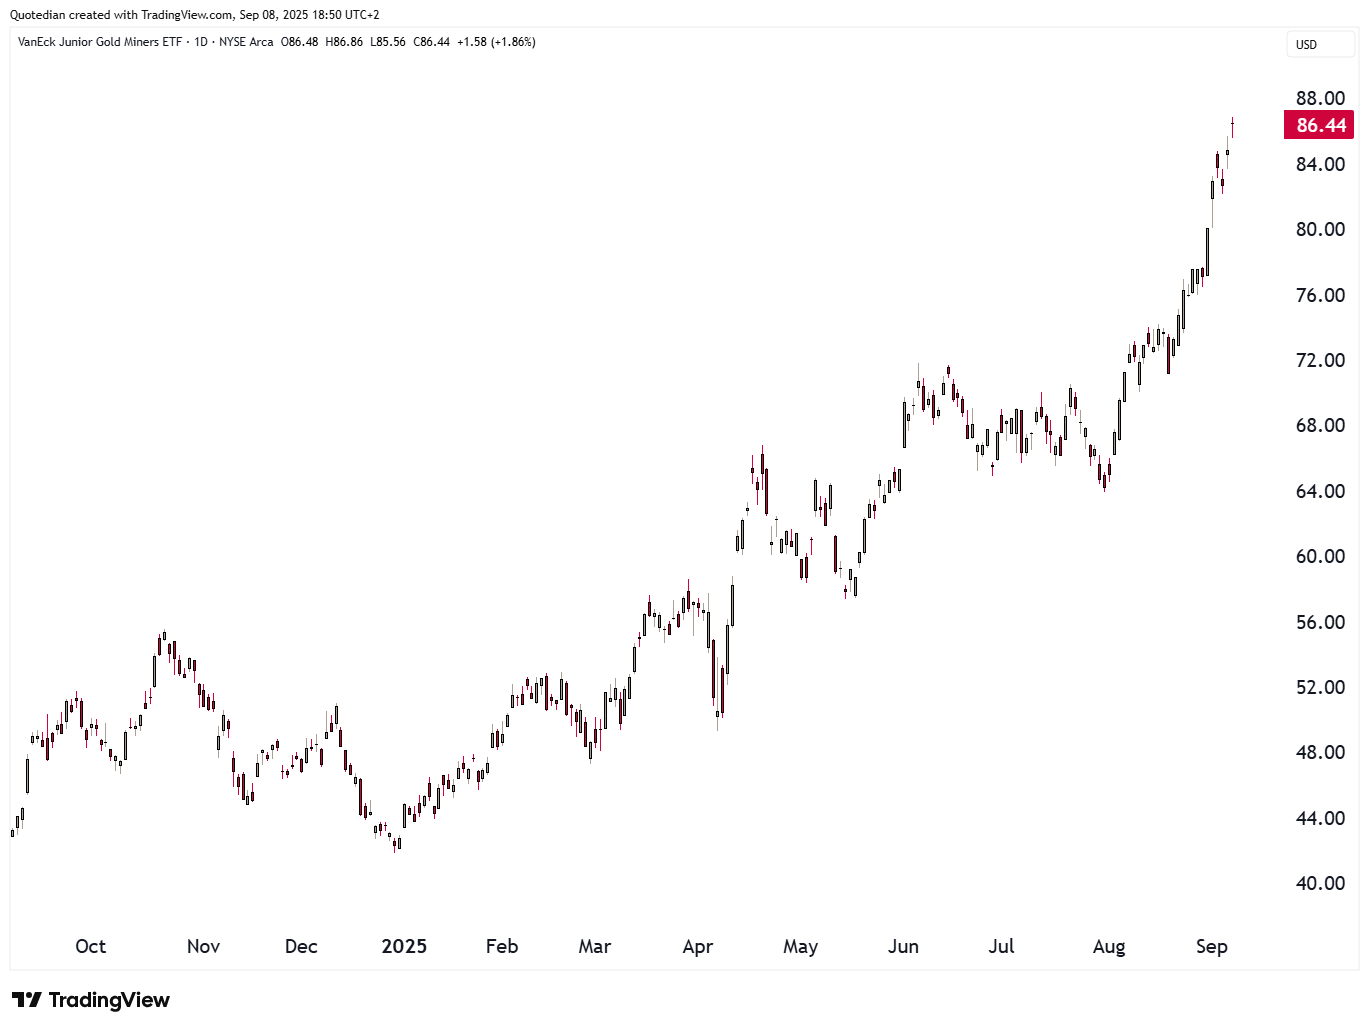
And Junior Miners (GDXJ) are also taking off:

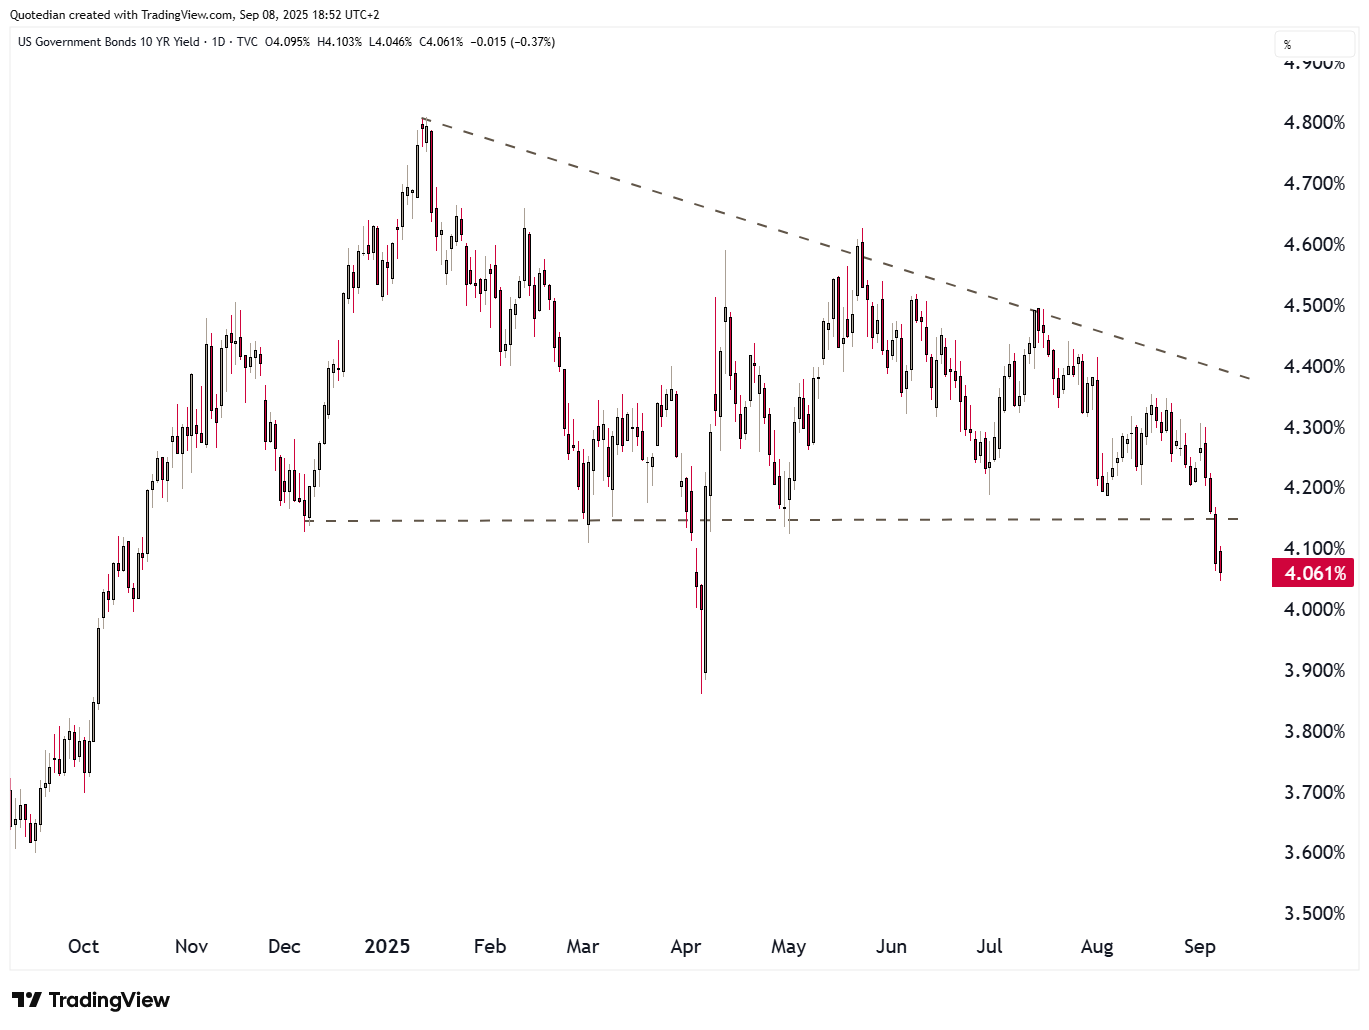
Bonds rallied in the US on Friday, after the week unemployment report in expectation of the upcoming cutting cycle. It looks like the Tens could drop below 4%:
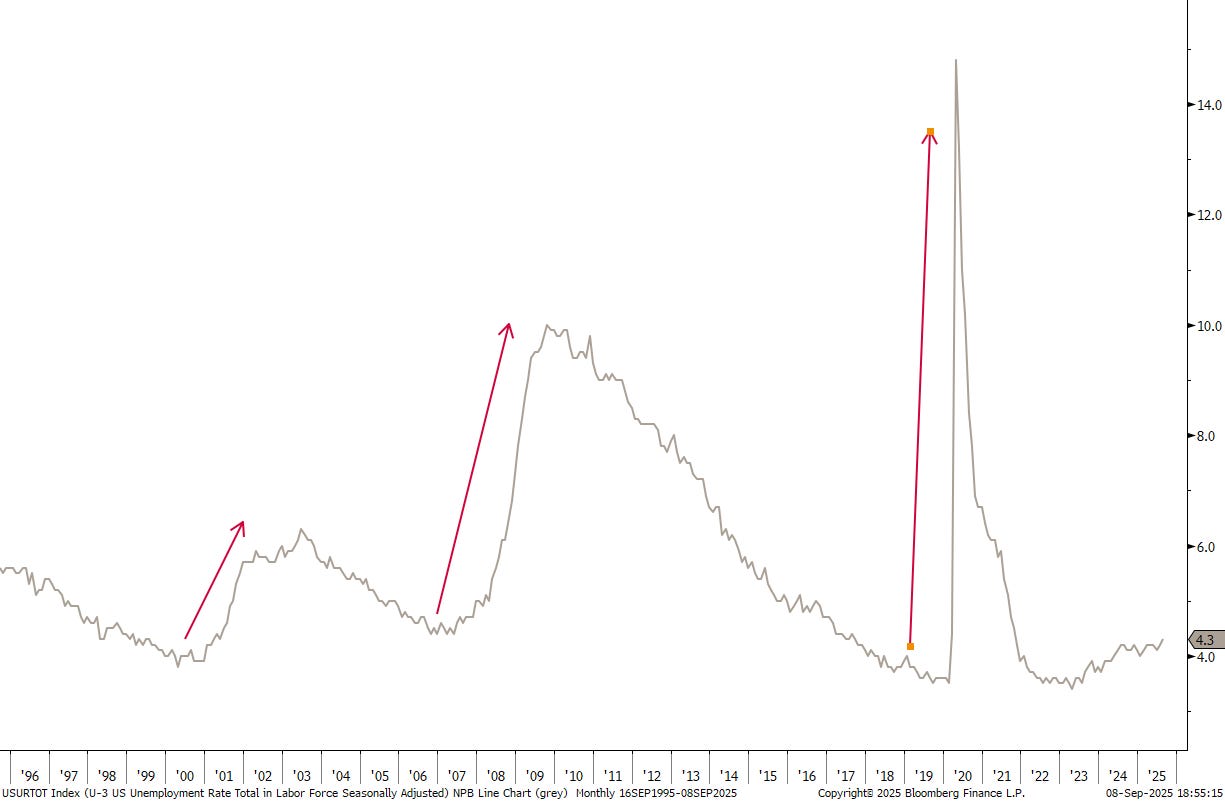
The pick-up in unemployment continues to glacial in comparison to other cycles:
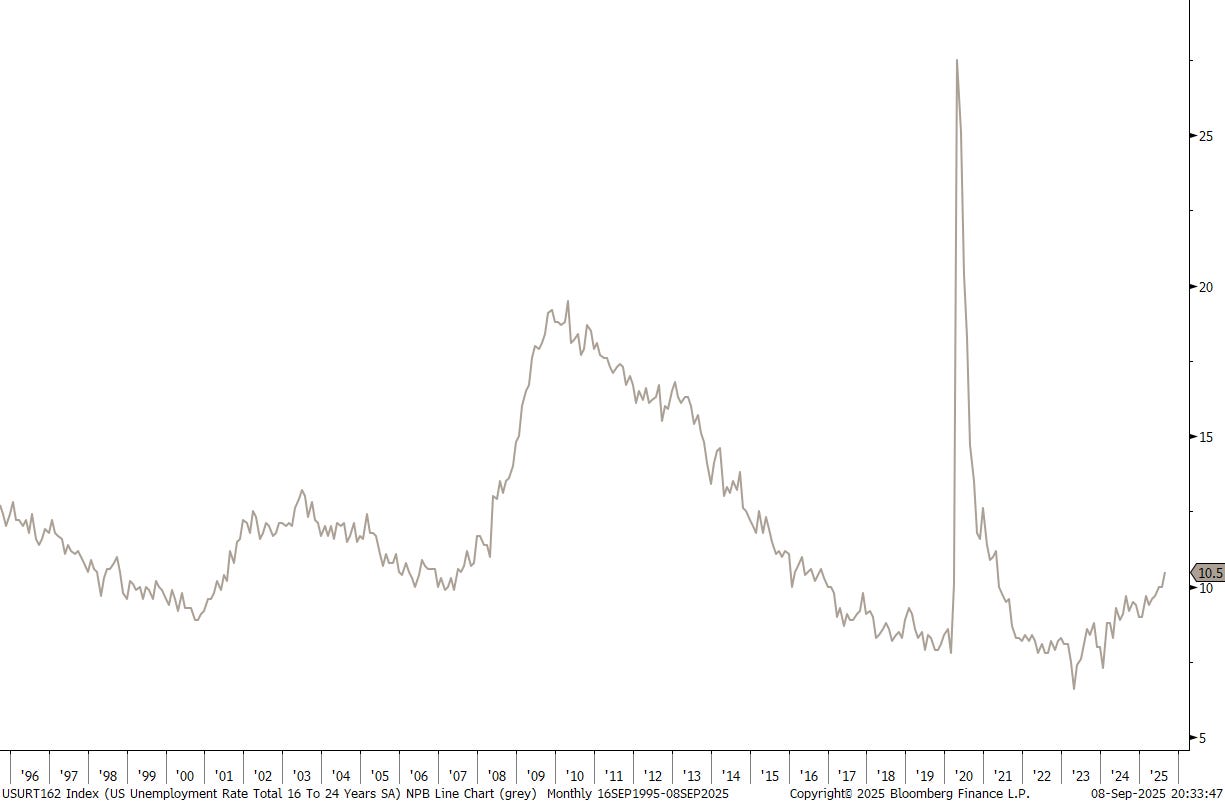
However, youth unemployment (16 to 24 years old) has been accelerating more rapidly:
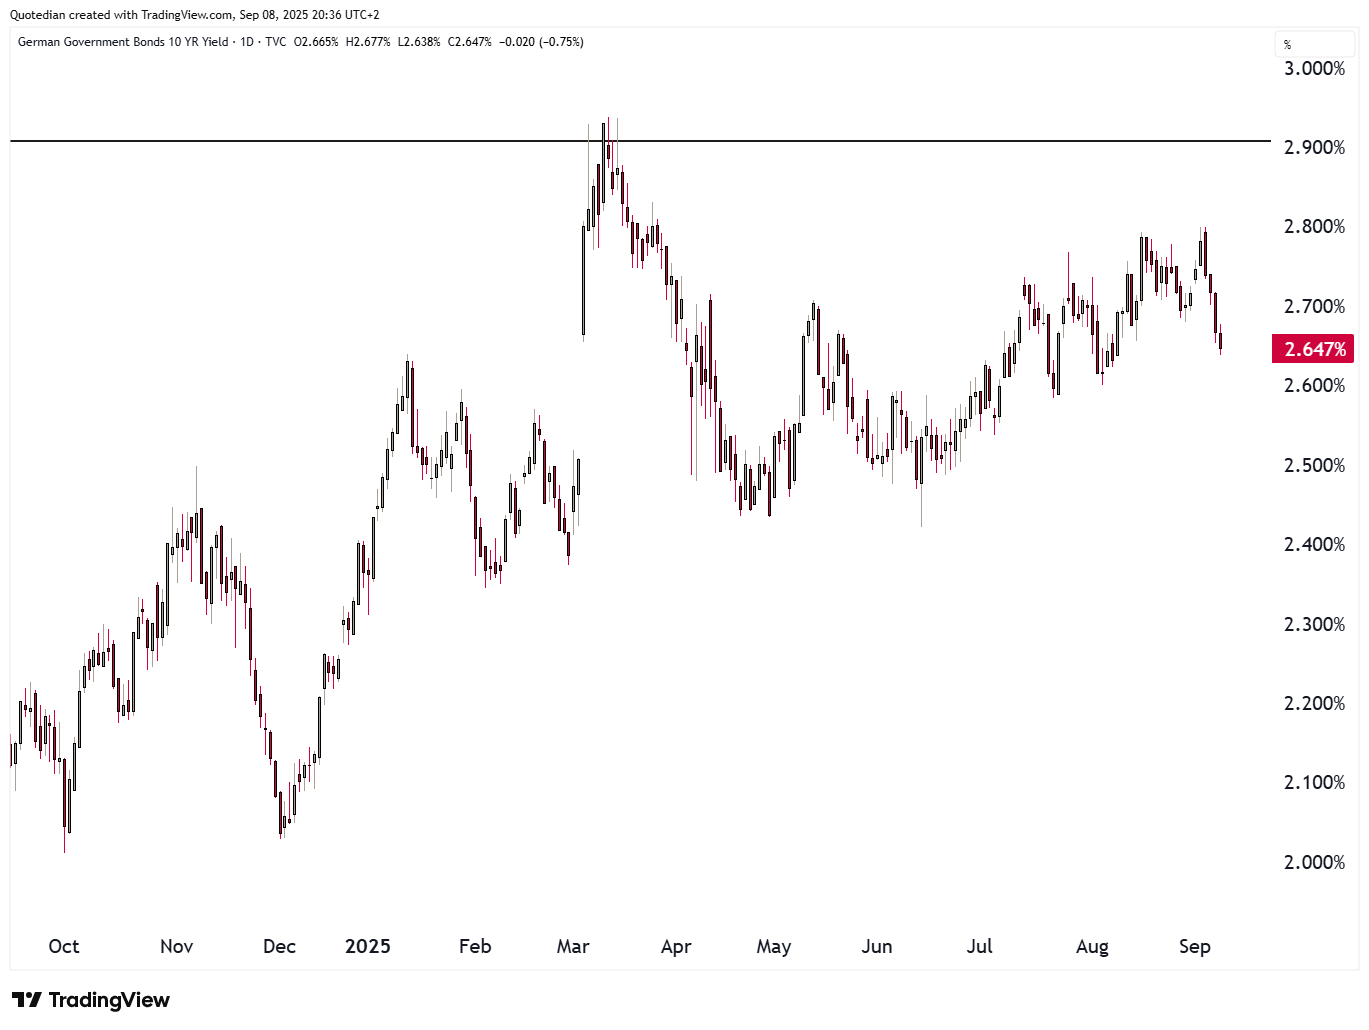
Rates in Europe have also turned lower, and not only in Germany,
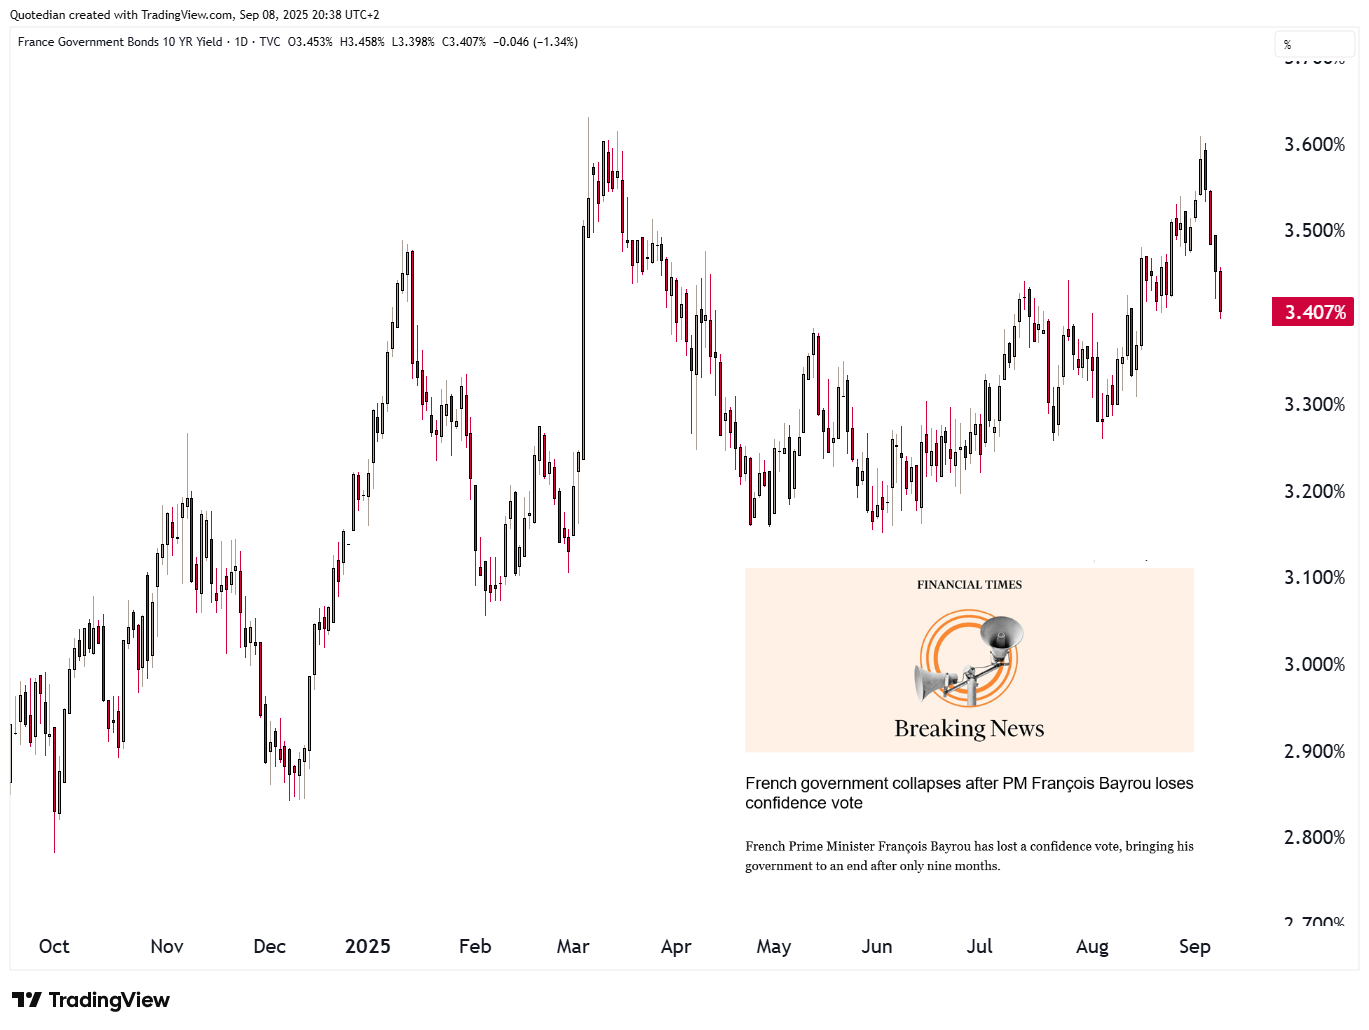
but even in France, despite the governments next shot in its own foot:
In Japan, the yield curve (30y-5y) continues to steepen,
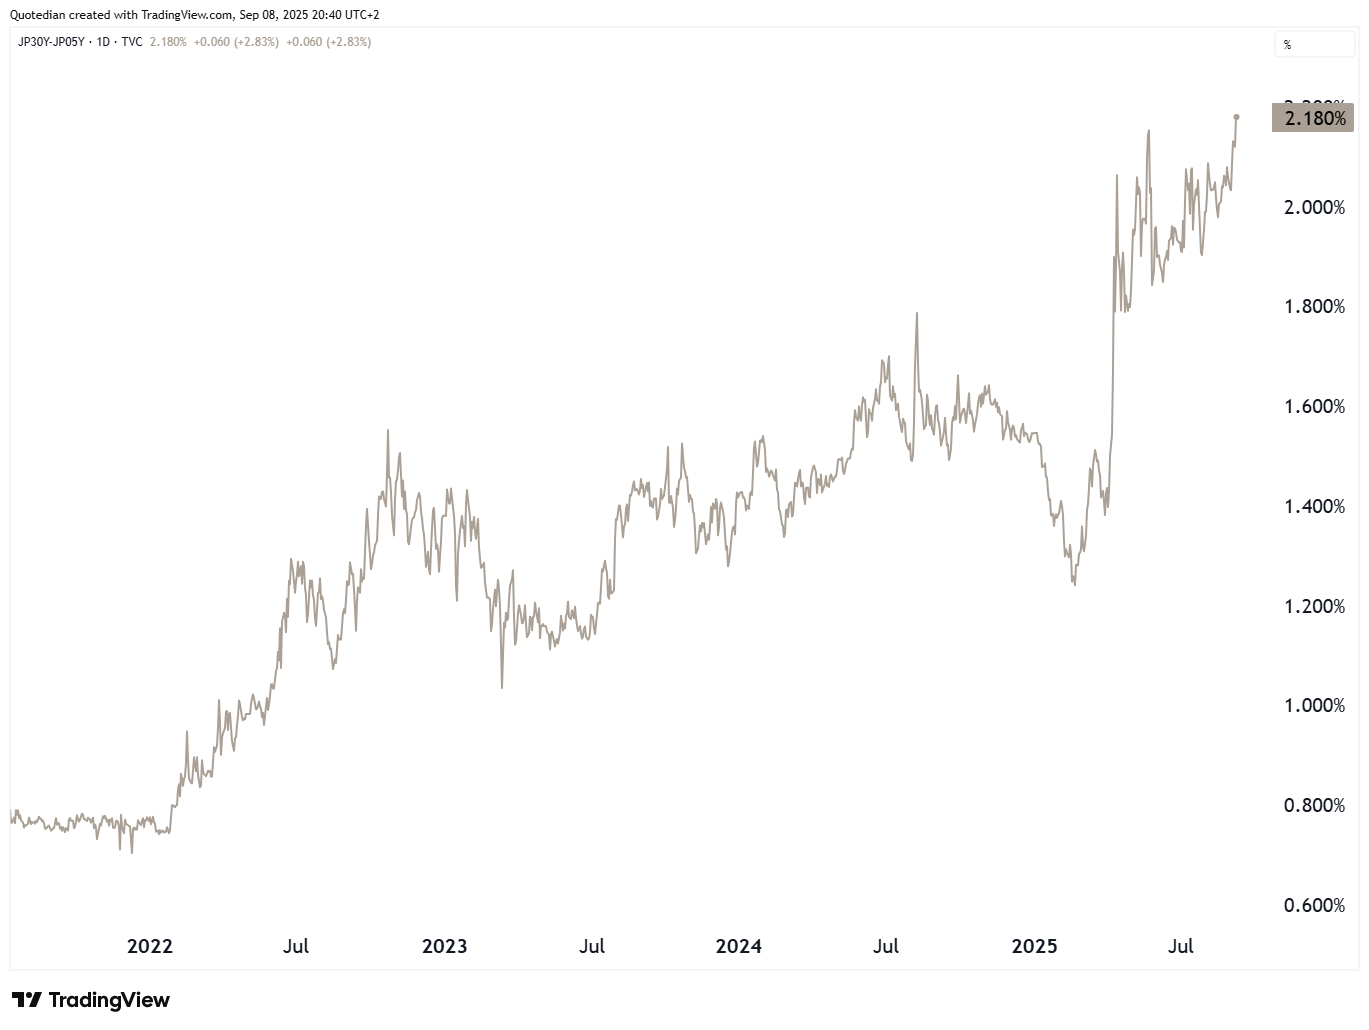
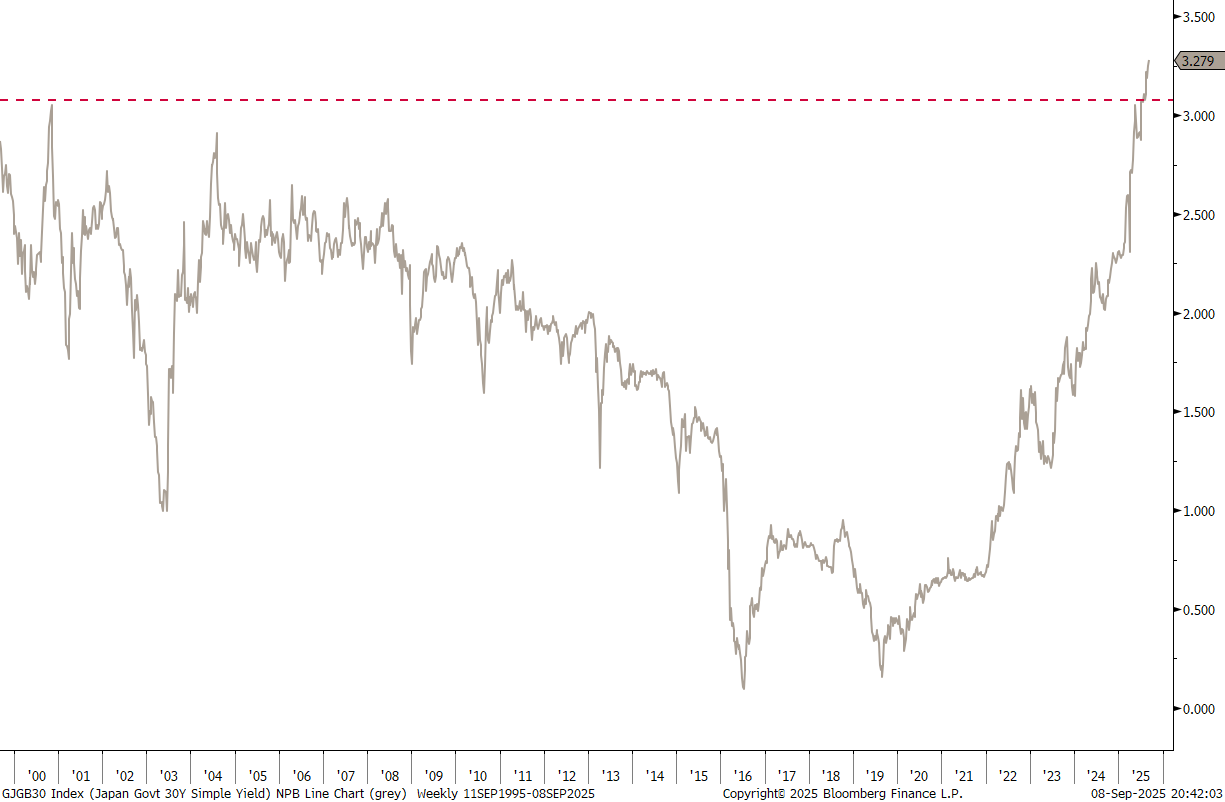
mainly due to a continued rise in 30-year yields,
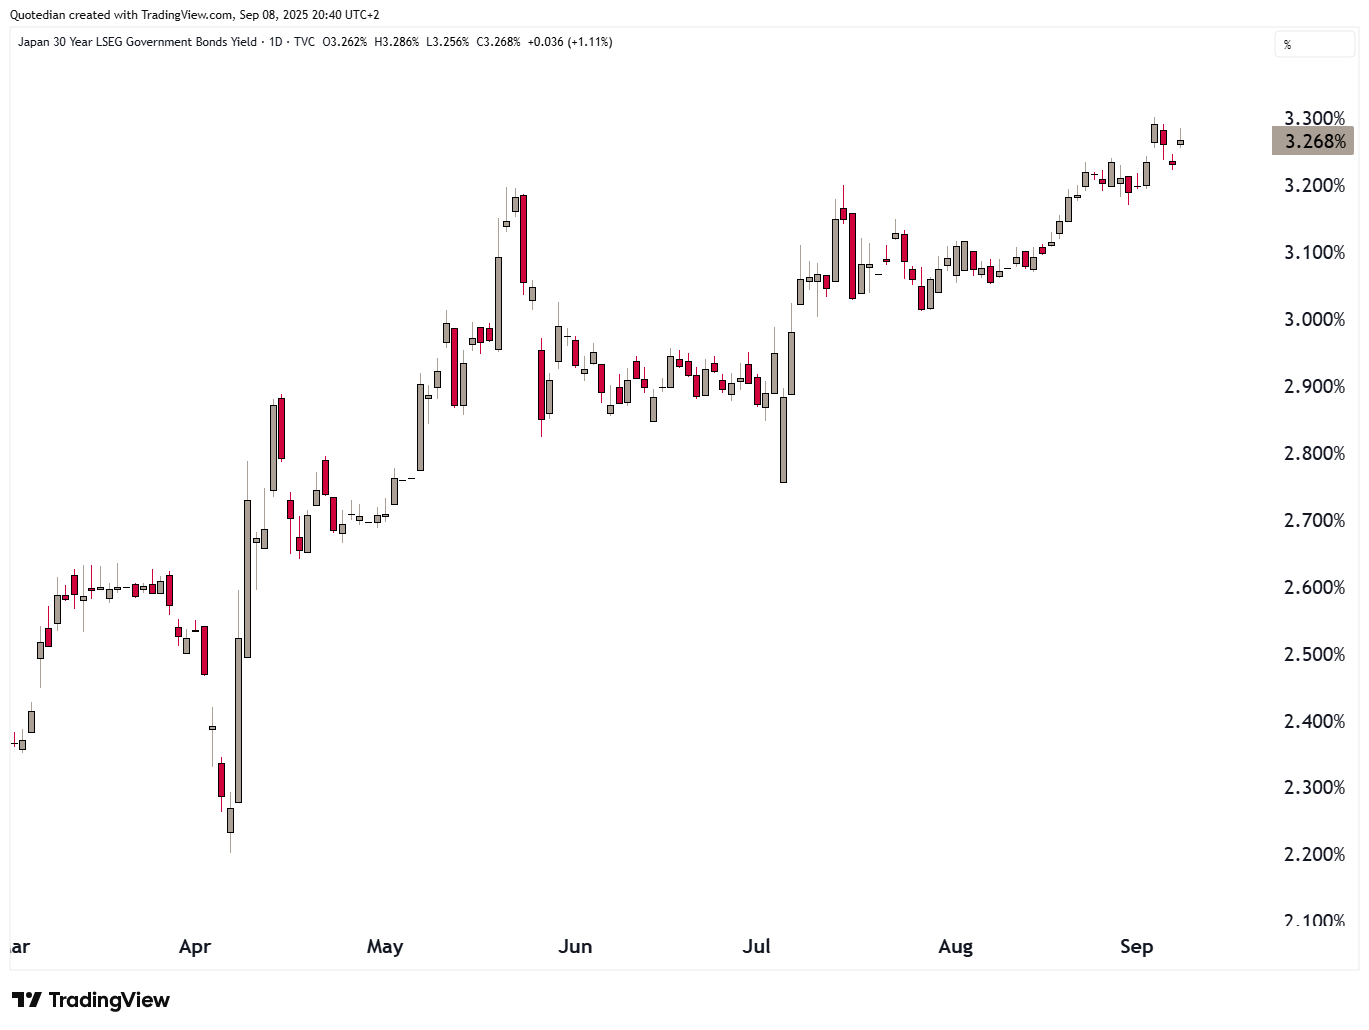
which are at their highest since the Bloomberg Terminal has data:
Back to the US fixed income market, one more chart which has many their head scratching. The red line is the 5-year, 5-year inflation swap rate, i.e. an expression of the market of 5-year inflation in 5-years time. The grey line is the nominal yield on the 5-year treasury bond:
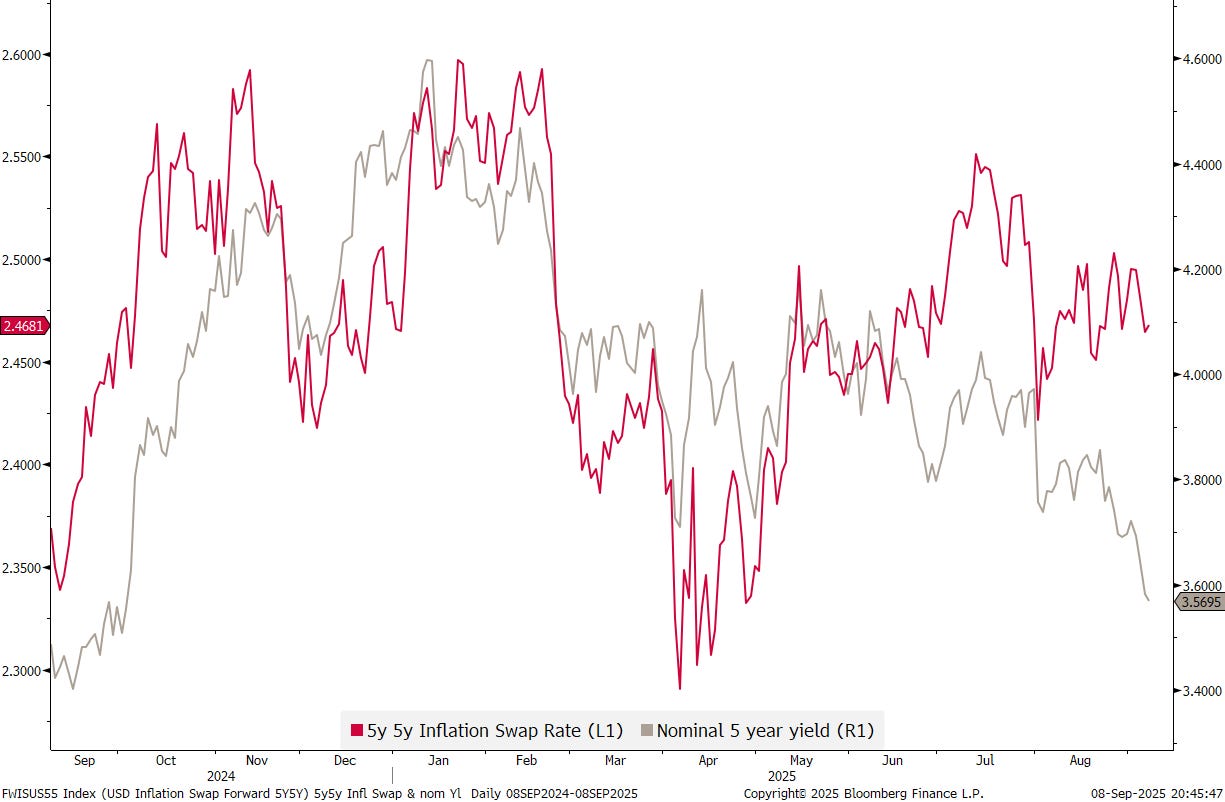
It will be fascinating to observer how this divergence between the two plays out.

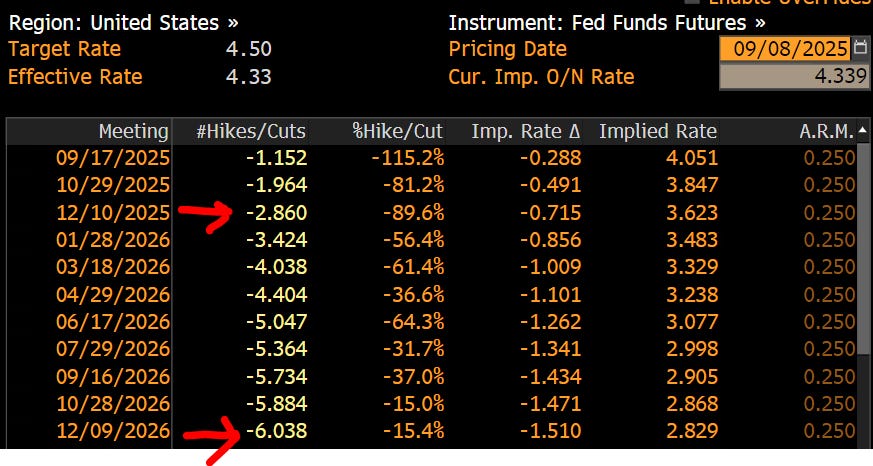
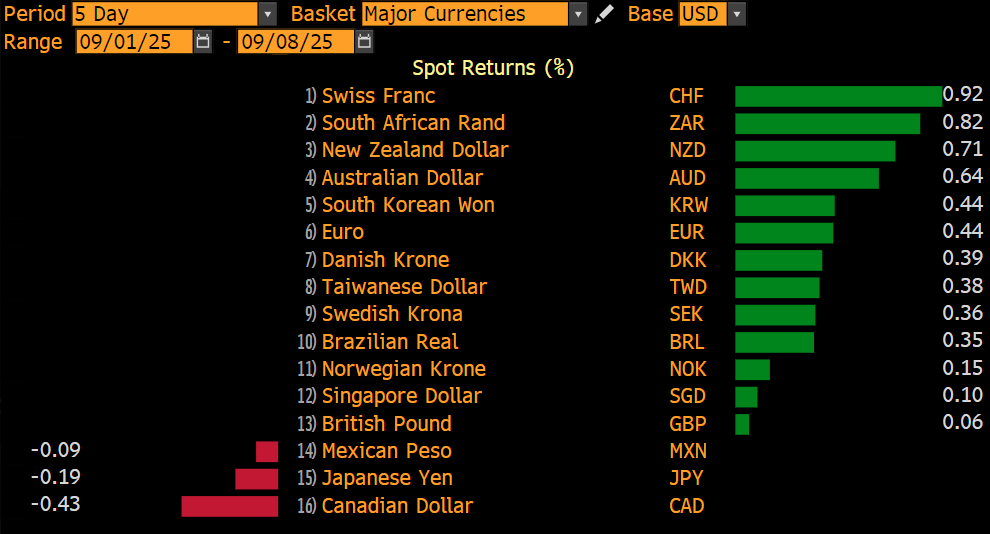
Given the increased likelihood of rate three FOMC rate cuts this year and another three next year after Powell’s white flag at Jackson Hole and last Friday'‘s NFP,
the Dollar has weakened against nearly everything again:
Of course, this Wednesday’s PPI and especially Thursday’s CPI number in the US could still change the Fed’s course.
As I have repeated “ad nauseum”, the CPI number is a deeply flawed number with a substantial lag. Housing (OER) is a much too large part of the measurement, whilst others, such as health insurance cost is not given enough importance. Here's a chart I put together for our Kairos pitchbook recently:
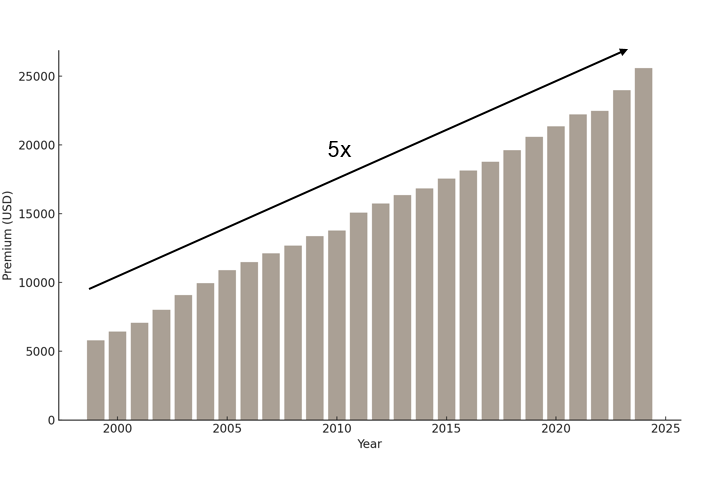
Now go and tell an American family that inflation has been benign over the past 25 years…
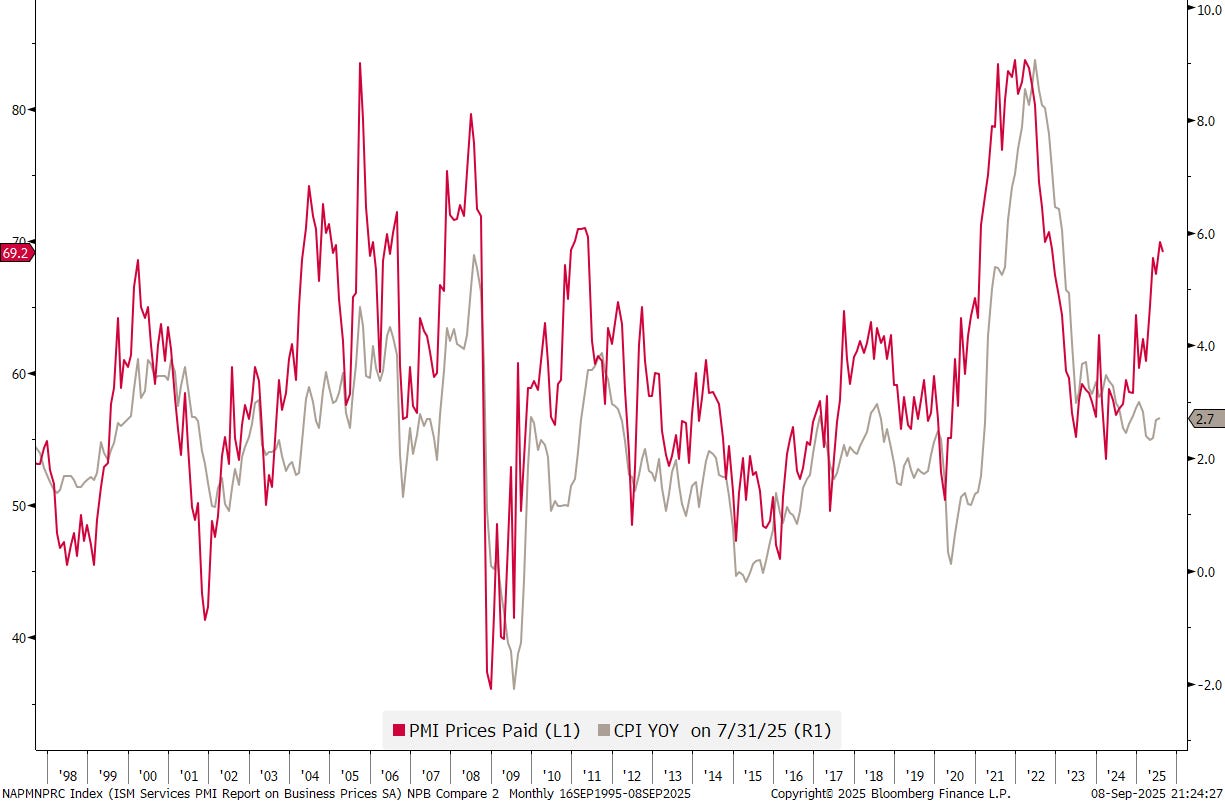
And then this … maybe Thursday's CPI number (grey) will surprise to the upside again, given that prices paid (red) has served well as a leading indicator in the past and is now a deep red warning light:
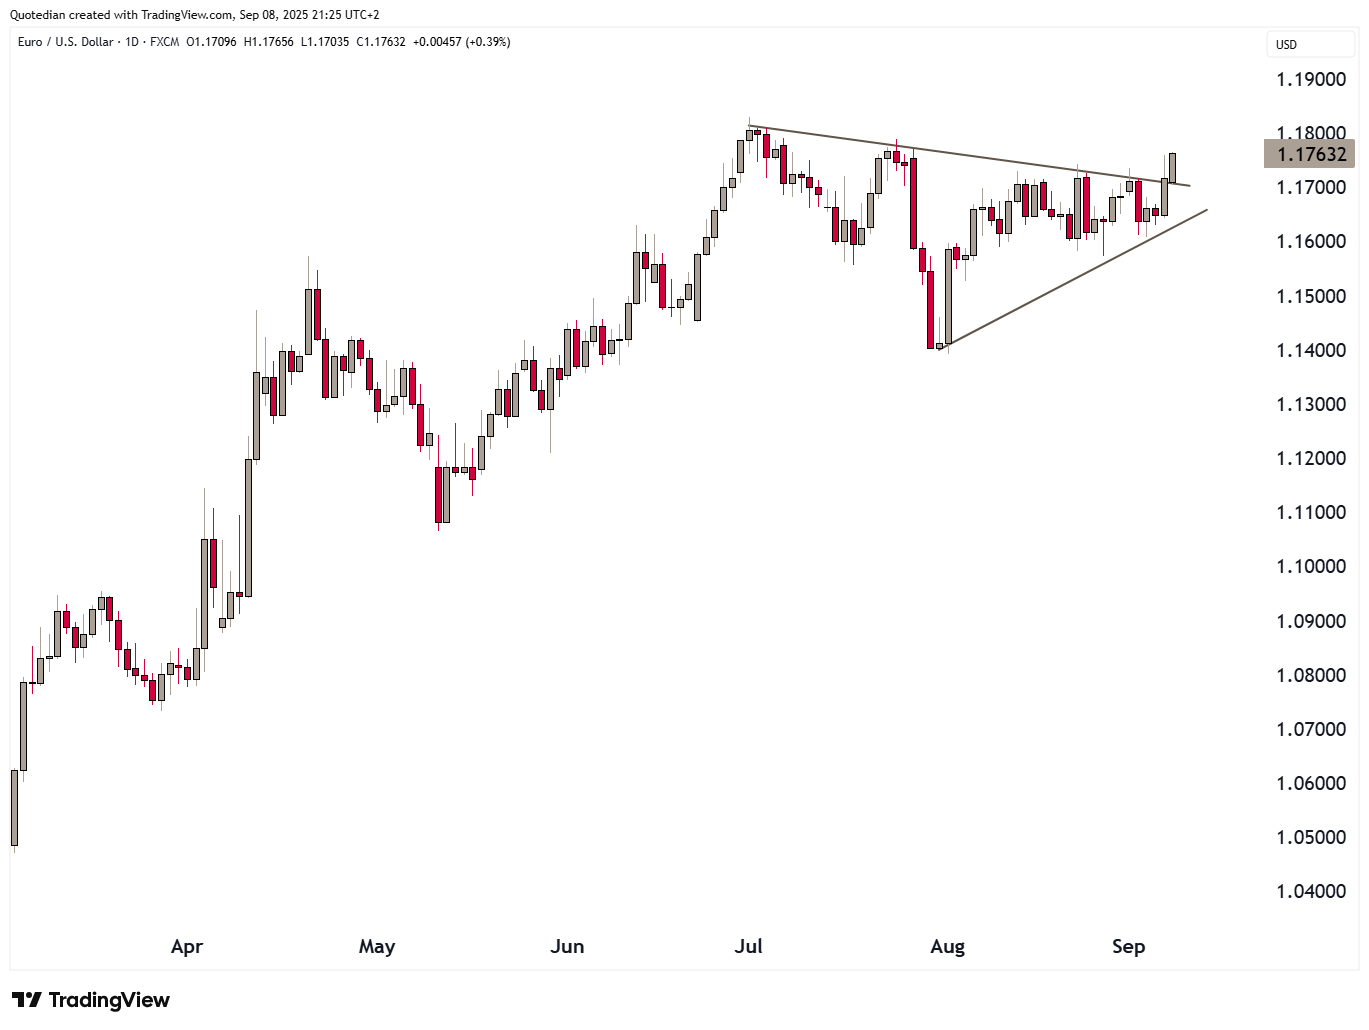
Such a surprise could of course trigger a US Dollar rally, but as mentioned last week, as long as the EUR/USUD stays above 1.1350 odds for a move above 1.20 remain elevated. Also, today’s break out of the triangle turns out the be a massive bull trap, but for now the assumption is that the Euro uptrend is in its next leg:
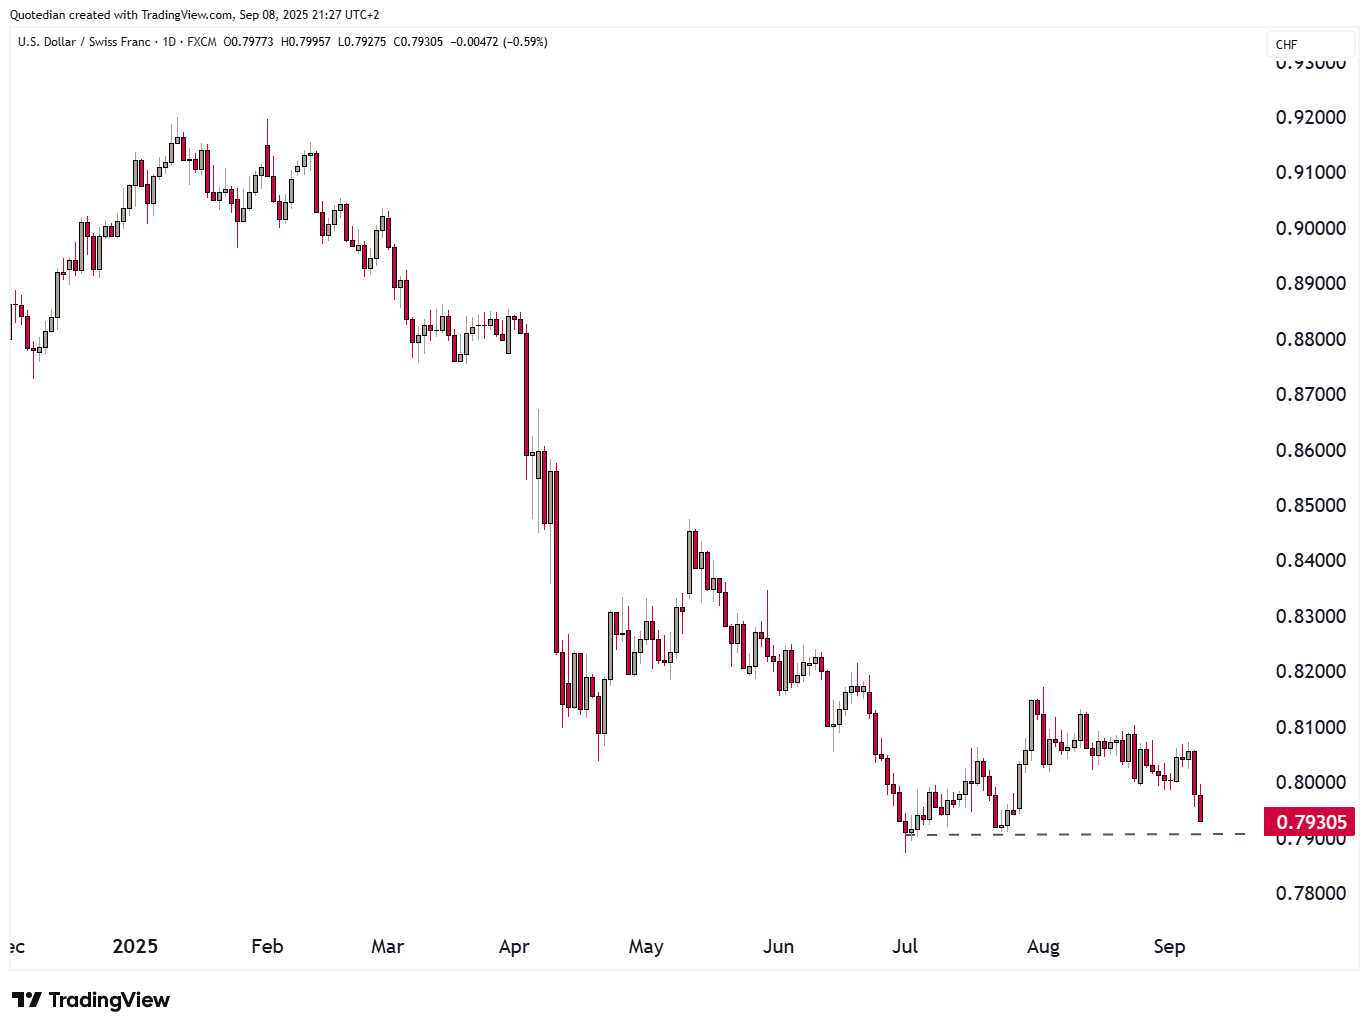
The USD/CHF cross is at danger of dropping to 0.75 and below:

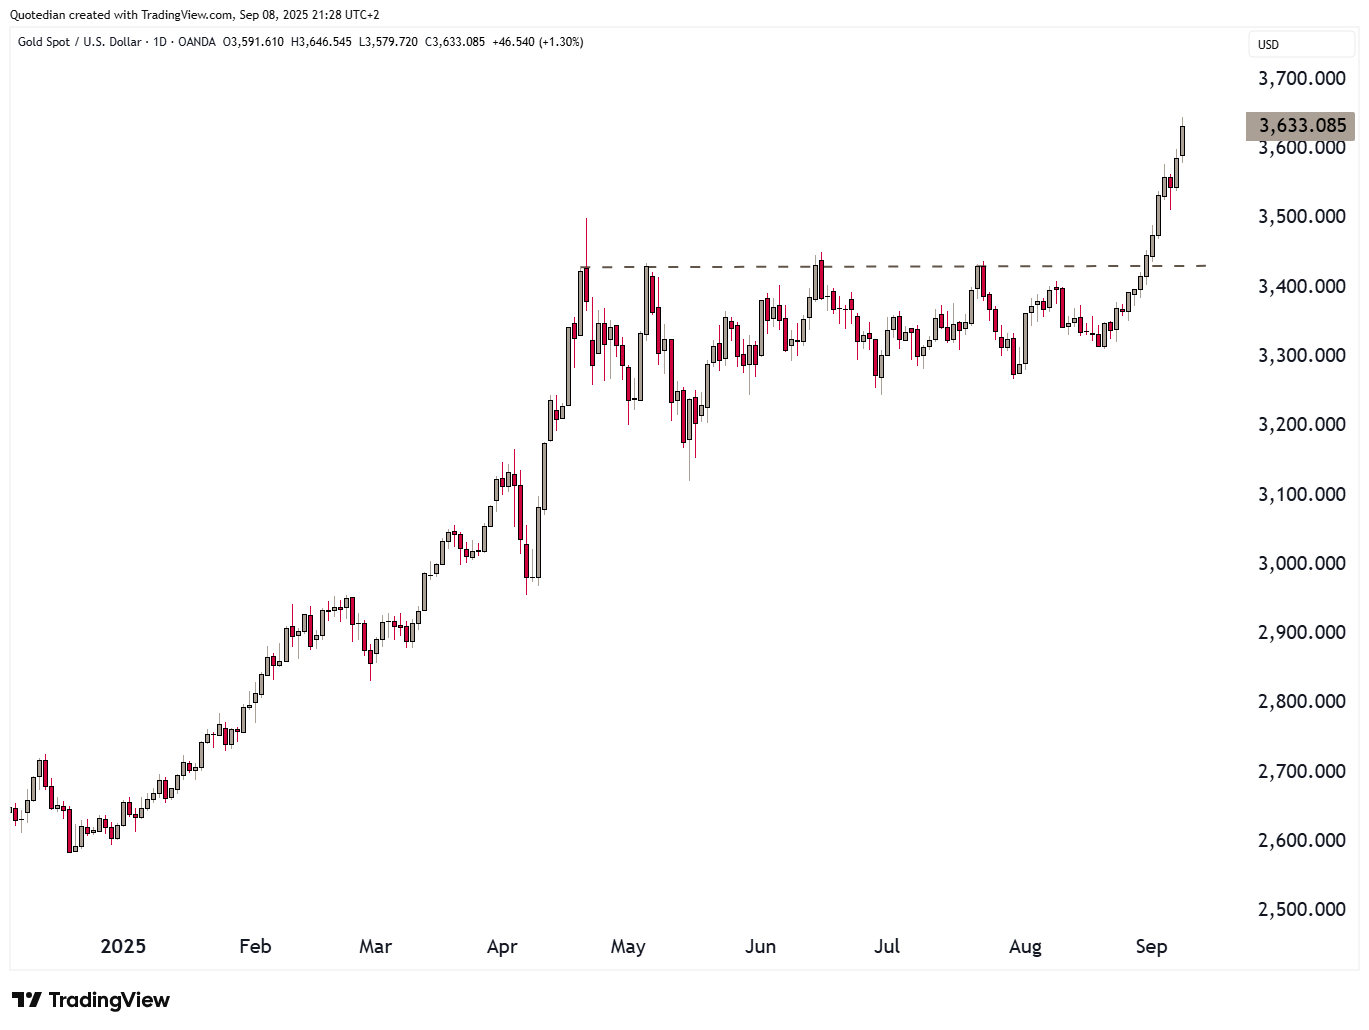
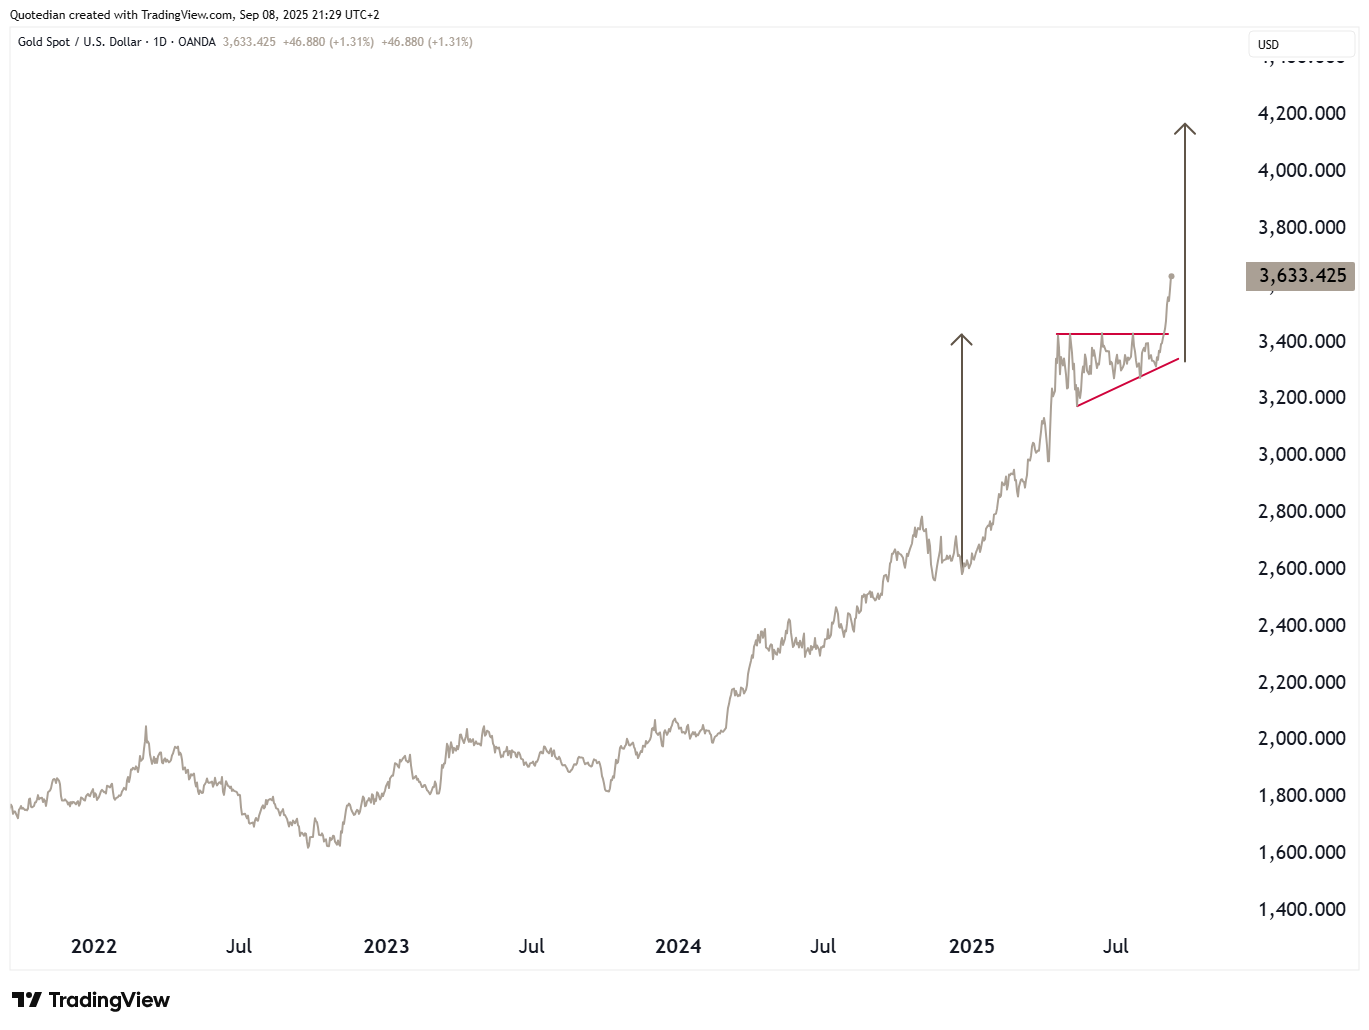
In the commodity space, all eyes are on Gold
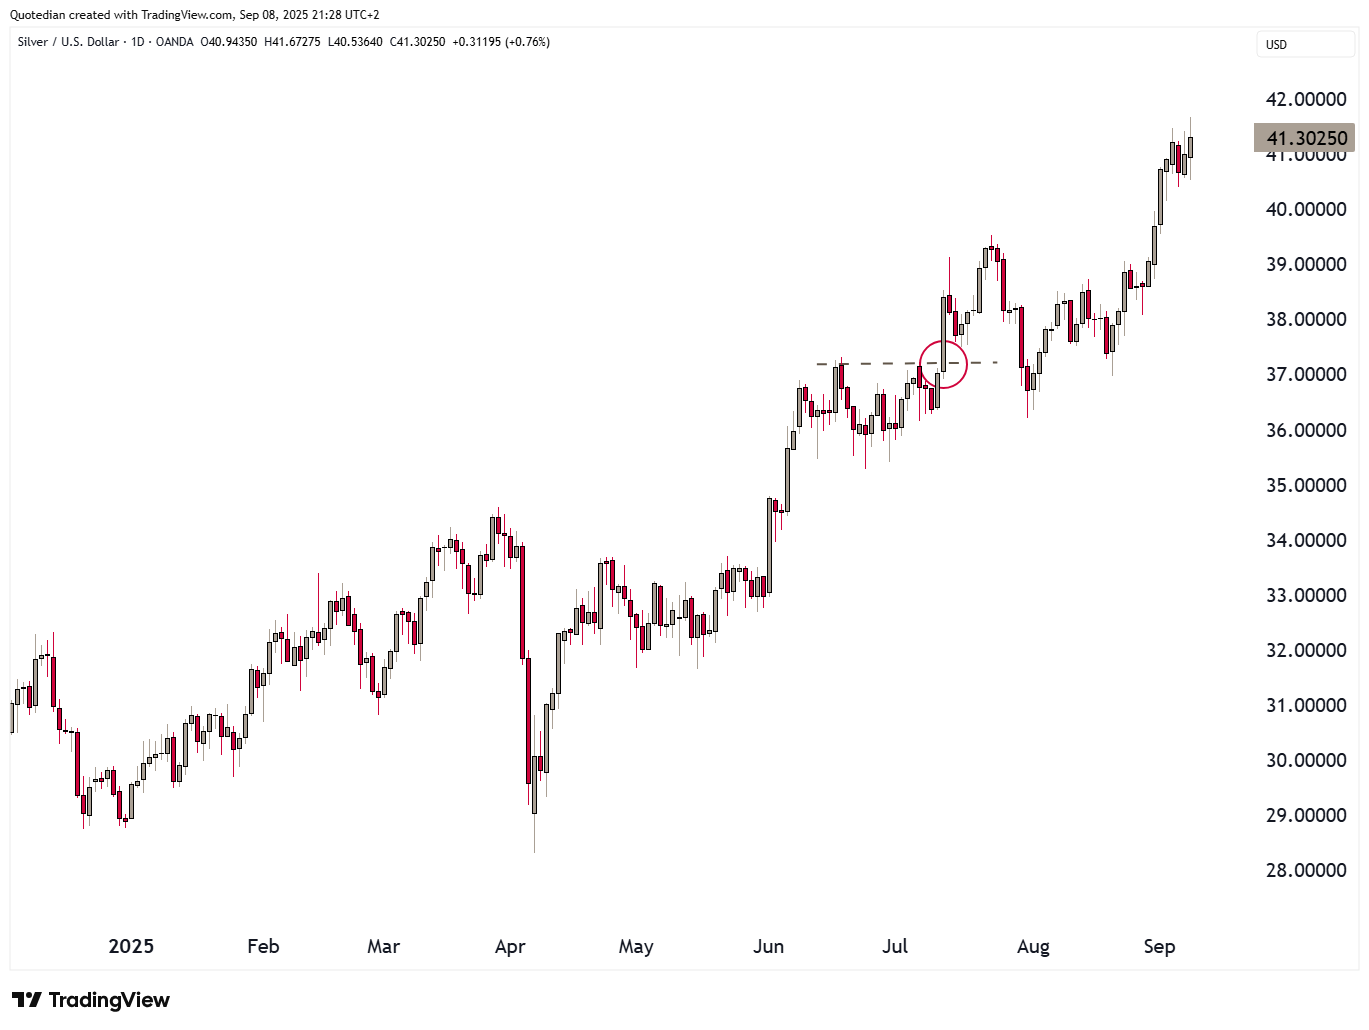
and Silver now:
For the yellow metal, our price target remains at $4,200:
Ok, with me being under a flu this Monday, that’s all I have energy for today. There will be QuiCQ (www.quicq.ch) updates later this week, so keep on the outlook.
And last but not least, I had the pleasure publishing an article in Saturday’s edition of Switzerland’s widest (German) read financial newspaper - the Finanz und Wirtschaft (FuW):
Have a great week!
André

In reality, you need no other Disclaimer than the one above, but just in case:
Everything in this document is for educational purposes only (FEPO)
Nothing in this document should be considered investment advice
Investing real money can be costly; don’t do stupid shit
Leave politics at the door—markets don’t care.
Past performance is hopefully no indication of future performance
The views expressed in this document may differ from the views published by Neue Private Bank AG