Wall of Worry?
The Quotedian - Vol V, Issue 153
"Never bet on the end of the world, It only happens once."
— Art Cashin
DASHBOARD
AGENDA
CROSS-ASSET DELIBERATIONS
Have markets started climbing the proverbial Wall of Worry? Well, it is a bloody tall wall, with some very slippery stones to surpass close by. Those stones include big tech earnings this week, ECB monetary policy meeting on Thursday, FOMC meeting Wednesday in a week and US mid-term elections on November 8th to name but a few… formidable!
But … stocks on Wall Street headed higher for a second consecutive day, further improving the roadmap we have been discussing over the past few Qs (that stands officially for The Quotedian now):
The move yesterday confirmed the break of (2), which we needed as Friday’s move may have been exacerbated by OpEx, and we are now just below (3). Again, the whole technical picture (also remember price/momentum divergence) suddenly looks much more constructive, with stocks up now around 9% since the October 13th CPI low and sentiment readings are still negative enough to provide further (contrarian) tailwind.
Breadth during yesterday’s rally was also very constructive once again, with the advancing-to-decliningn stock ratio at about four to one. Nine out of eleven sectors ended the day higher:
Interesting here is that two traditionally more defensive sectors were the day’s winners. In any case, the session left us with a very green market carpet:
Quickly two European equity charts:
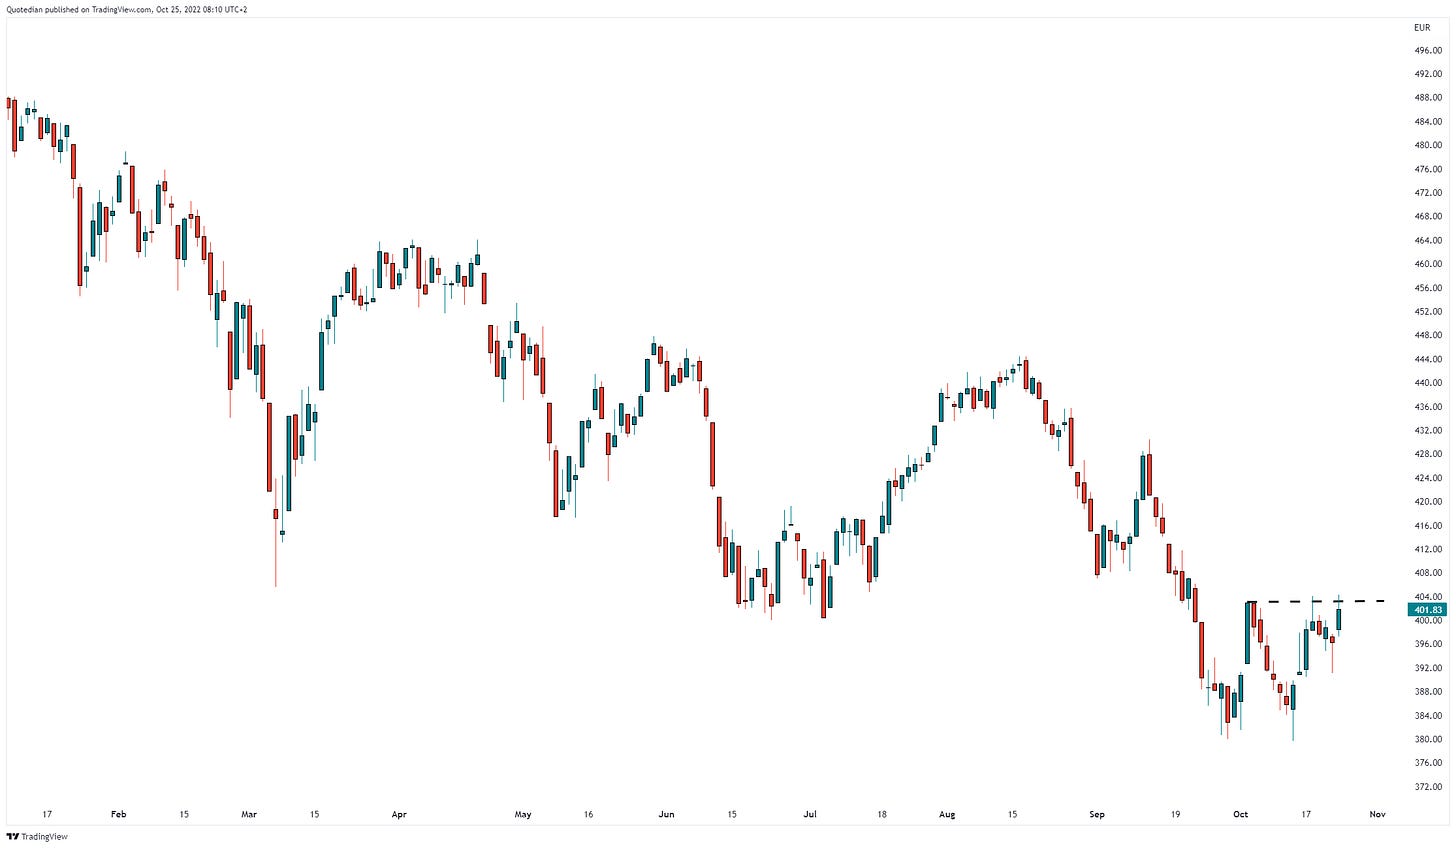
The broad STOXX Europe 600 index (which includes Swiss and UK stocks amongst others) has arrived at a similar short-term resistance as we observed on the S&P 500:
The less broad, but very popular Euro Stoxx 50 index however has seemingly already overcome that resistance:
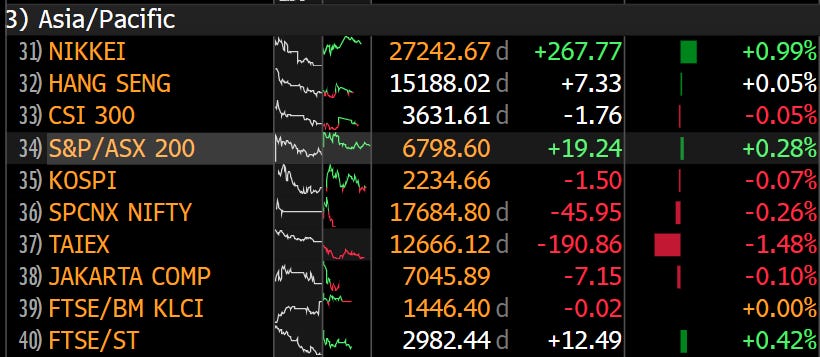
Which brings us to today’s Asian equity session, which is overall positive on the day, albeit very fragmented across the entire region. The following table probably gives you a good idea regarding the “diversity” of returns today:
But, of course, is the talk of the town, the big sell-off in many Chinese (incl. HK) indices on Monday upon the conclusion of the Communist Party’s congress and Xi’s cementing of his own power.
I am in no position to analyse or even understand the longer-term implications of this week-long congress, but I do see that the market didn’t like it. Some examples …
The MSCI China Index in local currency is at its lowest since 2016 and holding at these levels seems important from a technical point of view:
Admittedly, from a valuation (P/E) point of view, if you do not buy now, when will you?
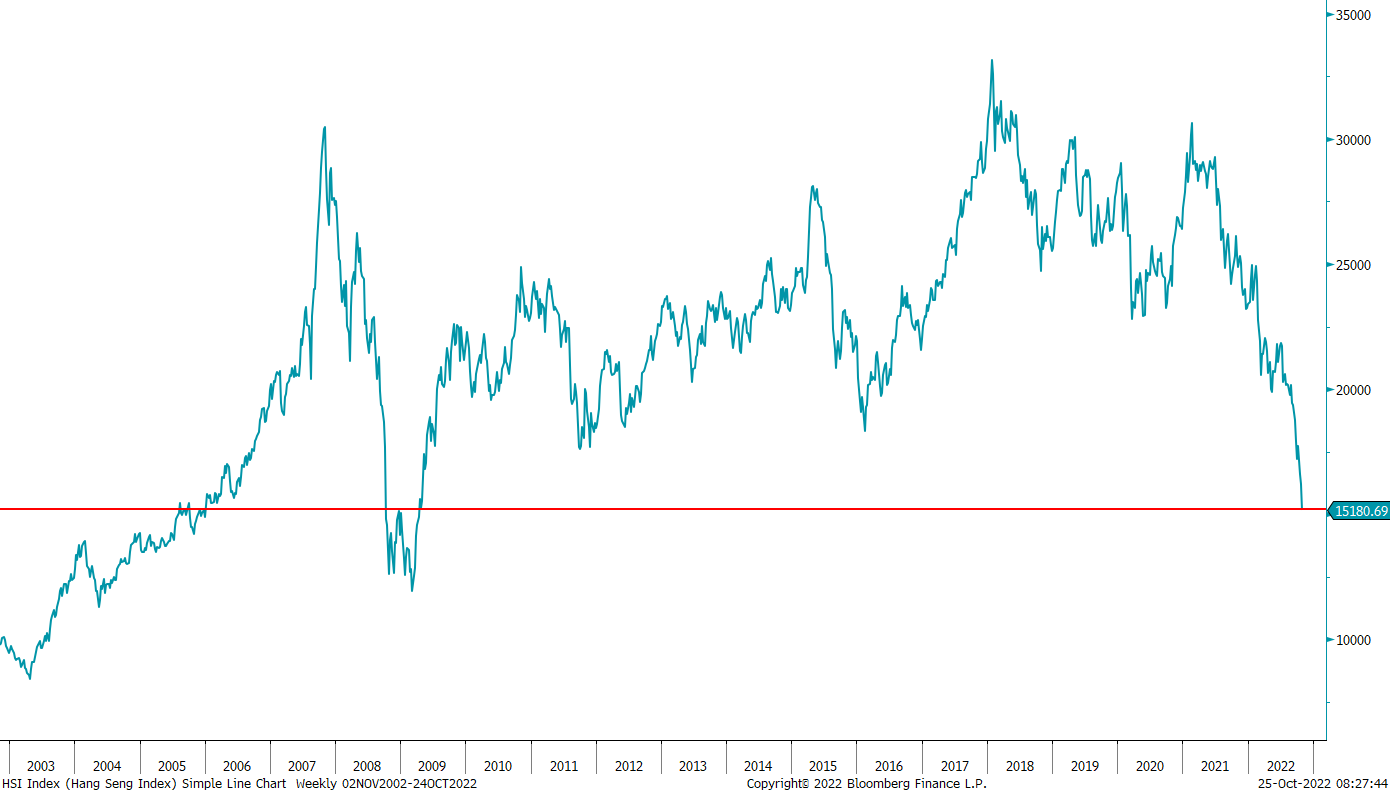
Over in Hong Kong, things look even worse:
Or better, depending on what lens you use:
But the biggest one-day hit came for Chinese stocks trading in the US, where the NASDAQ Gold Dragon China Index, dropped over 14% on the day:
International investors fleeing Chinese assets? You bet!
Moving on to fixed income market, we find partial explanation for the newly found equity ‘strength’ in the form of global bond yields which at a minimum have halted their parabolic ascent (for now).
US yields continue to have one of the best momentum pictures, but have also stalled for the past three sessions:
German Bunds have definitely started a consolidation, the question is will it have the depth of (I) or (II):
Don’t forget - ECB meeting in 48 hours!
And finally, the largest (yield) reversal is being observed on UK Gilts, where the election of a Goldman Sachs boy seems to be soothing investors’ nerves (it worked for Europe with Draghi… well, kind of at least):
And one more final chart for the fixed income section … even though I absolutely hate to commit chart crime (in this case, the use of two different y-axes), the following picture is still quite telling. It compares credit spreads (iTRAXX Xover - green line) to European equity volatility (V2X) and shows a big mismatch between the two:
The question of course is do stocks still need to fall dramatically (to elevate vola) or is there a genuine opportunity in buying European corporate bonds? For the answer, stay tuned … 😈
In currency markets, the US Dollar Index moved right into that all-decisive apex I mentioned last week and then … decided to completely ignore it:
Egg and face suddenly come to mind …
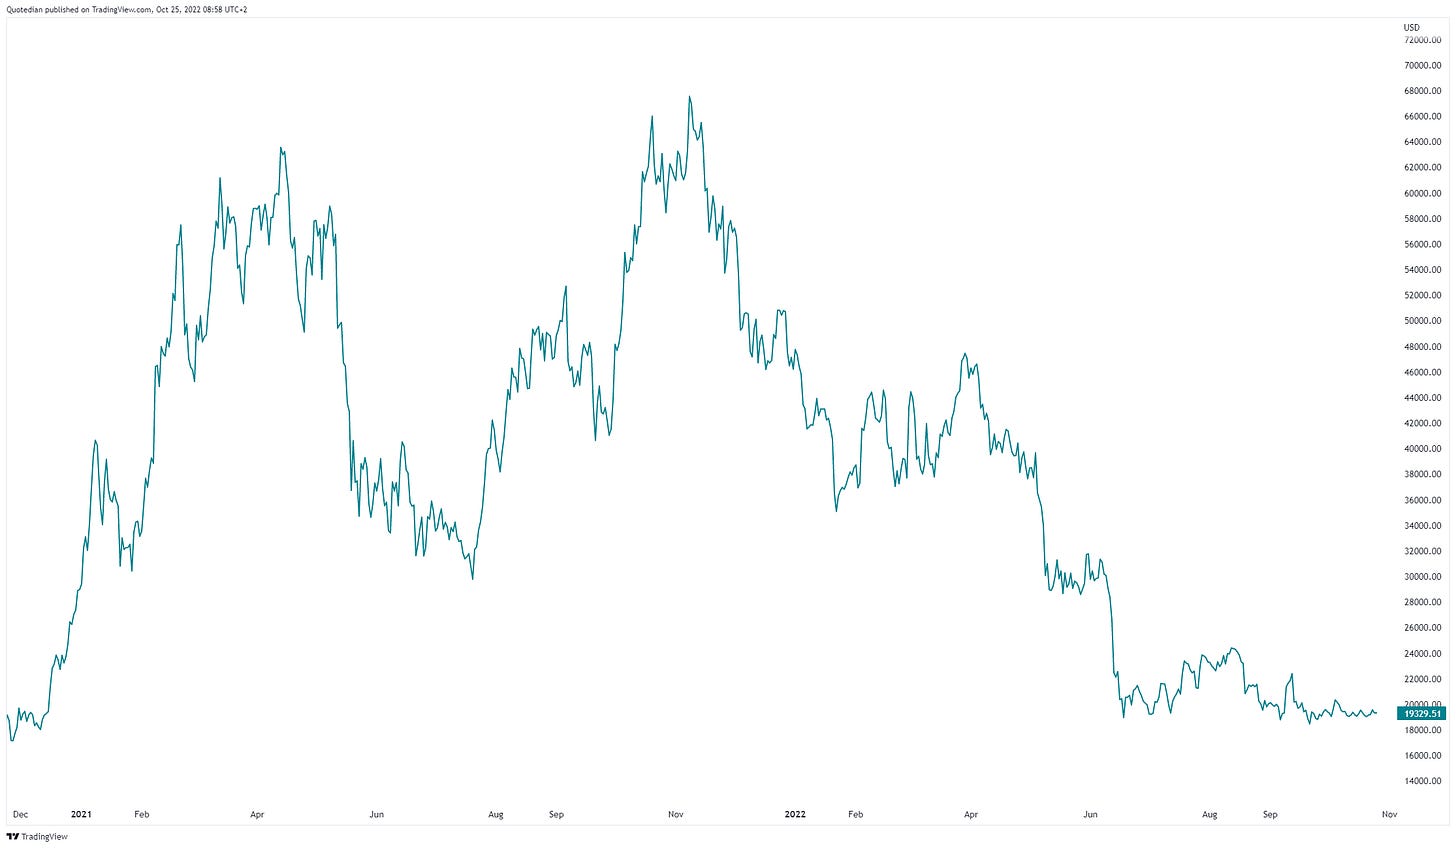
It has been a while since we spoke about crypto and looking at the chart of Bitcoin explains why:
Dead. Kaputt.
Anyway, I hear to European opening bell ringing, so let’s call it a day (for the Q) here, but don’t forget to hit the Like button before you leave.
Have a great Tuesday - speak tomorrow!
André
CHART OF THE DAY
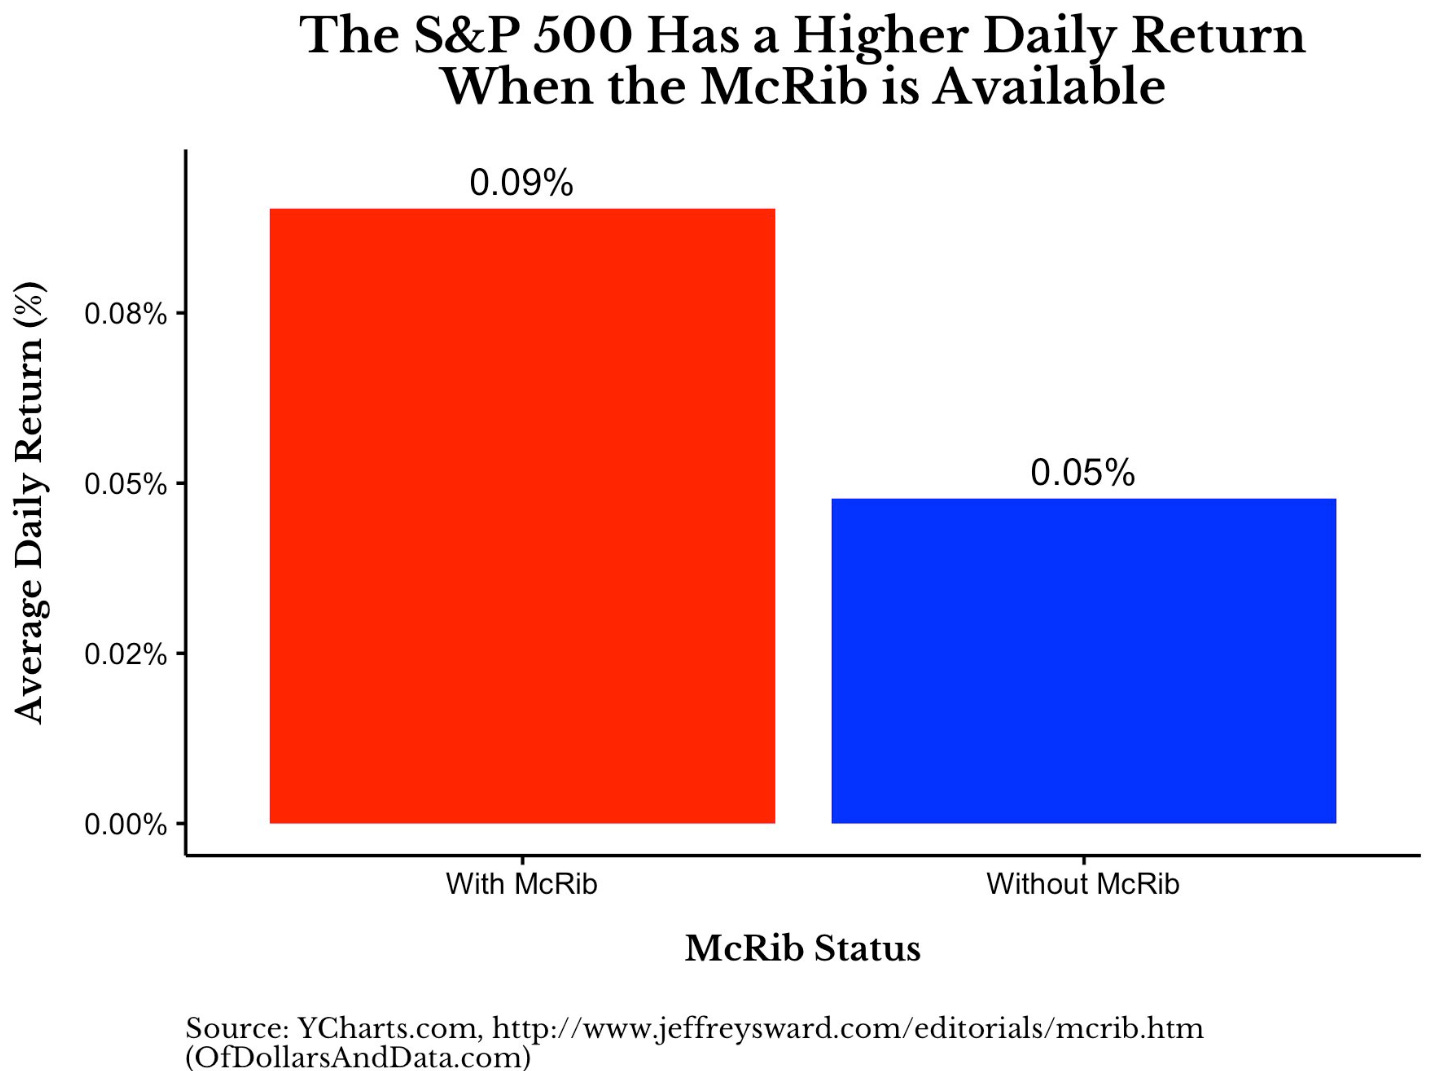
Today’s COTD is the final, irrefutable proof that stocks (might) go higher over the coming weeks or months … or at least as long as McRib is back on McDonald’s Menu in the States. As the statistic below shows, over the period from 2010 to 2021 when the McRib sandwich was available (20.8% of time) at MCD, the S&P 500 advanced 0.09% a day compared to the 0.05% when this particular burger was not available. That’s nearly double the average daily returns! Nothing to be argued over such a solid stat!
Thanks for reading The Quotedian! Subscribe for free to receive new posts and support my work.
DISCLAIMER
Everything in this document is for educational purposes only (FEPO)
Nothing in this document should be considered investment advice
Past performance is hopefully no indication of future performance


