

Warsh and Peace
Vol IX, Issue 23 | A NPB Original

“The strongest of all warriors are these two — Time and Patience.”
— Leo Tolstoy

Two major events dominated markets (and the press) during the week just gone by:
FIRST
Earlier this week, Trump signed the US-Iran MoU (Memorandum of Understanding) in Versailles. It’s not really a treaty, but the parallel with the one signed by Germany there on June 28, 1919, is notable. Back in 1919, French Marshal Ferdinand Foch, the Supreme Allied Commander during World War I, made the prophetic statement, that
“This is not a peace. It is an armistice for twenty years,”
because he saw it as too lenient on the loser of that war.
Hhhhmmm….
As the fine folks at RaboResearch suggested in a note yesterday:
“This MoU is also lenient on Iran, who thinks it won, and again doesn’t look like peace, just an armistice for 20 weeks – which ends two days after the US midterm elections. Indeed, even as Trump was touting the importance of the deal to avoid “economic catastrophe,” he underlined he’ll bomb Iran again if they don’t honour it.”
Second
So it happened that we were all wrong - Warsh turned out to be indeed a Hawk dressed up as a Dove …
I already covered this in last Thursday’s “The Q - Daily Edition” (click here), but here’s once again a short rundown of the most important (and immediate) observations:
The statement was notably shorter than in previous meetings, acknowledged elevated inflation, and described growth as solid, supported by strong productivity and capital investment.
The median 2026 PCE inflation forecast rose to 3.6% from 2.7% in March, while growth was revised down to 2.2%. The dot plot turned more hawkish, with nine officials projecting at least one rate hike this year.
Warsh did not submit his own rate projection.
Warsh unequivocally reaffirmed Fed independence and stressed his commitment to restoring price stability, with inflation the dominant concern.
Chair Warsh’s press conference also reinforced his reform agenda, including reviews of Fed communications, balance sheet policy, the use and reliability of existing data sources, productivity and labor market dynamics, and the Fed’s inflation framework.
Whilst overall it is probably a positive albeit hawkish change at the Fed, one particular thing stood out most to me, which I already highlighted on Thursday too:
The one thing that has raised my eye-brow, though I could not confirm nor re-find the source, was a comment that Warsh did not care about short-term market movements due to his policy decisions, rather he is focused on long-term goals. This reminds me so much of ECB Boss Lagarde’s comments in 2020, her first meeting has head of that institution. The bond market quickly tested that resolve, which quickly dissolved.
Maybe Warsh is the tougher cowboy, which only means there will be much more shards to pick up once he caves in.
So, here’s the “New Sheriff in Town for Dummies” redux:
The first is that the easiest thing in the world for a central banker to do is talk tough. The hardest thing in the world for a central banker to do is stay tough

With that out of the way, let’s do a cross-asset speed round, starting with the interest rates side of things for once.
The reaction of the bond market post the Warsh presser was one of the more the most emotional (read: hefty) ones of the past five ‘inauguration’ FOMC meetings:
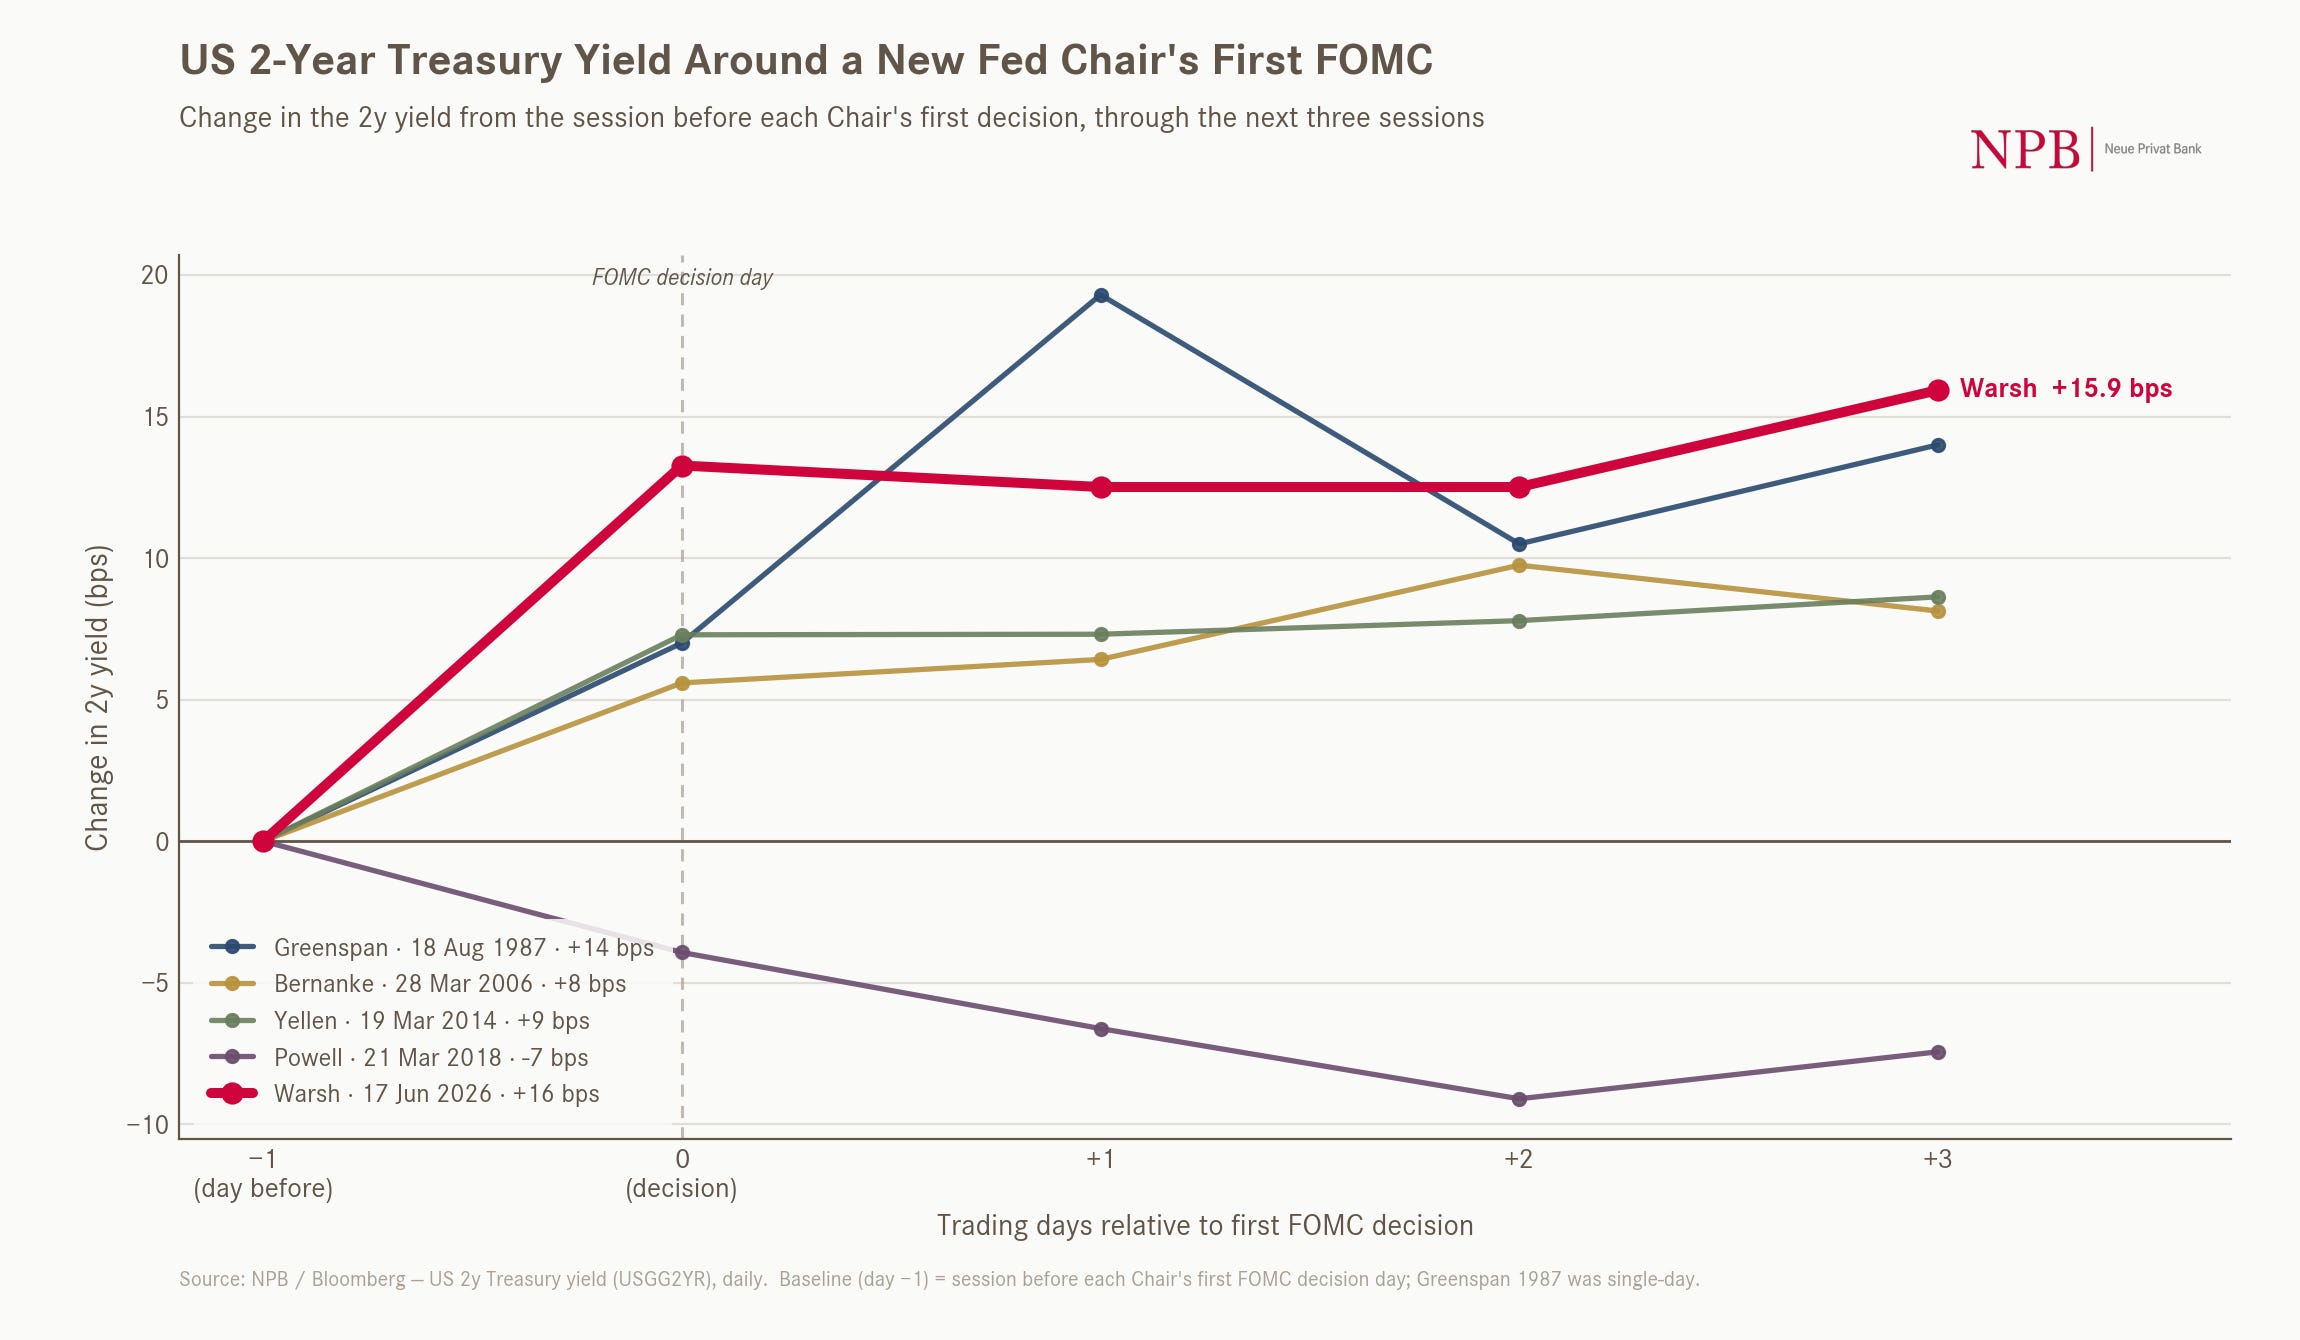
Here’s the chart of the US 2-year Treasury yield, with the hand pointing at FOMC date:
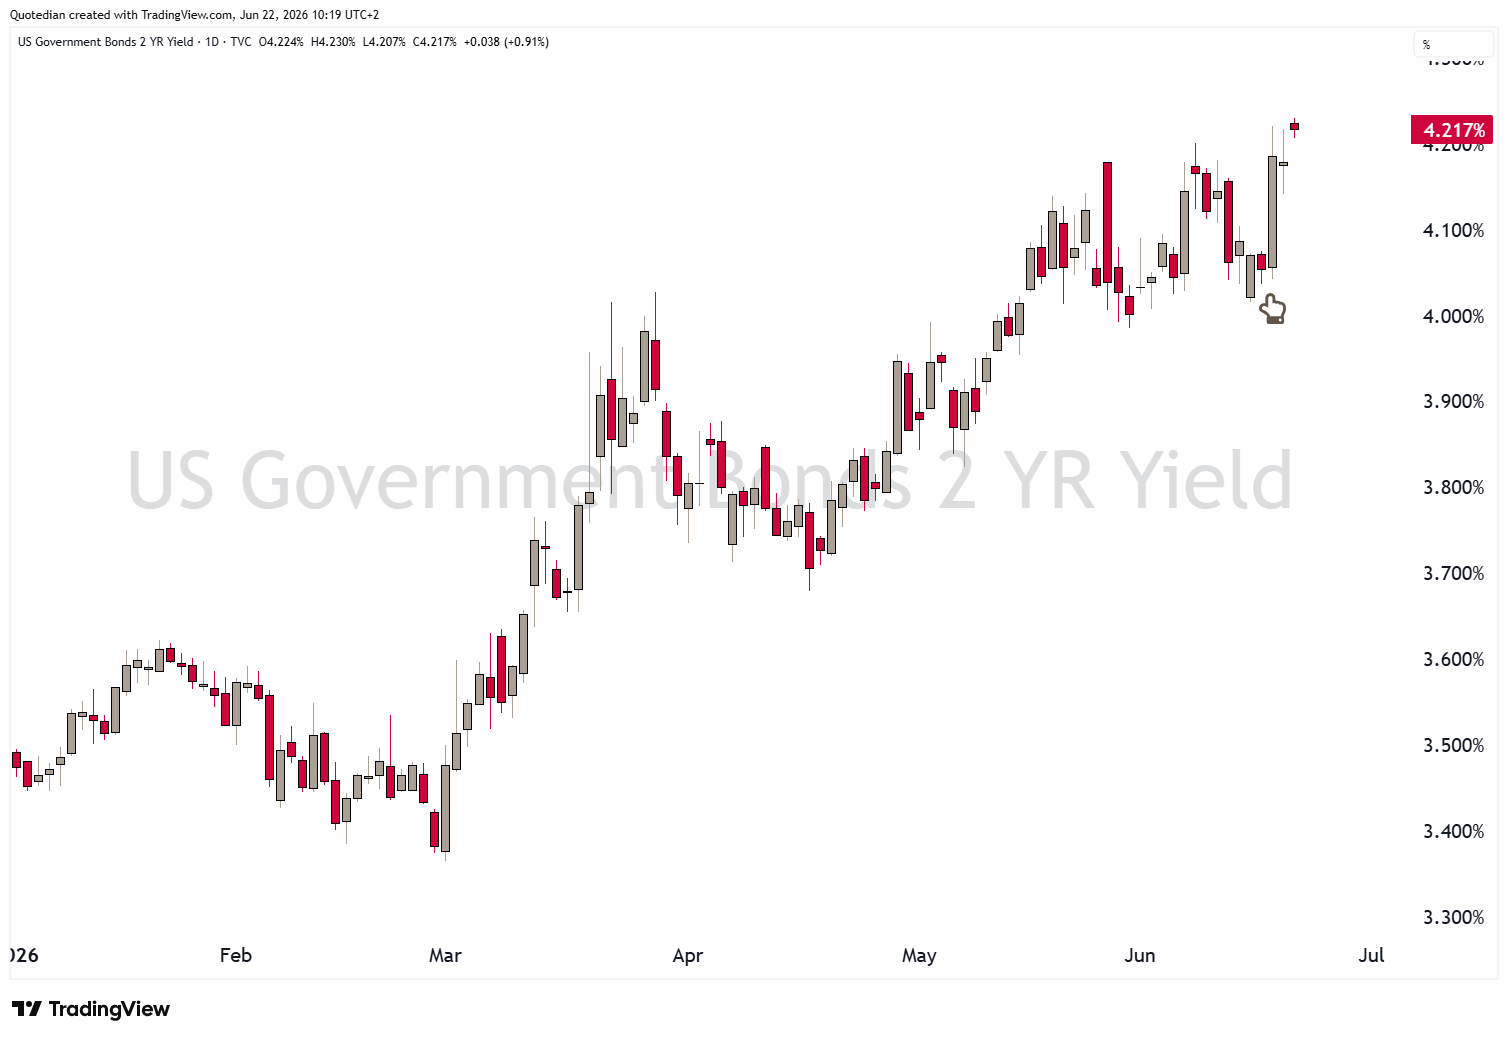
Now, compare that to the same chart but on the 10-year yield:
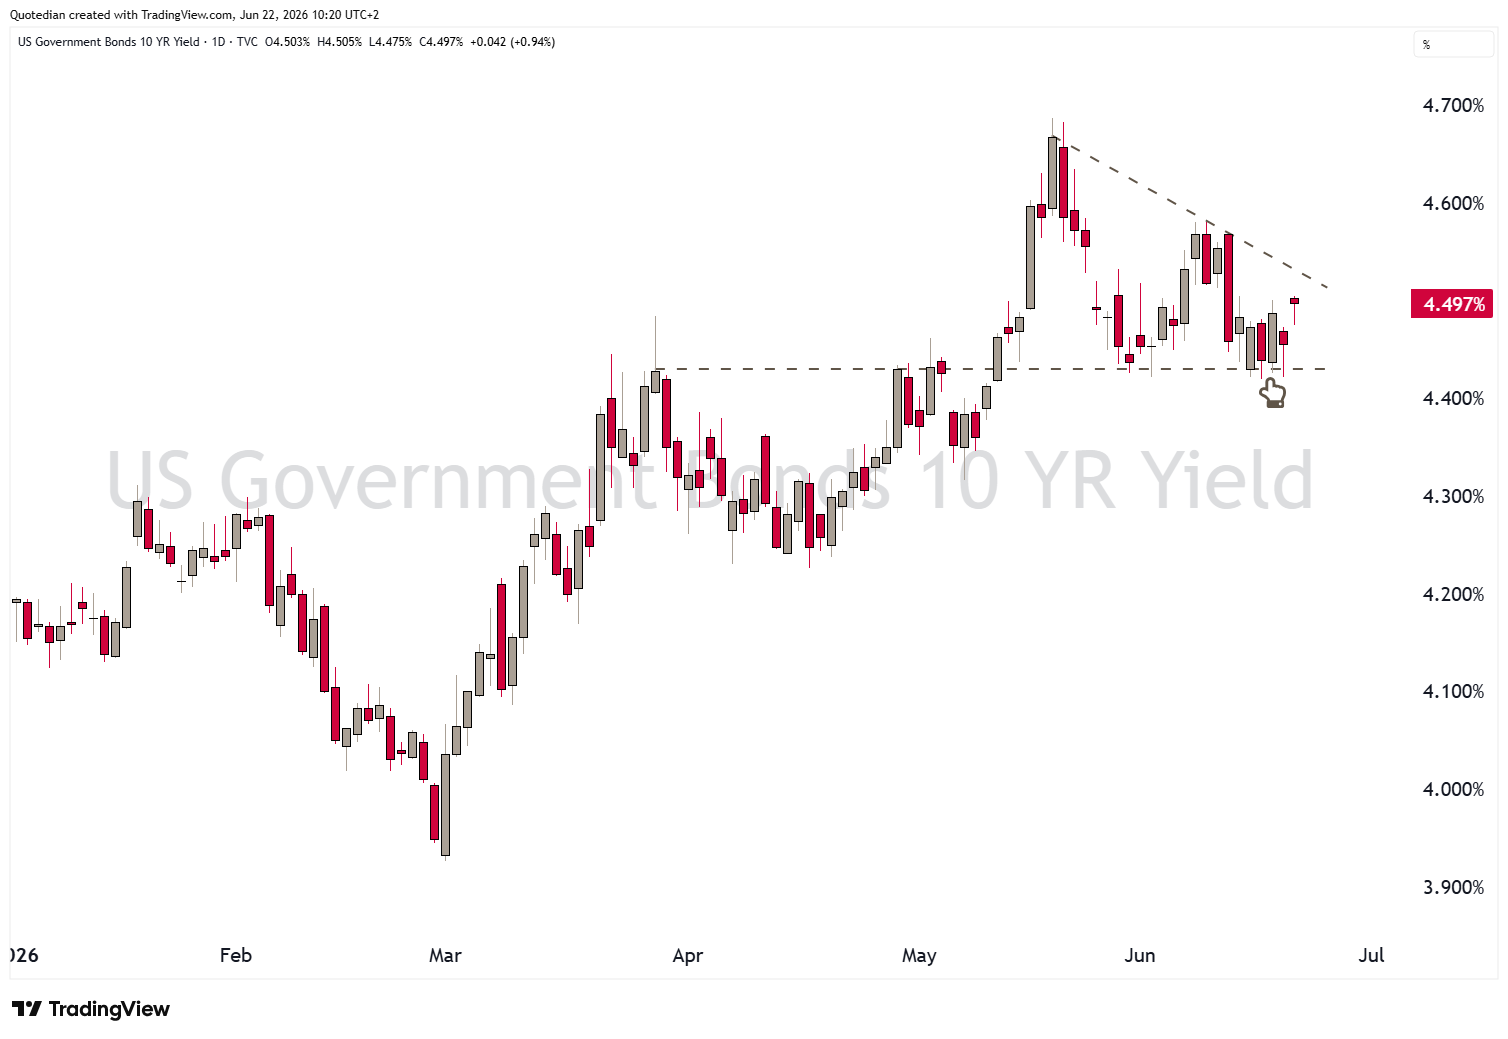
Yes, you are right! A move less violent reaction, to be interpreted as that the market kind of liked (or at least accepted) the newly found Fed hawkishness, which should fight shorter-term inflationary pressures (2Y yield), without jeopardising longer-term growth (10Y yield).
Combined, this of course means that the yield curve (10y-2y) flattened, cutting through that (circled) pivot-point like a hot knife through butter:
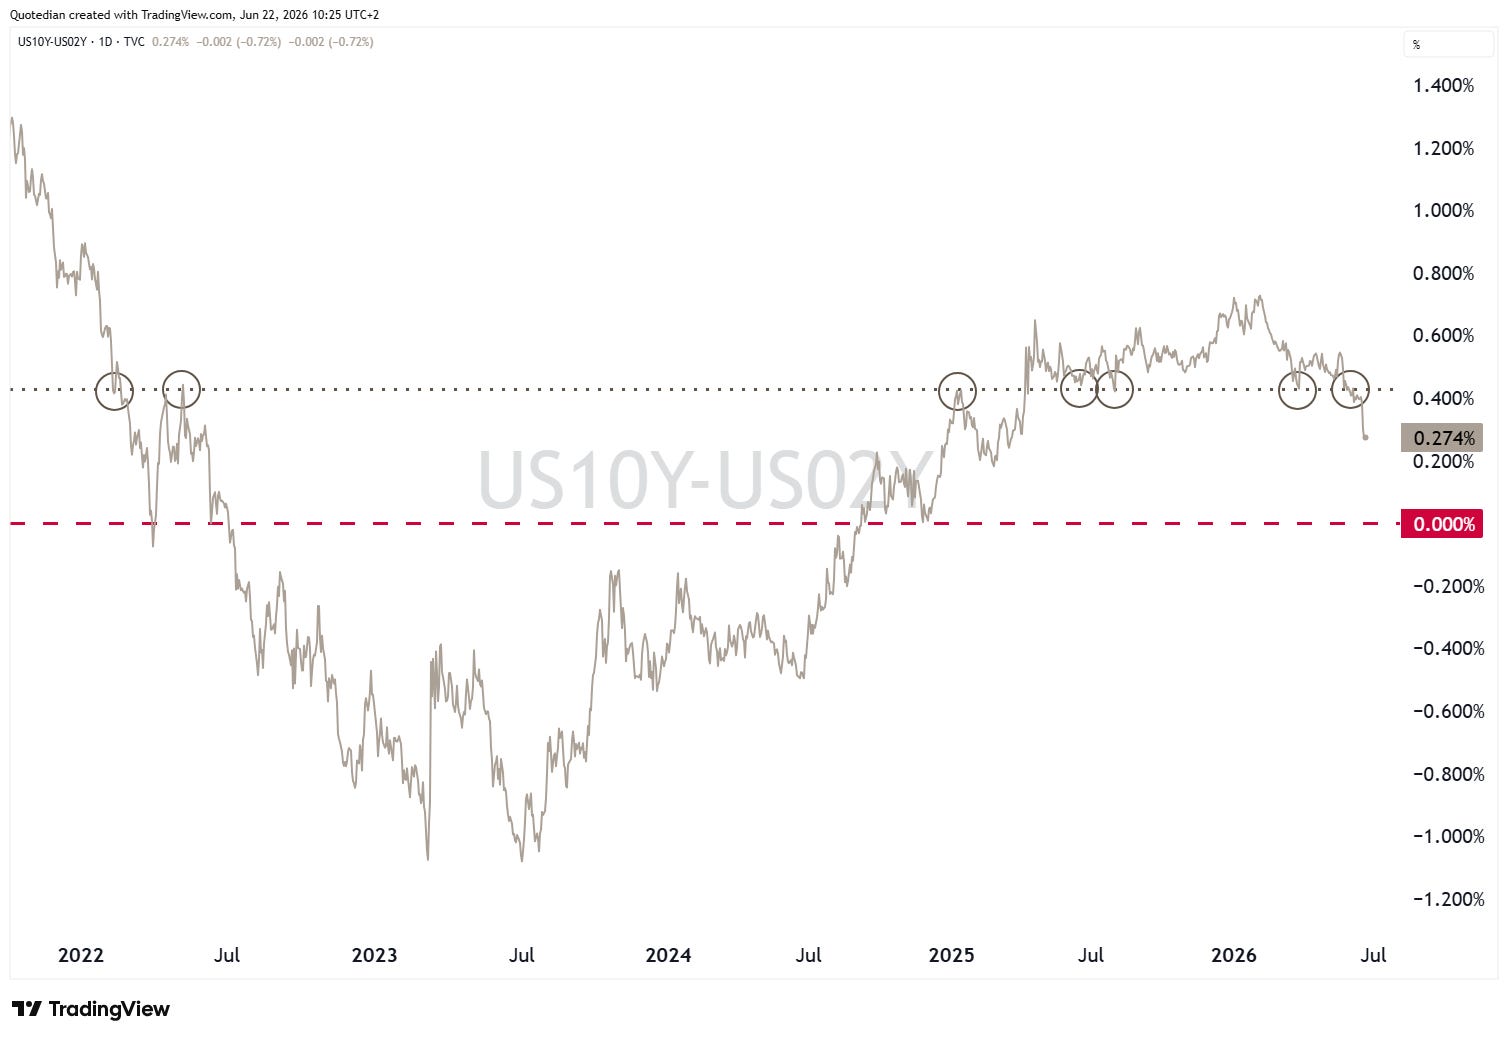
We will revisit the shape of the yield curve in a moment.
But first…
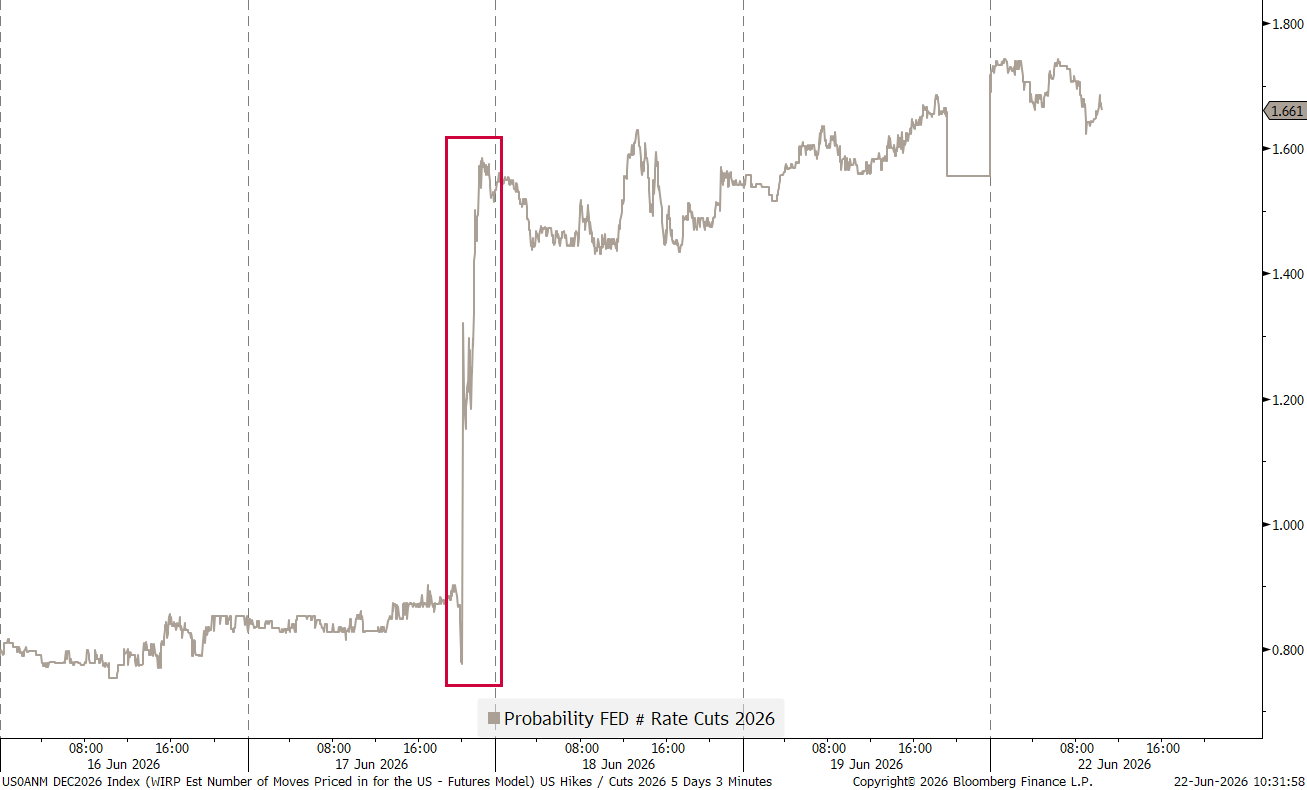
Fed rate cuts are now clearly off the table, with futures-implied expectations for rate hikes exploding shortly after the Warsh press conference:
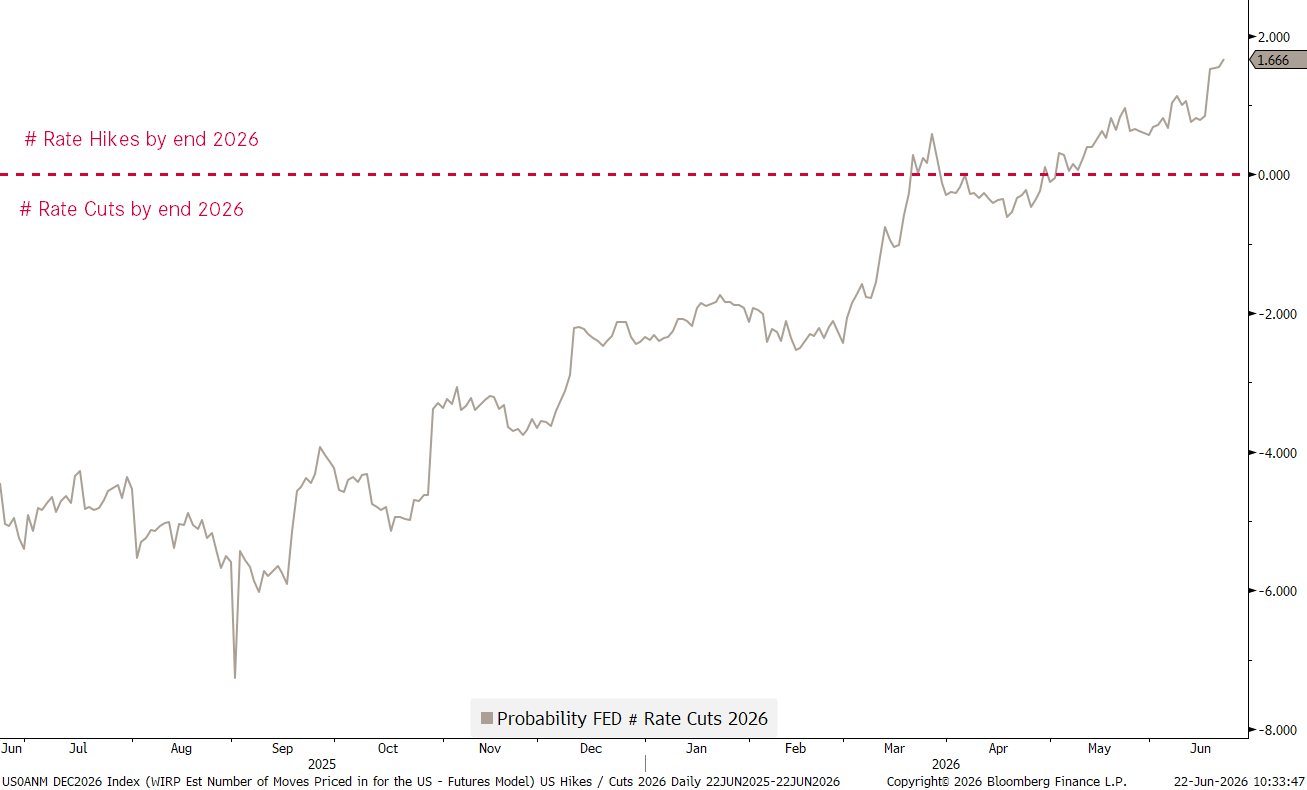
That’s quite the change since the beginning of the year:
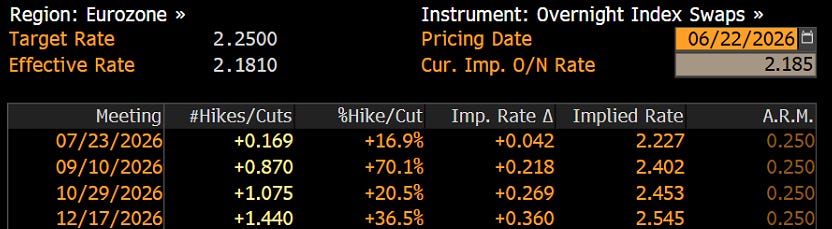
The ECB already hiked two weeks ago, and one more hike is expected by autumn of this year:
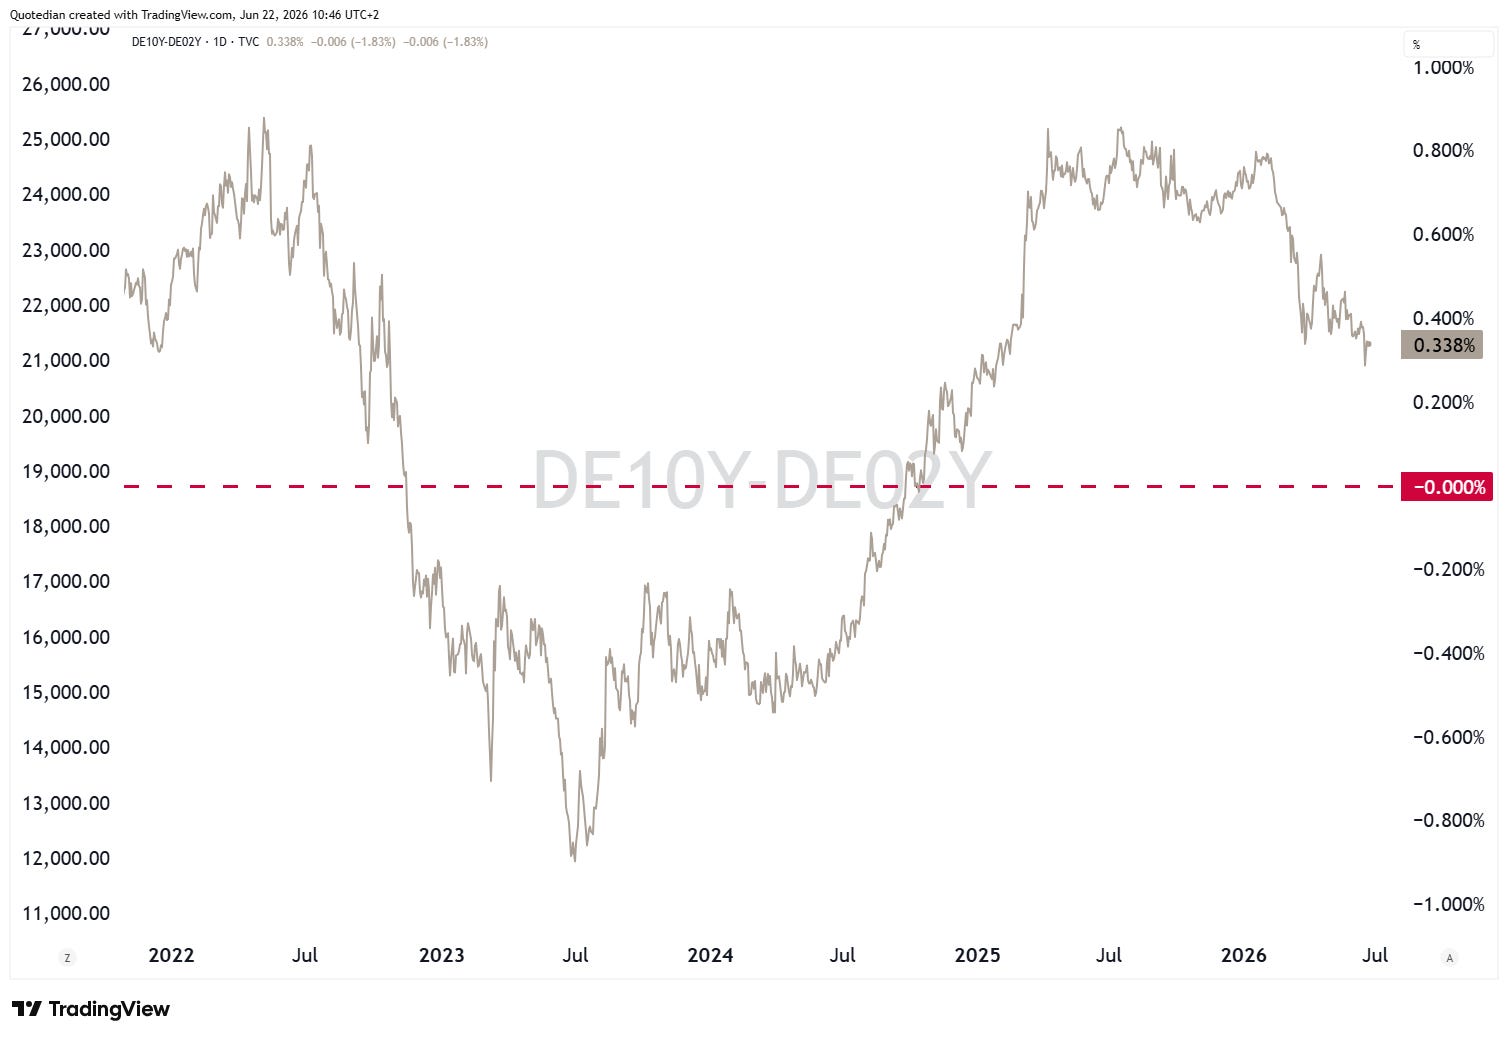
The flattening process in the German Yield curve (10y-2y), as a proxy for the European interest rate market, has been ongoing for a while already:
Now, as a segue into the equity section, the macro, cross-asset playbook suggests that flattening yield curves, where short-term rates rise faster than long-term rates (which may even fall), are not very equity-friendly. These bear flattenings tend to happen when central banks fear inflationary pressures from an overheating economy. The perfect moment to remember Ed Yardeni’s quote:
“Bull markets don’t die of old age. They are murdered by the Federal Reserve.”
Now, this is by no means an immediate death sentence for equities and in recent past equities have shrugged just about any signs of “clear and present danger”, but still it should not be ignored, but rather considered one more warning light turning on:

Equities initially recoiled from Mr Warsh's hawkishness, but have since resumed their familiar habit of shrugging off bad news.:
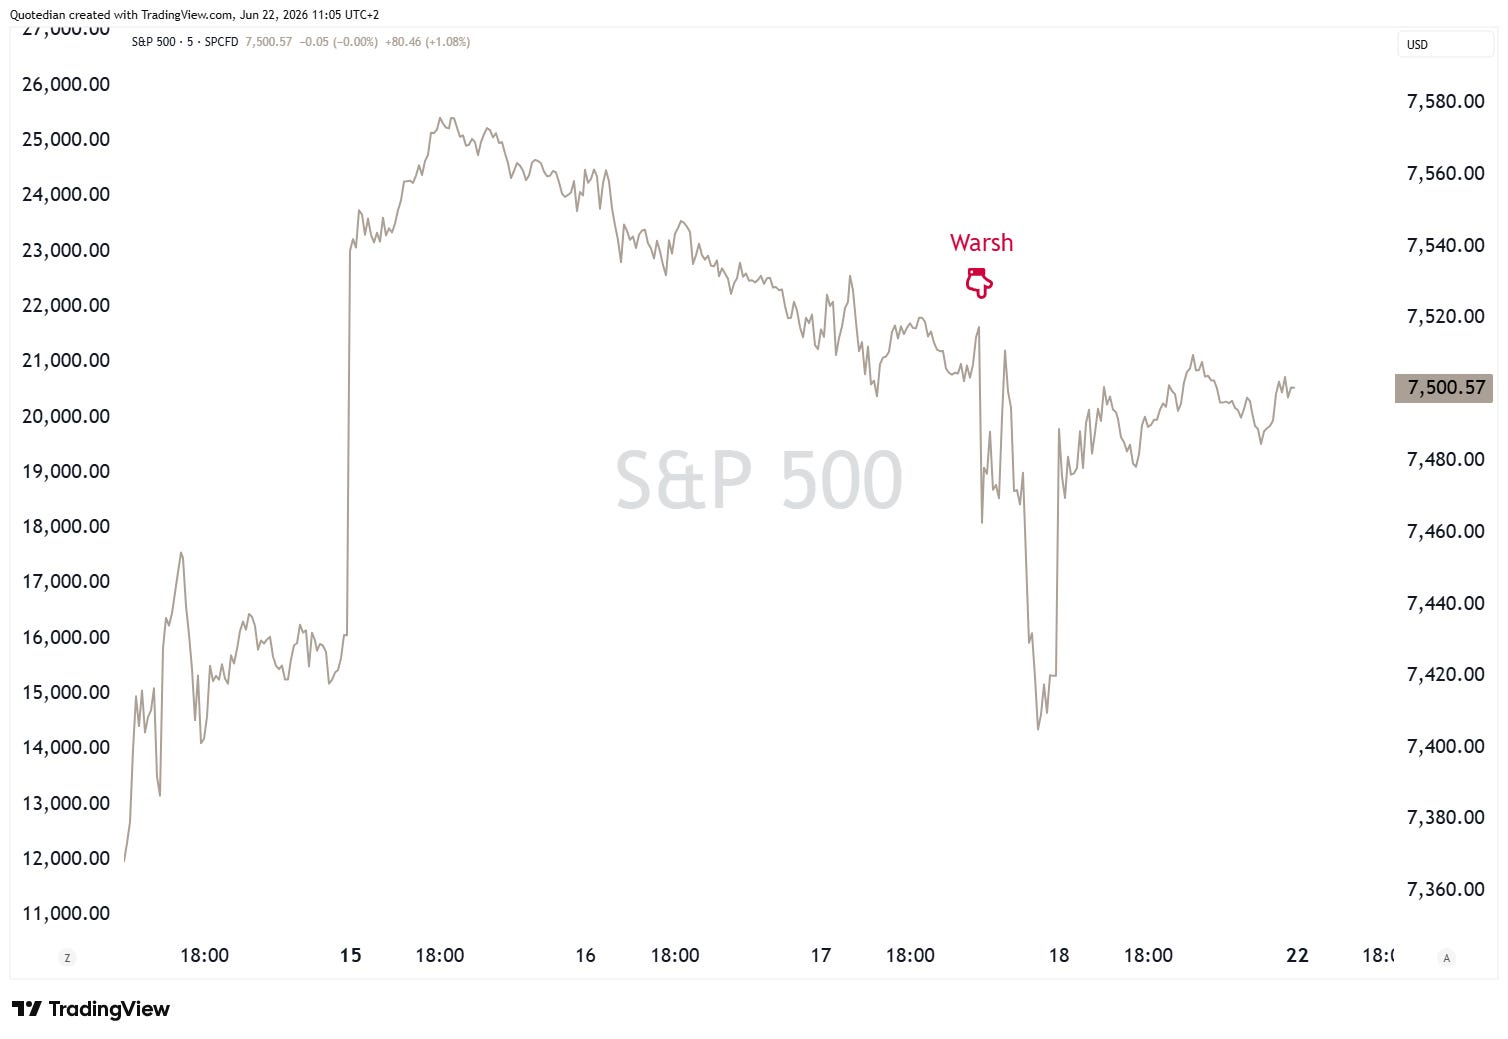
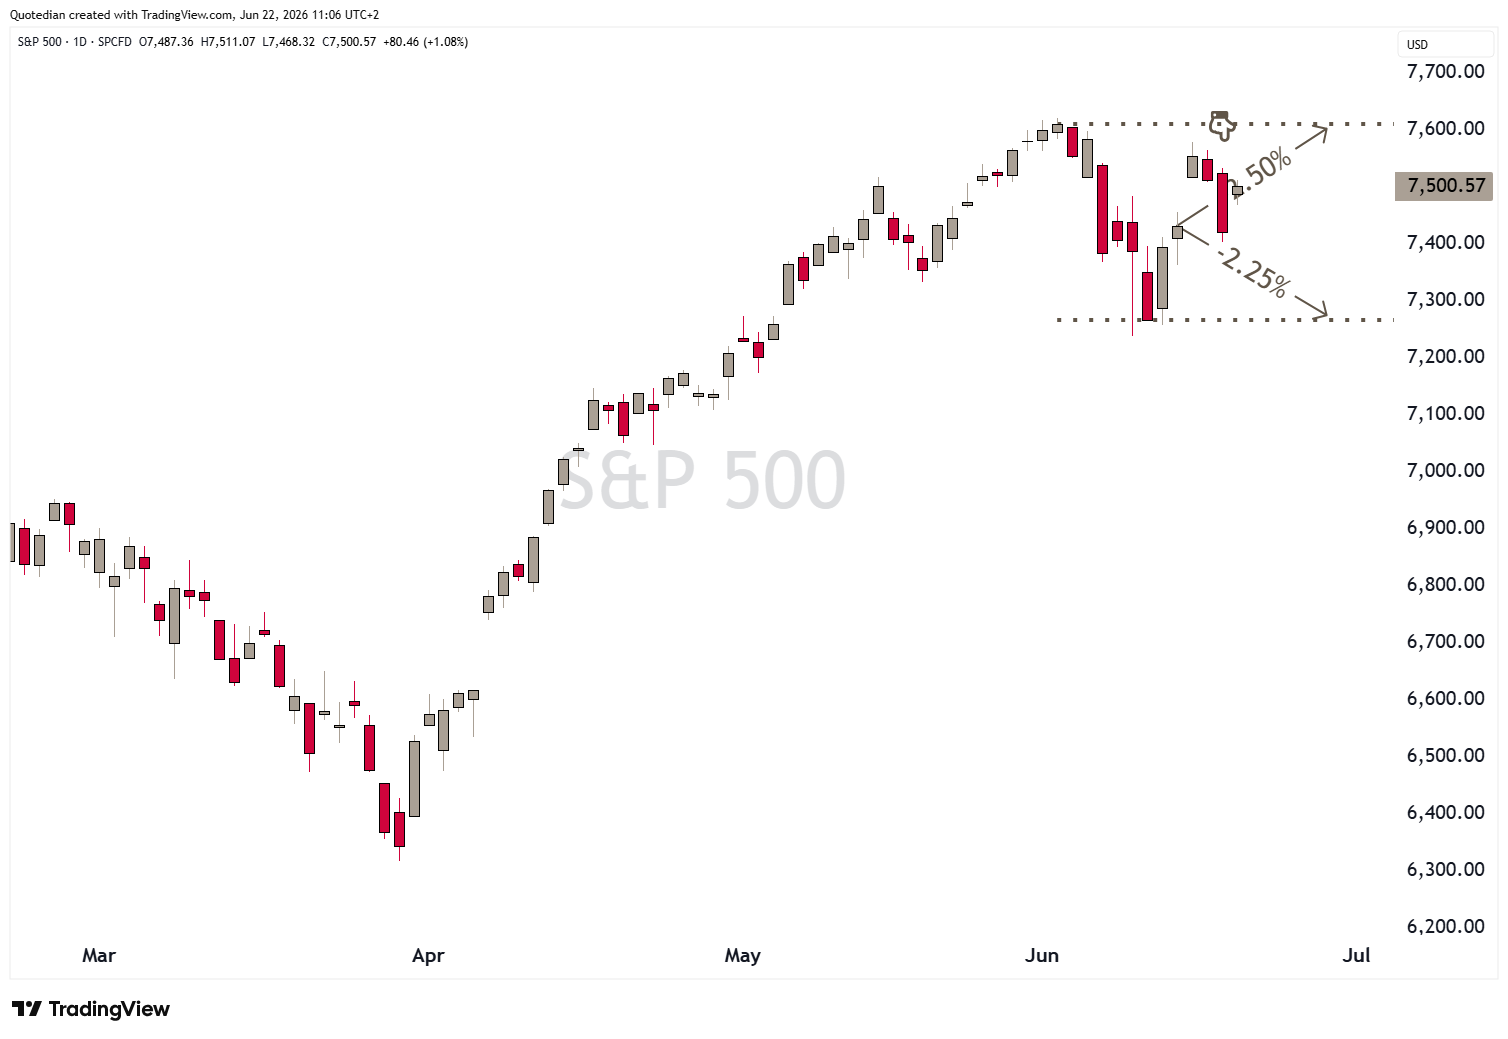
On our “road map”, the S&P 500 continues to move within our well-defined “lines in the sand”, meaning for now no bets should be placed on either side:
On the futures market (ES1) of the very same, price got very close to a breakout on the upper side,
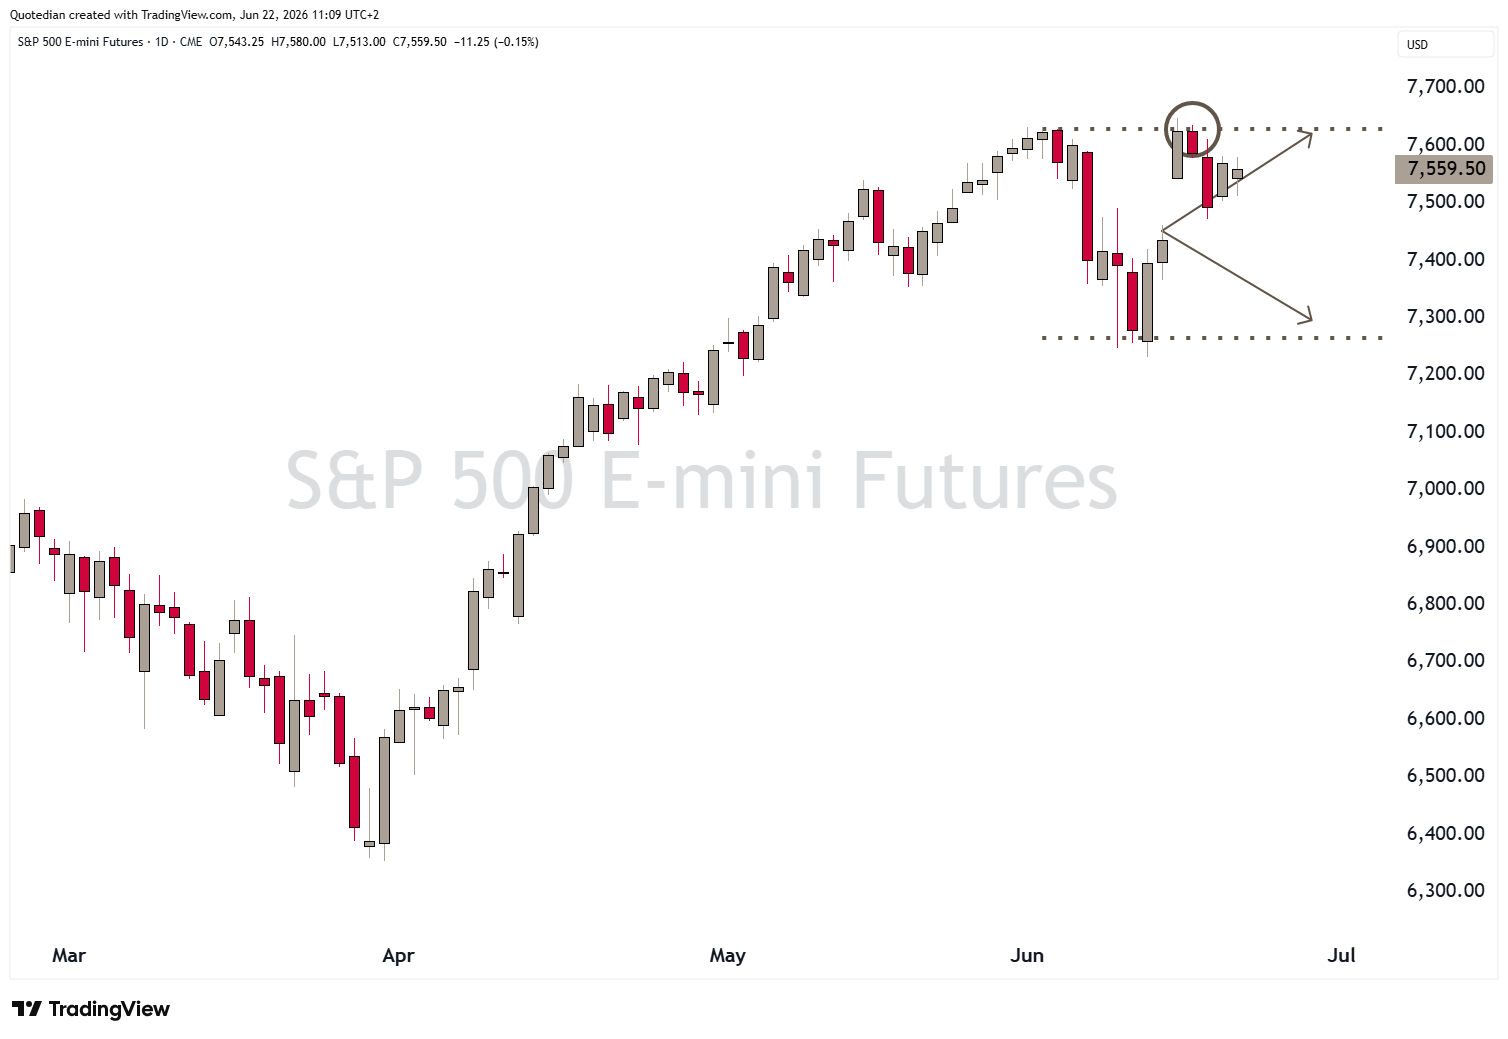
but patience and discipline, paid off well as Warsh turned out to be a party-pooper…

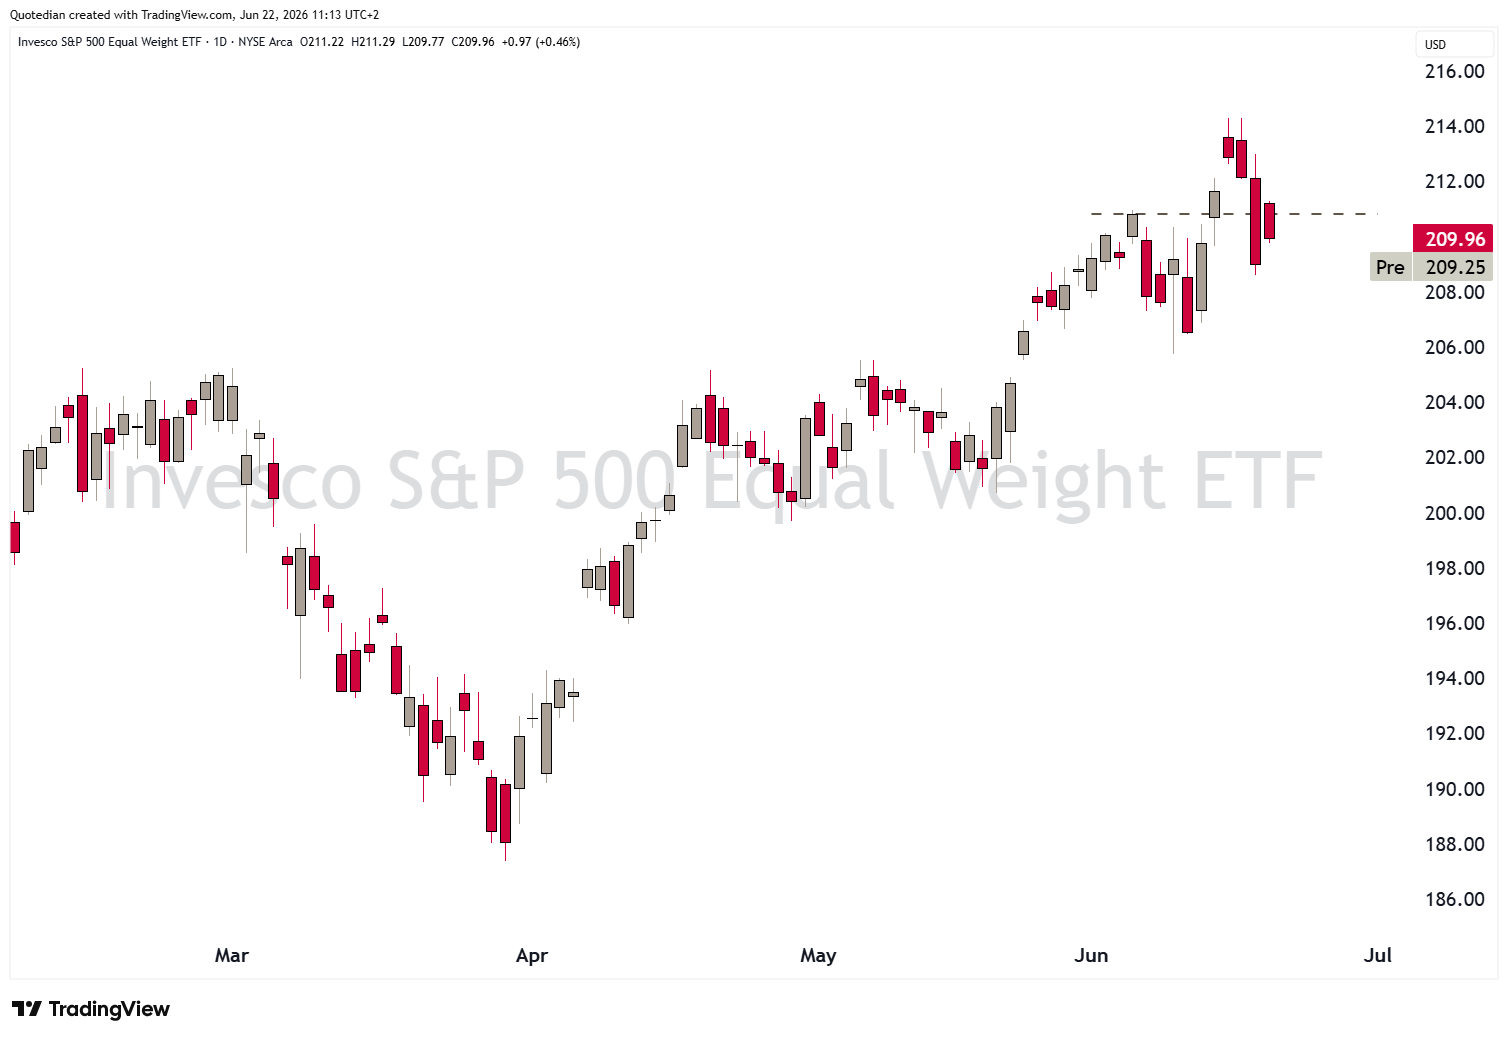
It turns out then that the break-out in the equal-weight S&P 500 (RSP) may have been premature:
Surprisingly enough though, small caps, after a break-out followed by a renewed breakdown have actually been able to recover above that line in the sand during the last trading day (Thursday) last week:
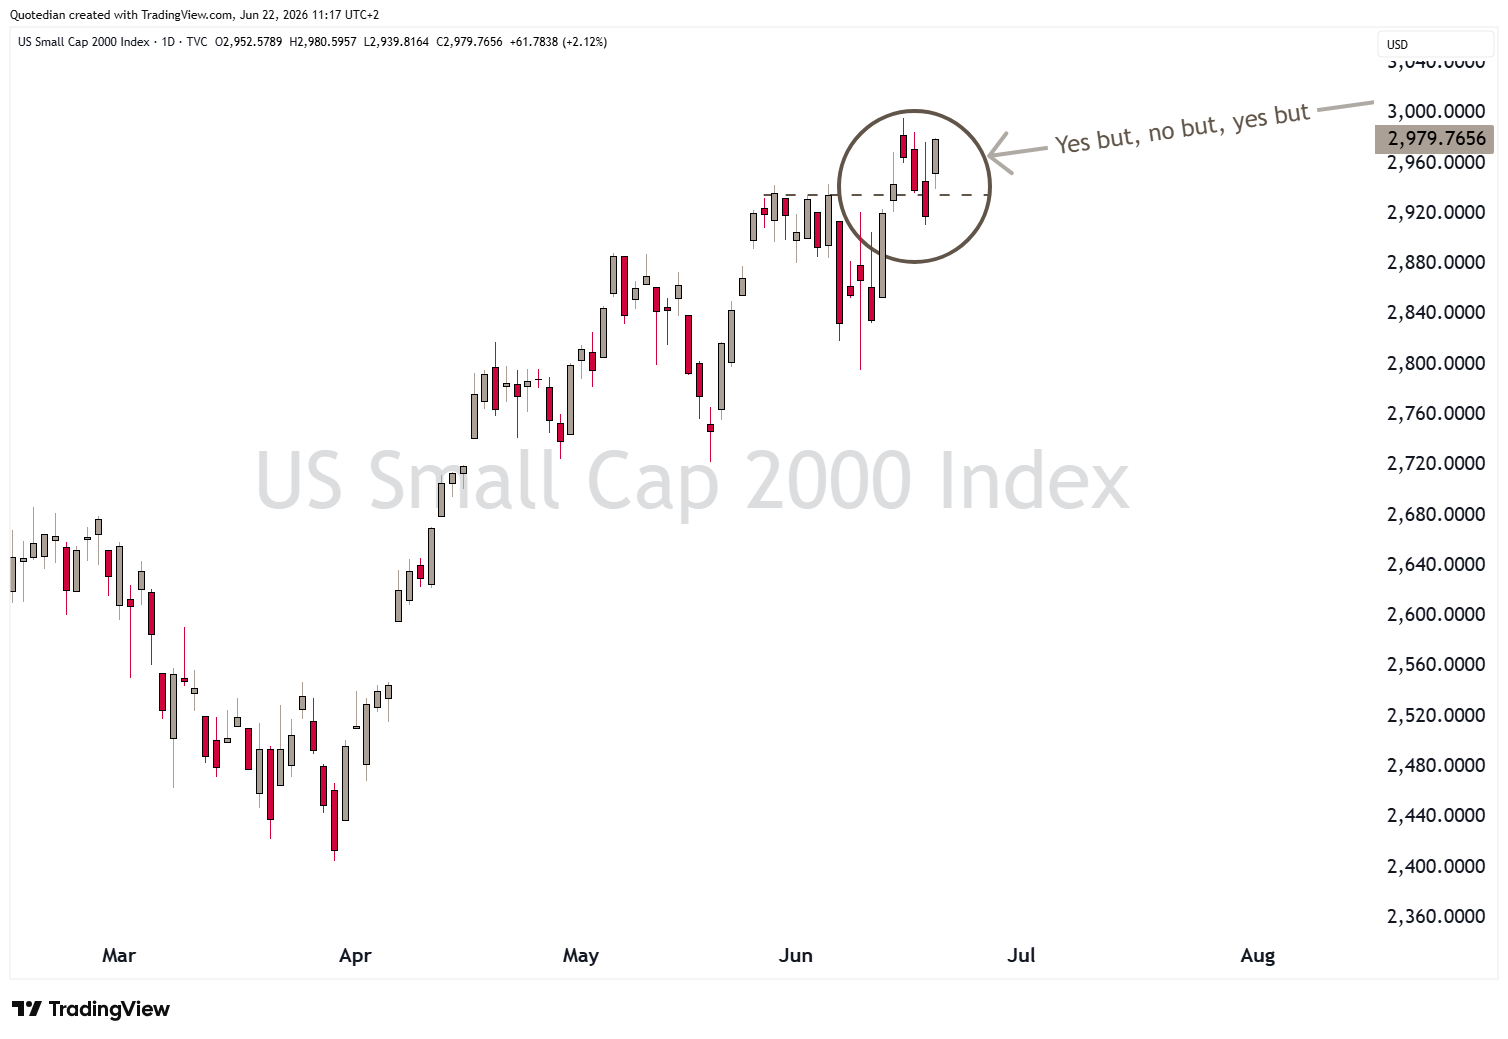
In theory, this small cap outperformance should not be happening, for several reasons, of which I highlight three:
Financing channel (the dominant one). Bear flattening is driven by the short end rising faster than the long end — and the short end is exactly where small-cap financing is anchored.
Bank/NIM composition. Small-cap indices are heavy in regional banks, who borrow short and lend long. A flattening curve compresses net interest margin directly.
Growth signal. A curve flattening toward inversion is the market pricing slower forward growth. Small caps are domestic, high-operating-leverage, cyclically geared.
NOW …
Let’s remember this:
"In theory, there is no difference between theory and practice. In practice, there is."
— commonly misattributed to Yogi Berra
Hence, the current good absolute- and relative performance can probably be attributed to following three factors:
Cycle stage. Early-cycle bear flattening (Fed just starting, robust nominal growth) can see small caps hold up because the earnings tailwind offsets the rate headwind.
The driver. A real-rate / inflation-scare flattener (Volcker-flavoured) is harsher than one driven by front-loaded-but-credible hiking that markets expect to end soon.
Starting relative valuation. If small-vs-large relative cheapness is already washed out, the incremental downside is smaller.
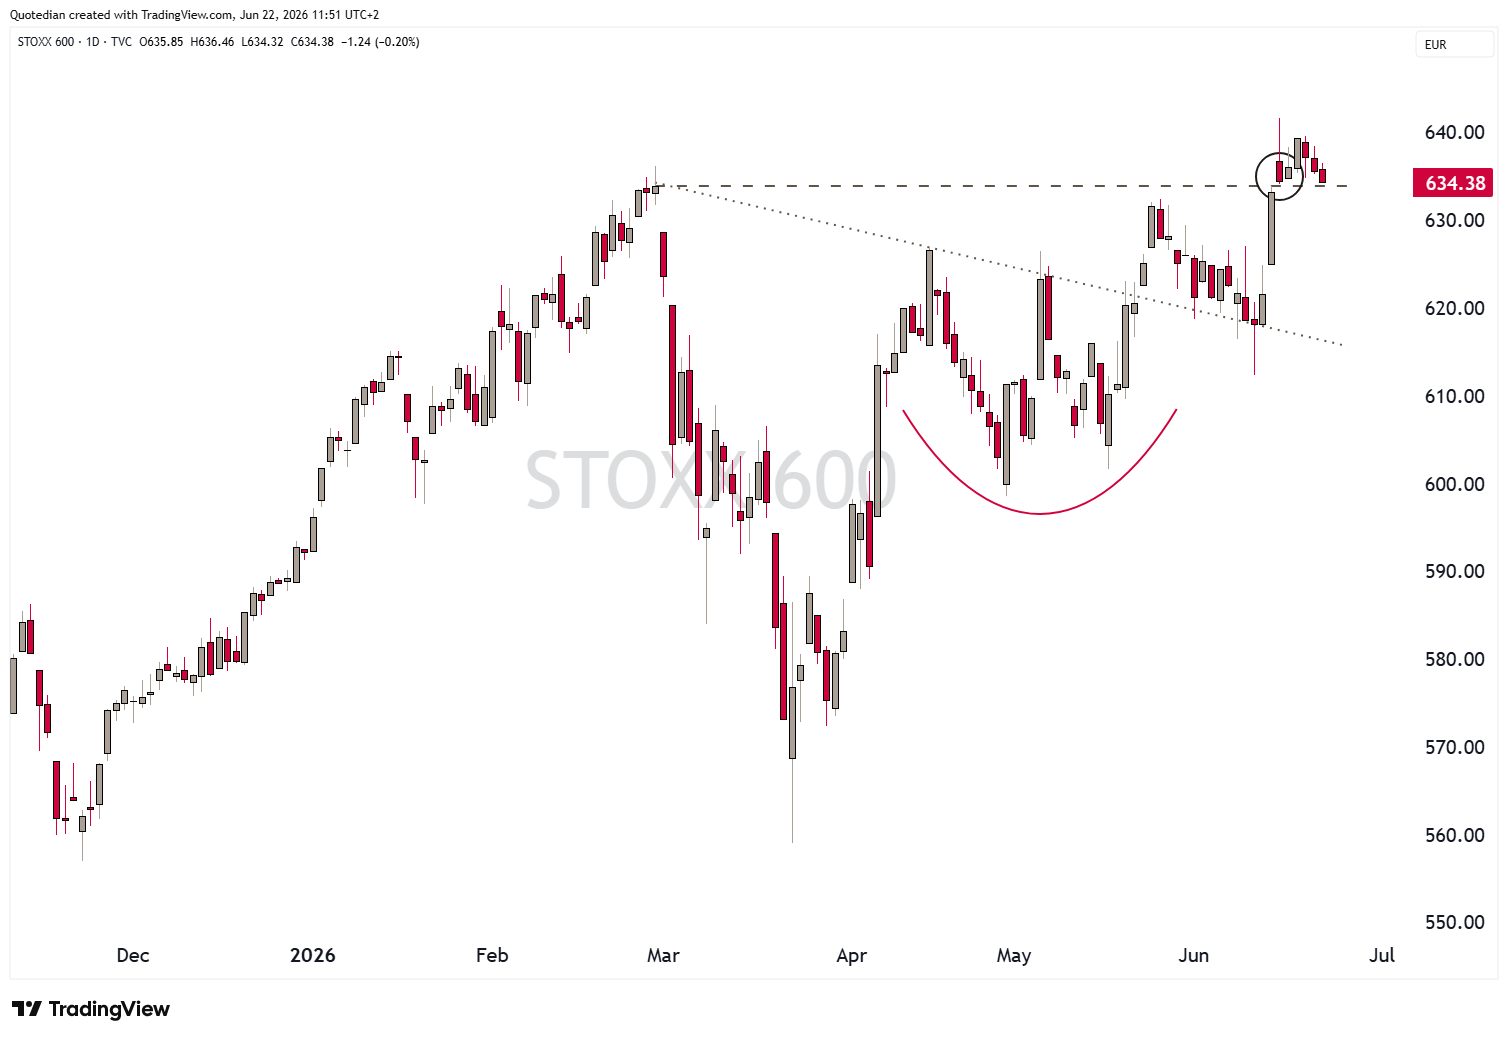
Turning to Europe, the STOXX 600 Europe index broke to new all-time highs (ATHs) early last week (Monday), and has been able to hold on to that ex-resistance now turned support:
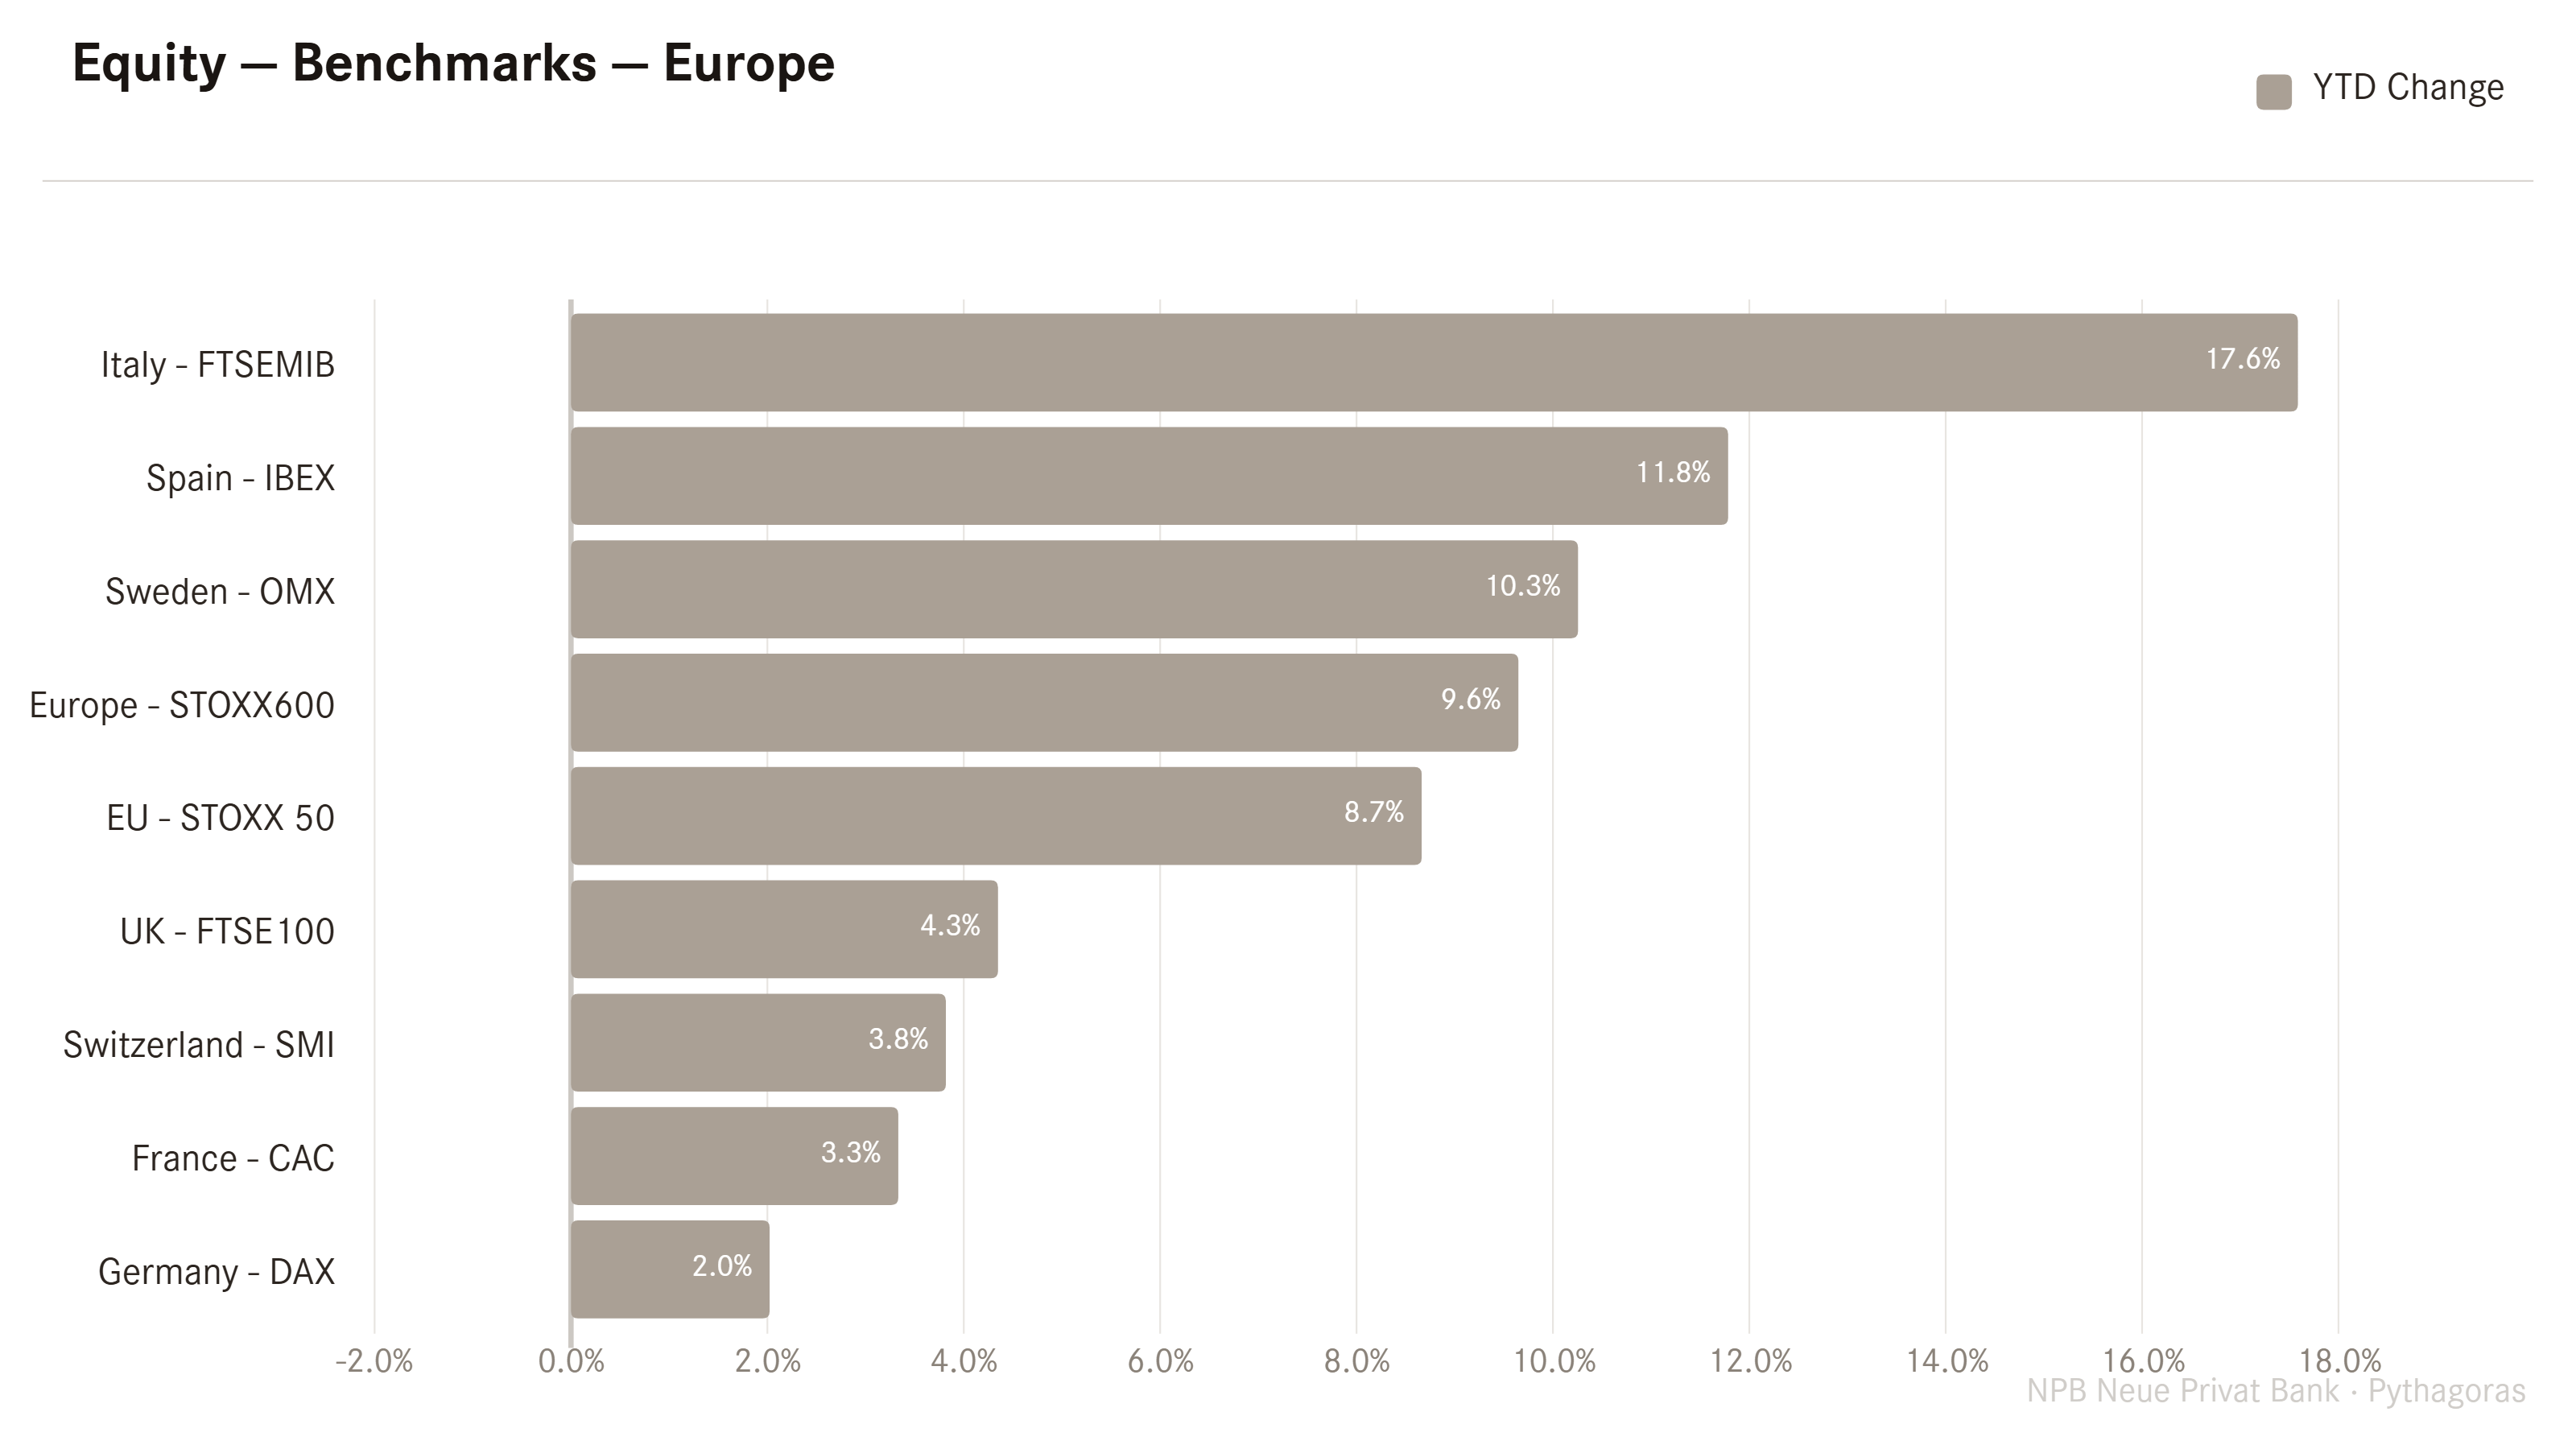
Though the European landscape is clearly growing at different speed levels:
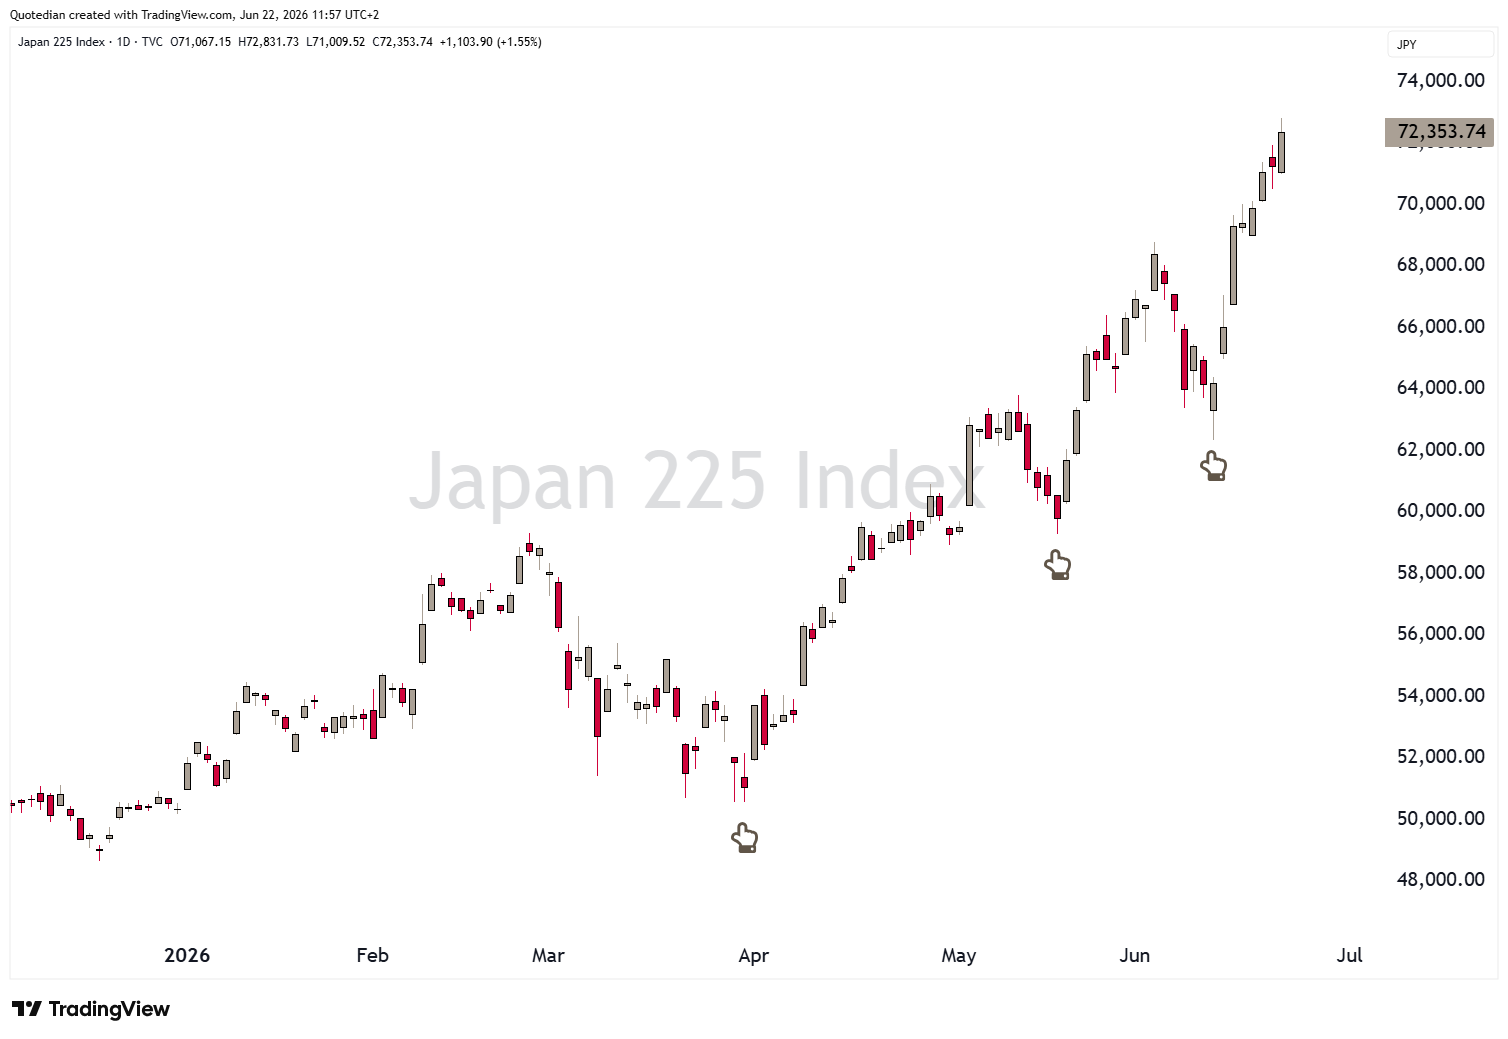
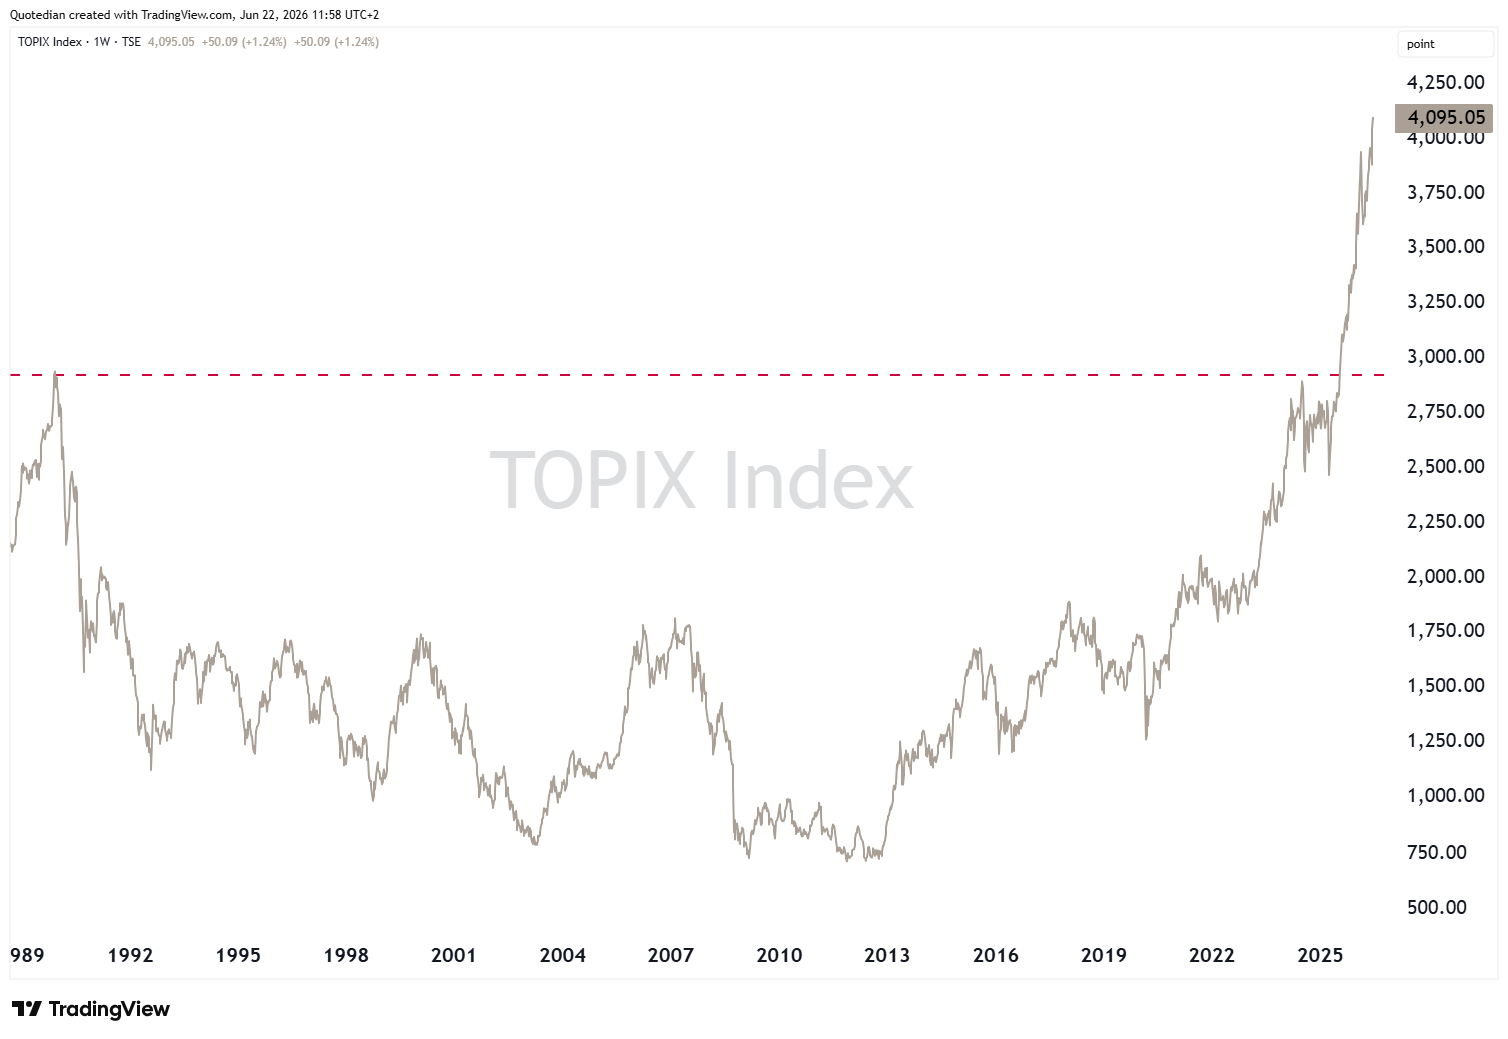
In Asia we continue to like love Japanese equities, where international recognition and acceptance is still slow to show up, providing continued tailwind to the rally. You had to be quick to buy those “corrections” on the Nikkei:
Remember that 1989 ATH in the TOPIX been taken out only last summer (August 25)? Well, that seems long gone now:
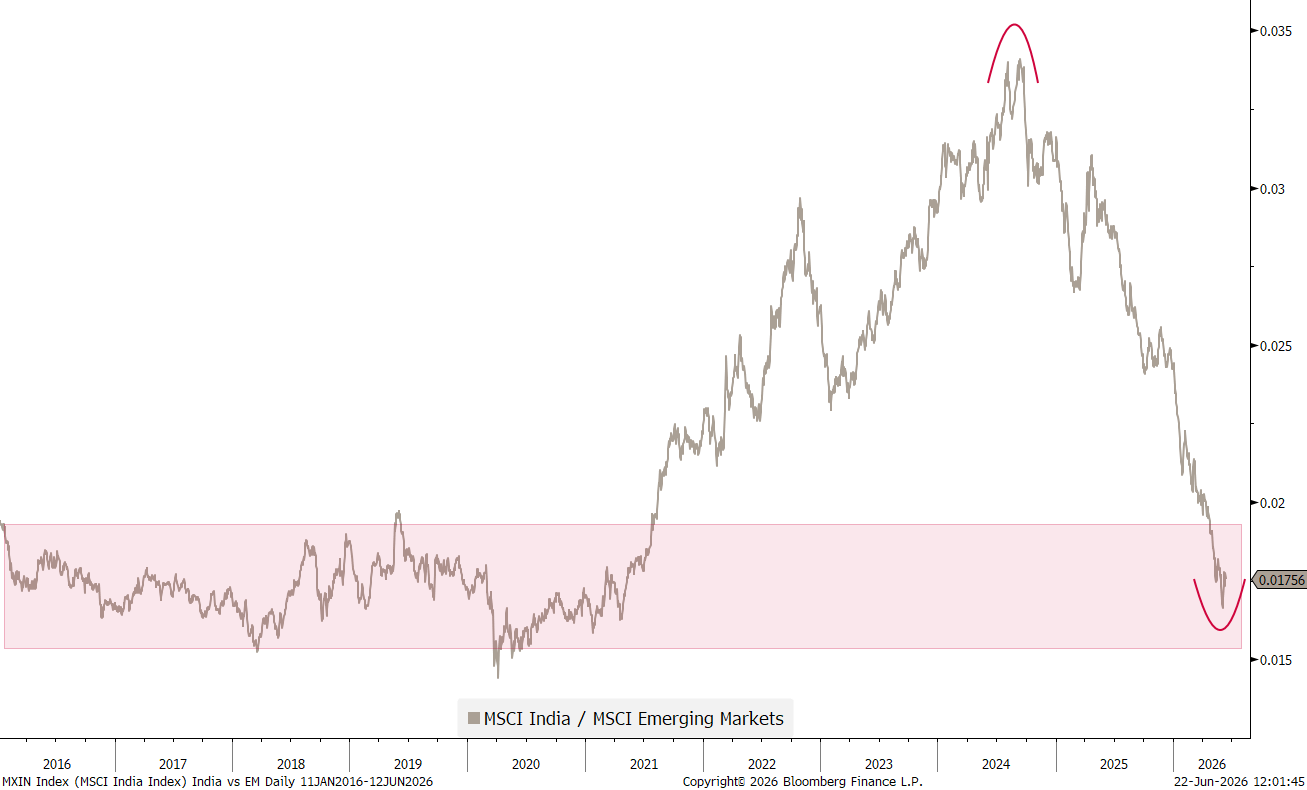
Whilst we usually are relative strength investors, every once in a while we like to foray into the world of “hated” investments, trying to pick early reversal points. Indian stocks may fit that description, where the relative chart has been hammered enough to coincide with an area of possible recovery:
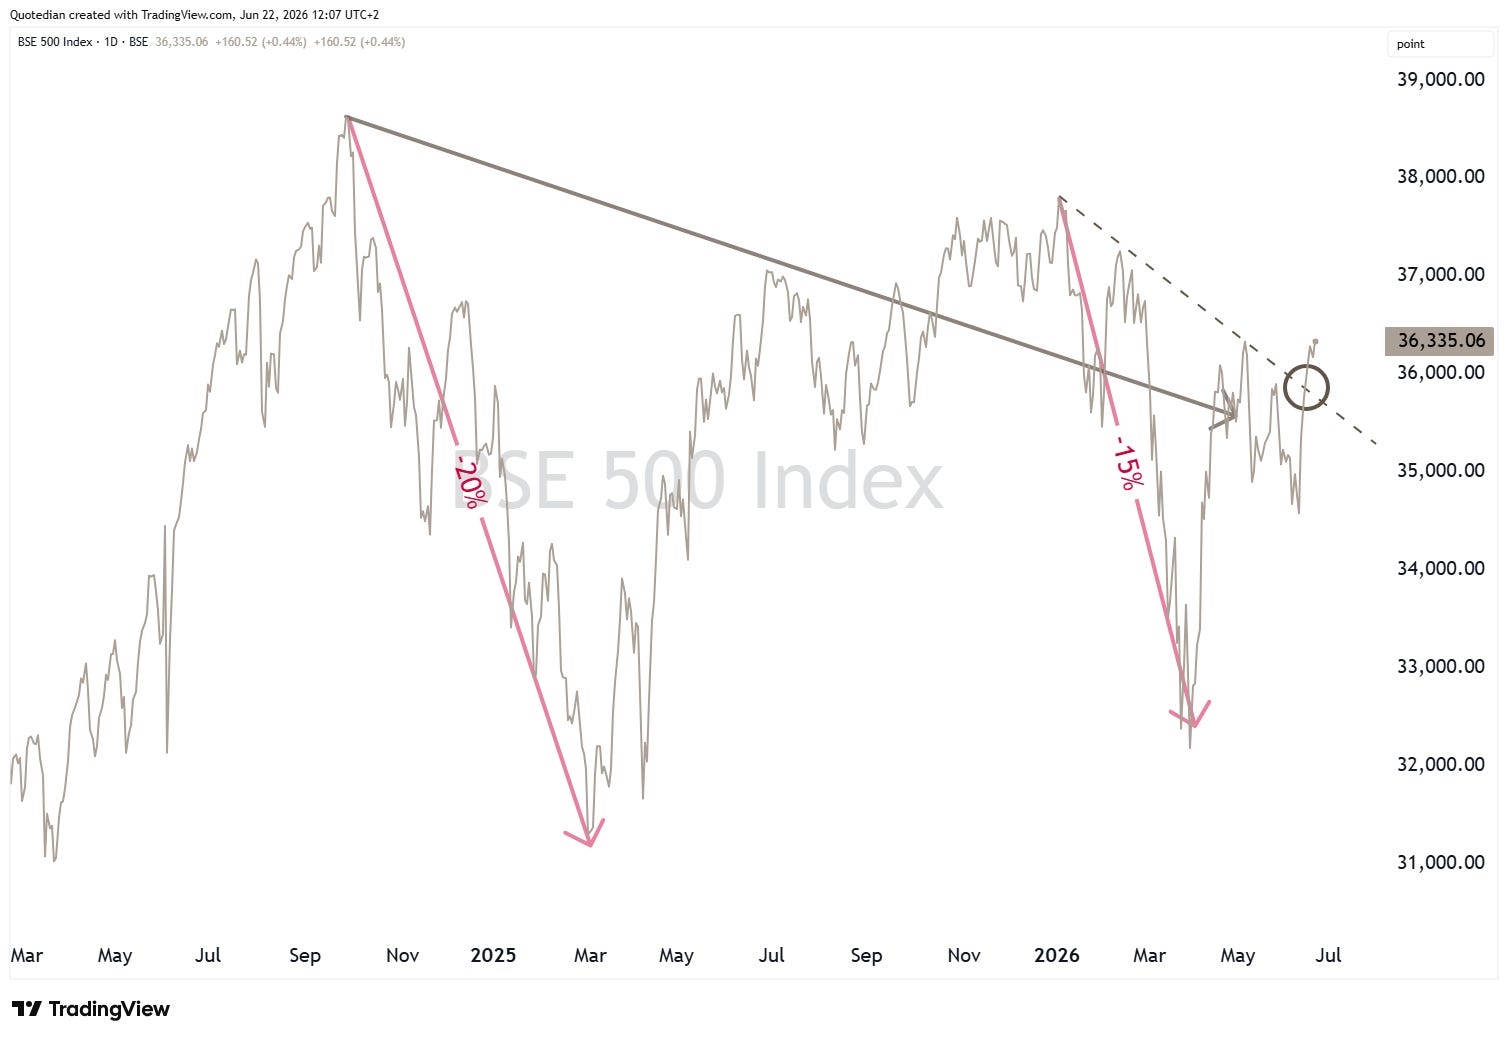
On the chart (BSE 500) a first hurdle (dashed line) may have been cleared, not least due to hopes about a resolution to the Strait of Hormuz closure:
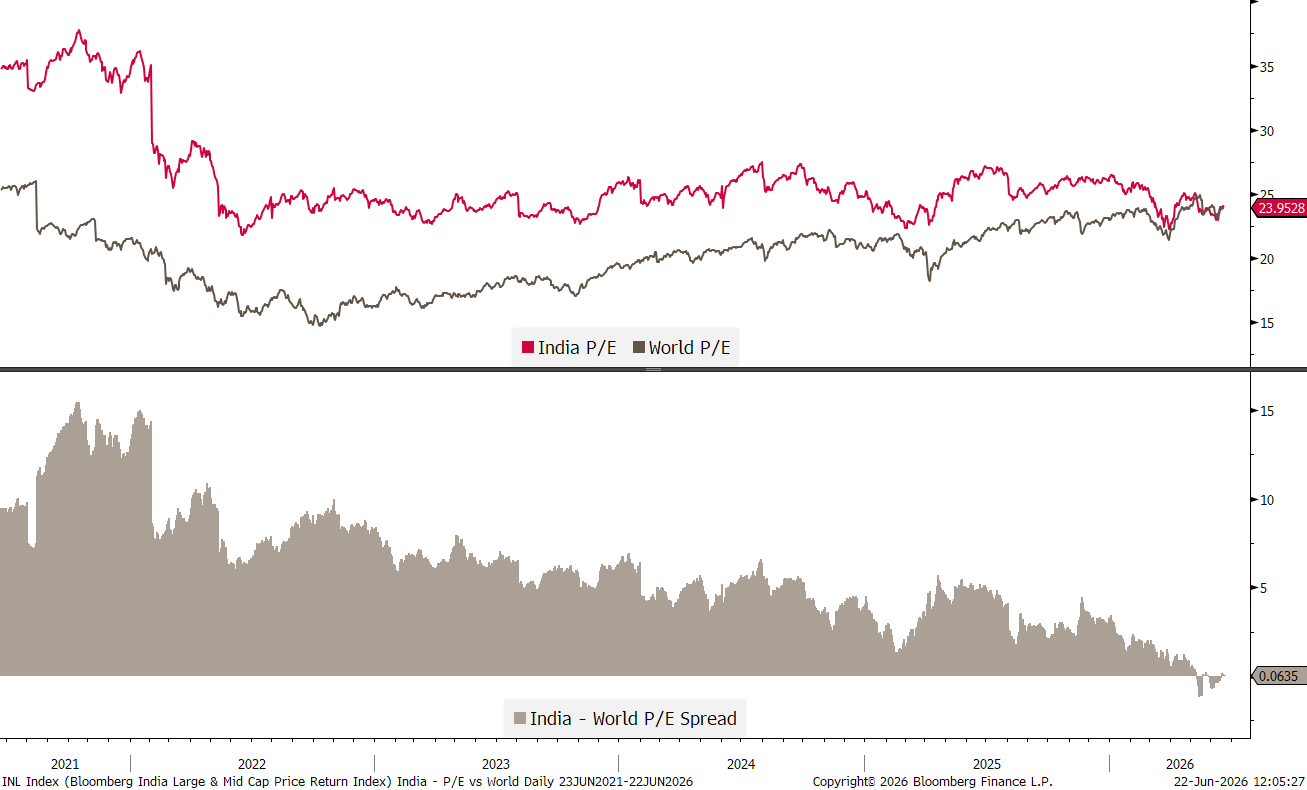
Lastly, in terms of valuation, India’s equity market now looks minimum fair value in absolute and relative terms:
Want to know how we invest in this potential, early-stage turnaround story? Become a client 😜
In terms of sector performance, here’s what our proprietary aReS-model suggests to hold (top) and what not (bottom):
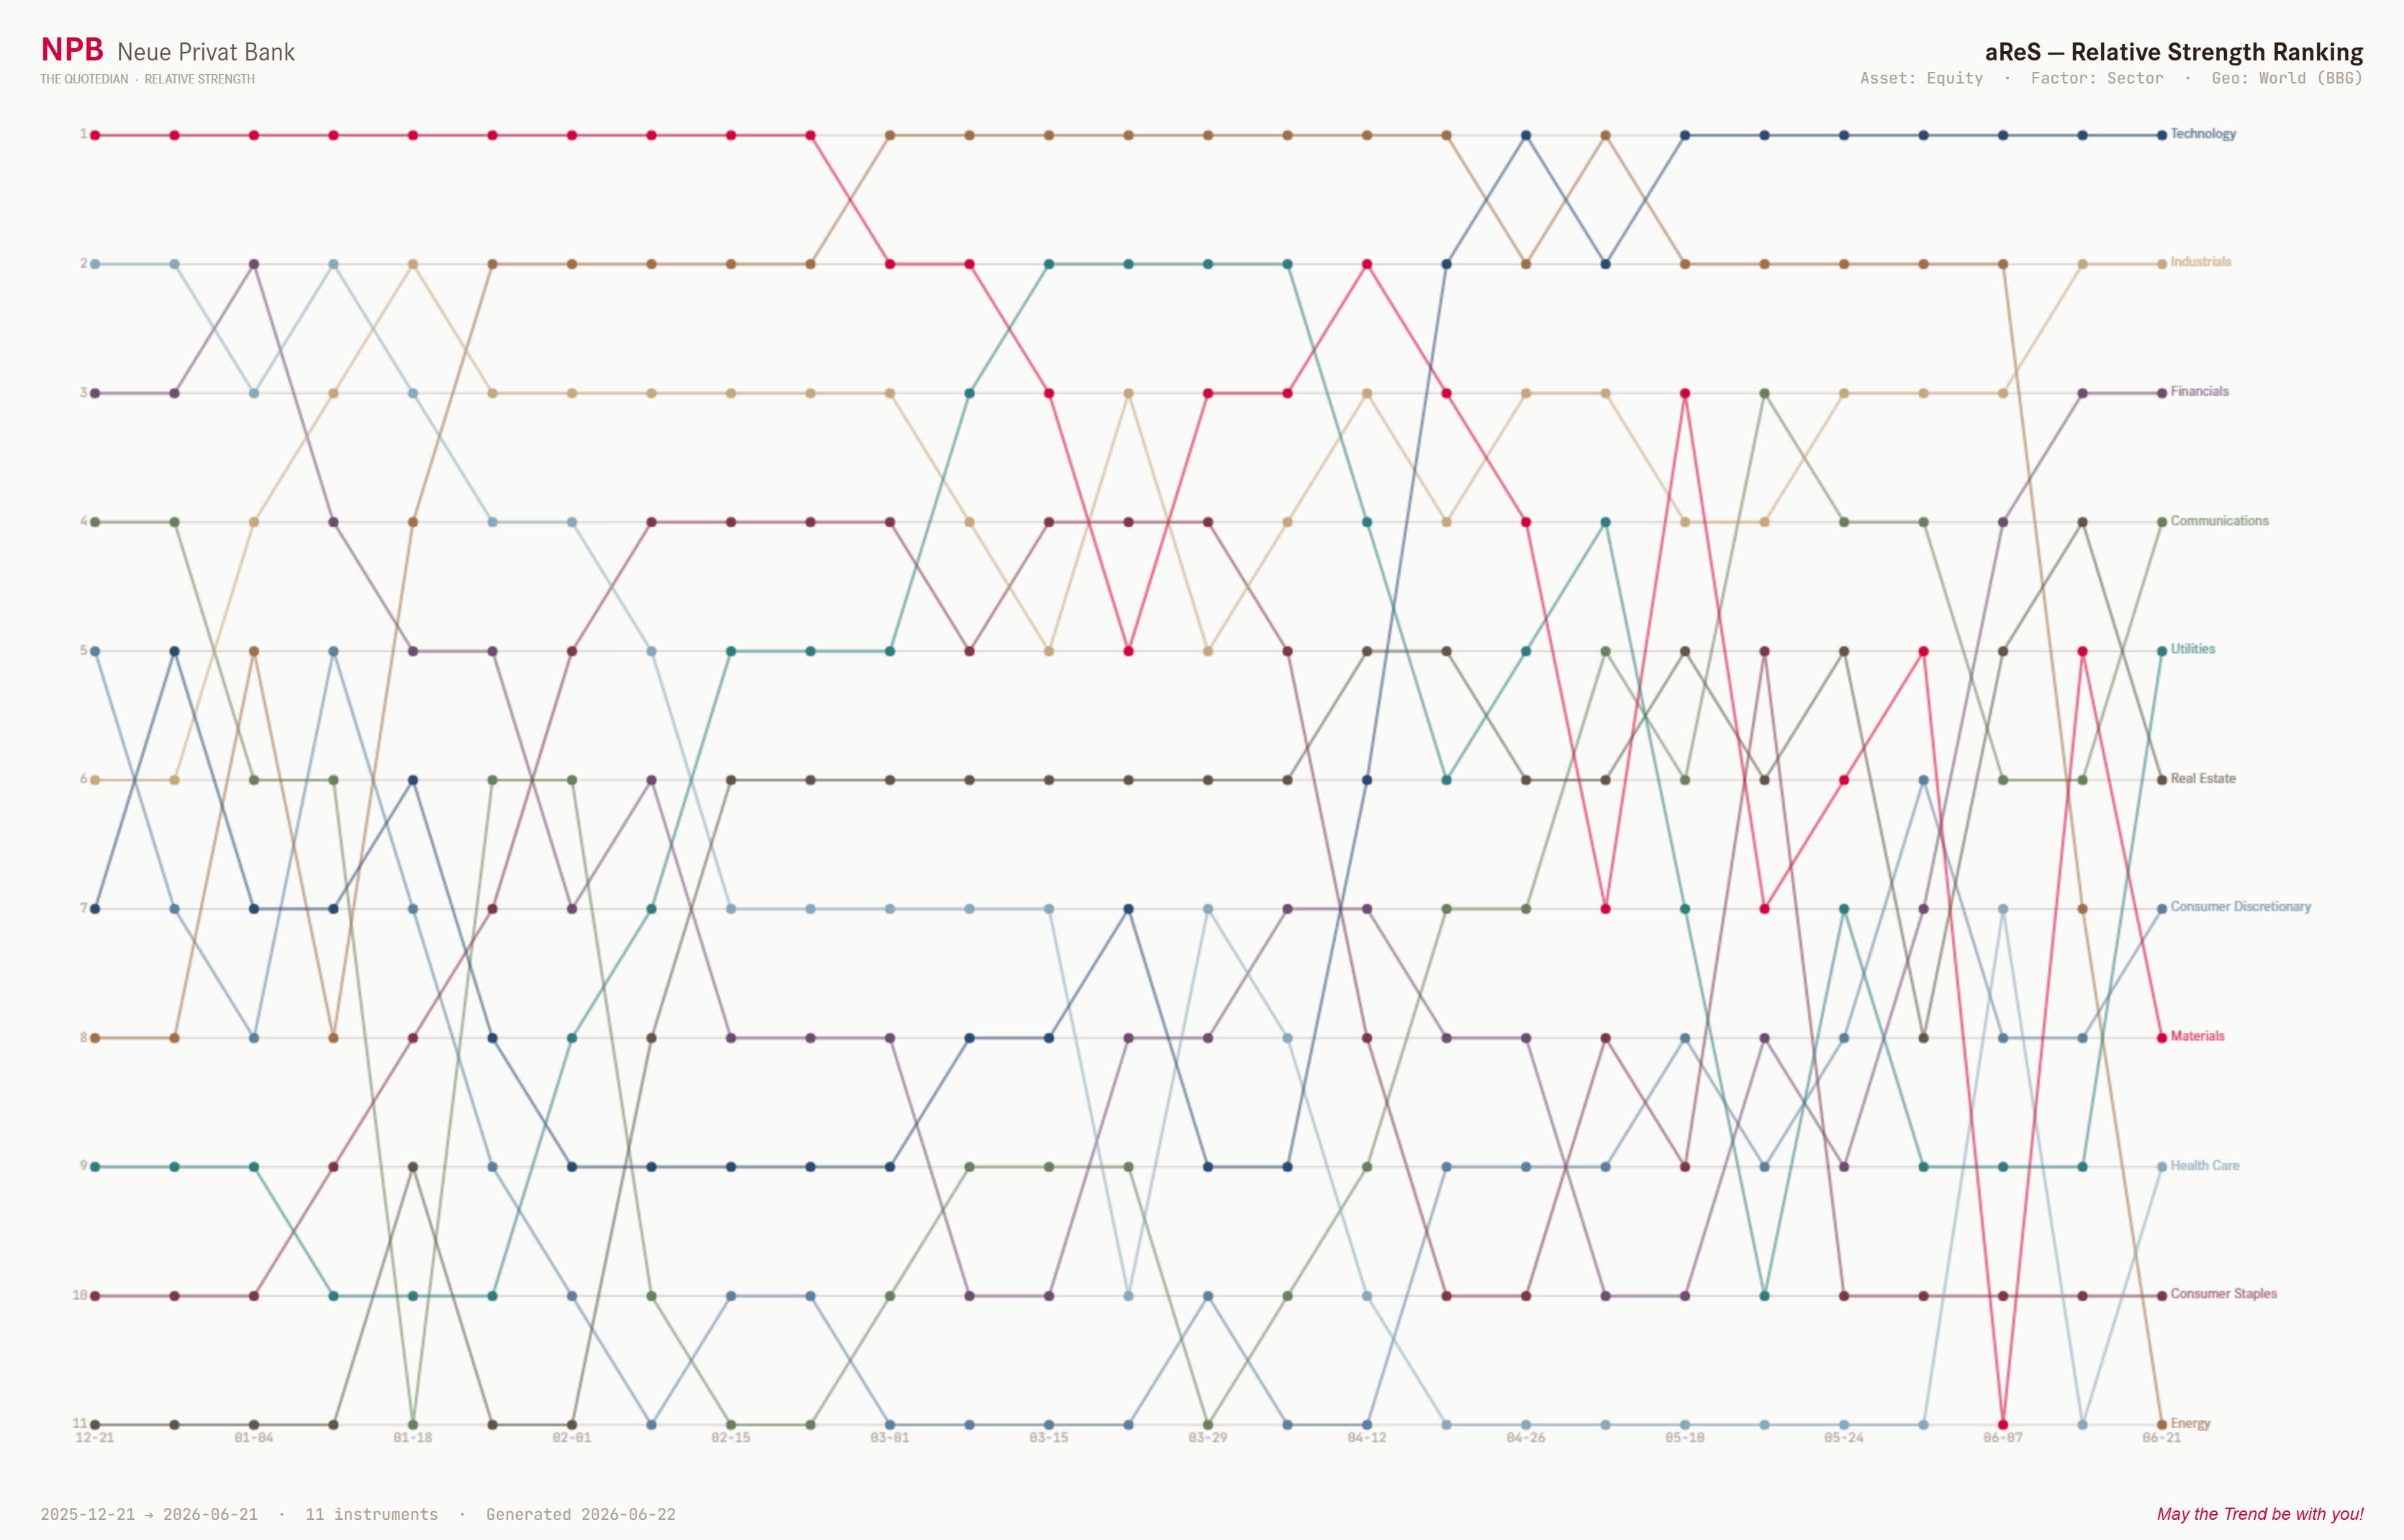
One important note on Energy stocks, which have fallen hard given the geopolitical “calmation” of matters and now make up the bottom of the barrel (pun intended) ….
Whilst the oil price has dropped and the SPDR Energy ETF is on the verge of a breakdown,
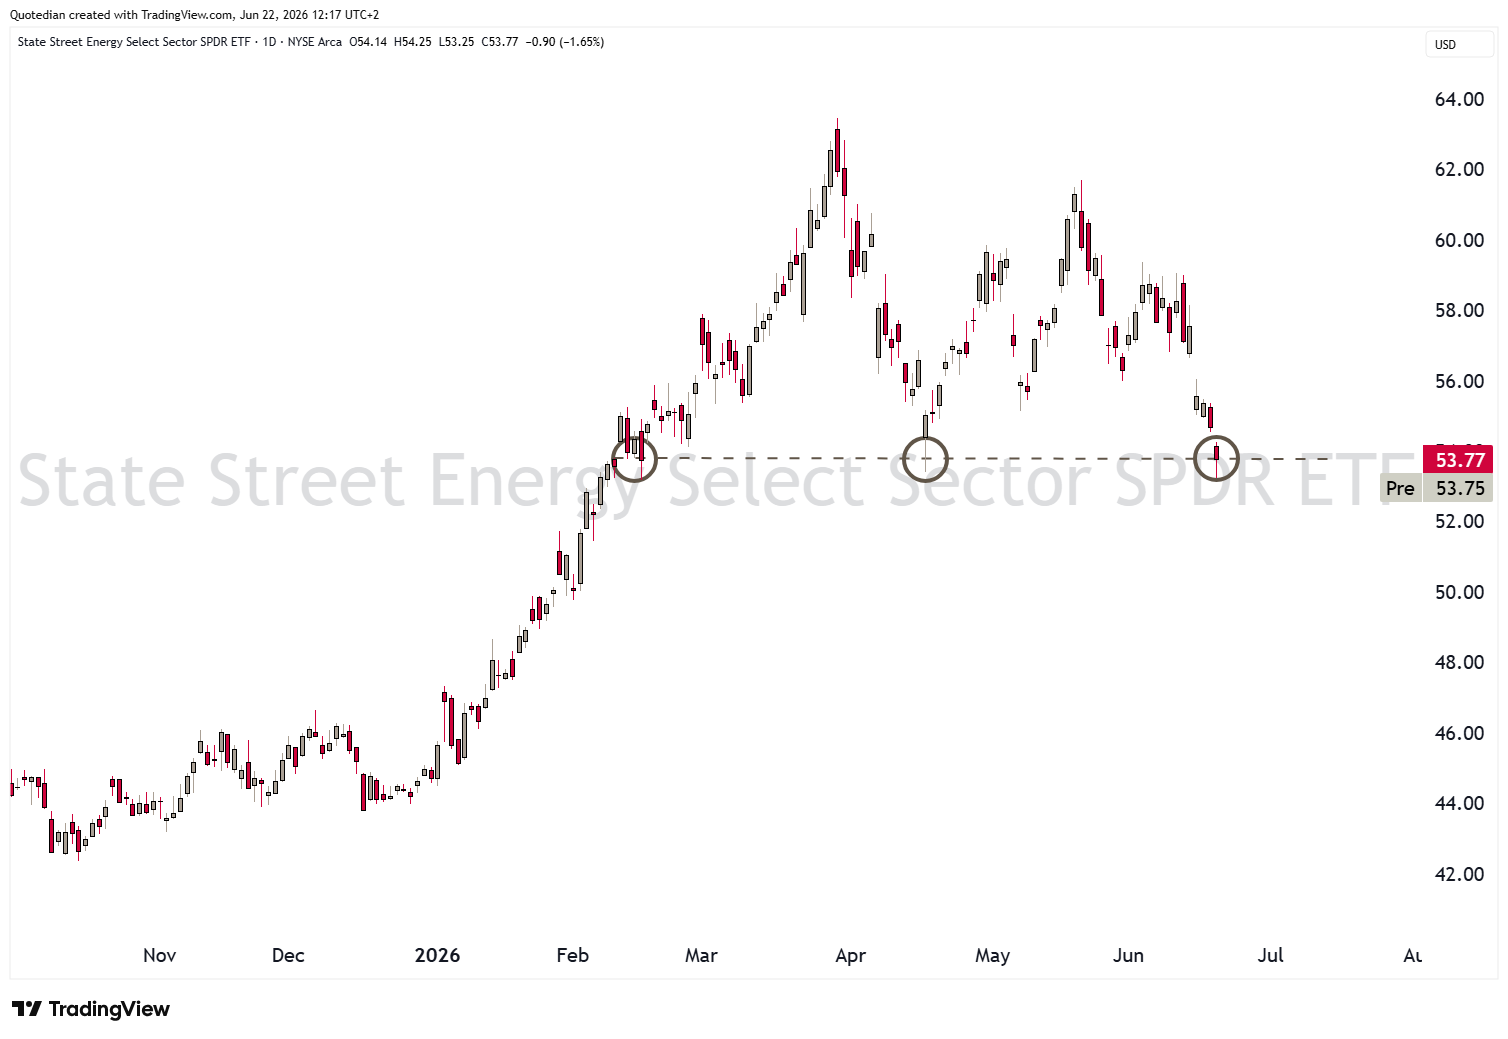
we would not completely give up on the sector, given that the oil price is still higher than a year ago, valuation and dividend metrics continue to be very ok AND geopolitical tensions are not likely to go away in our multipolarity scenario.
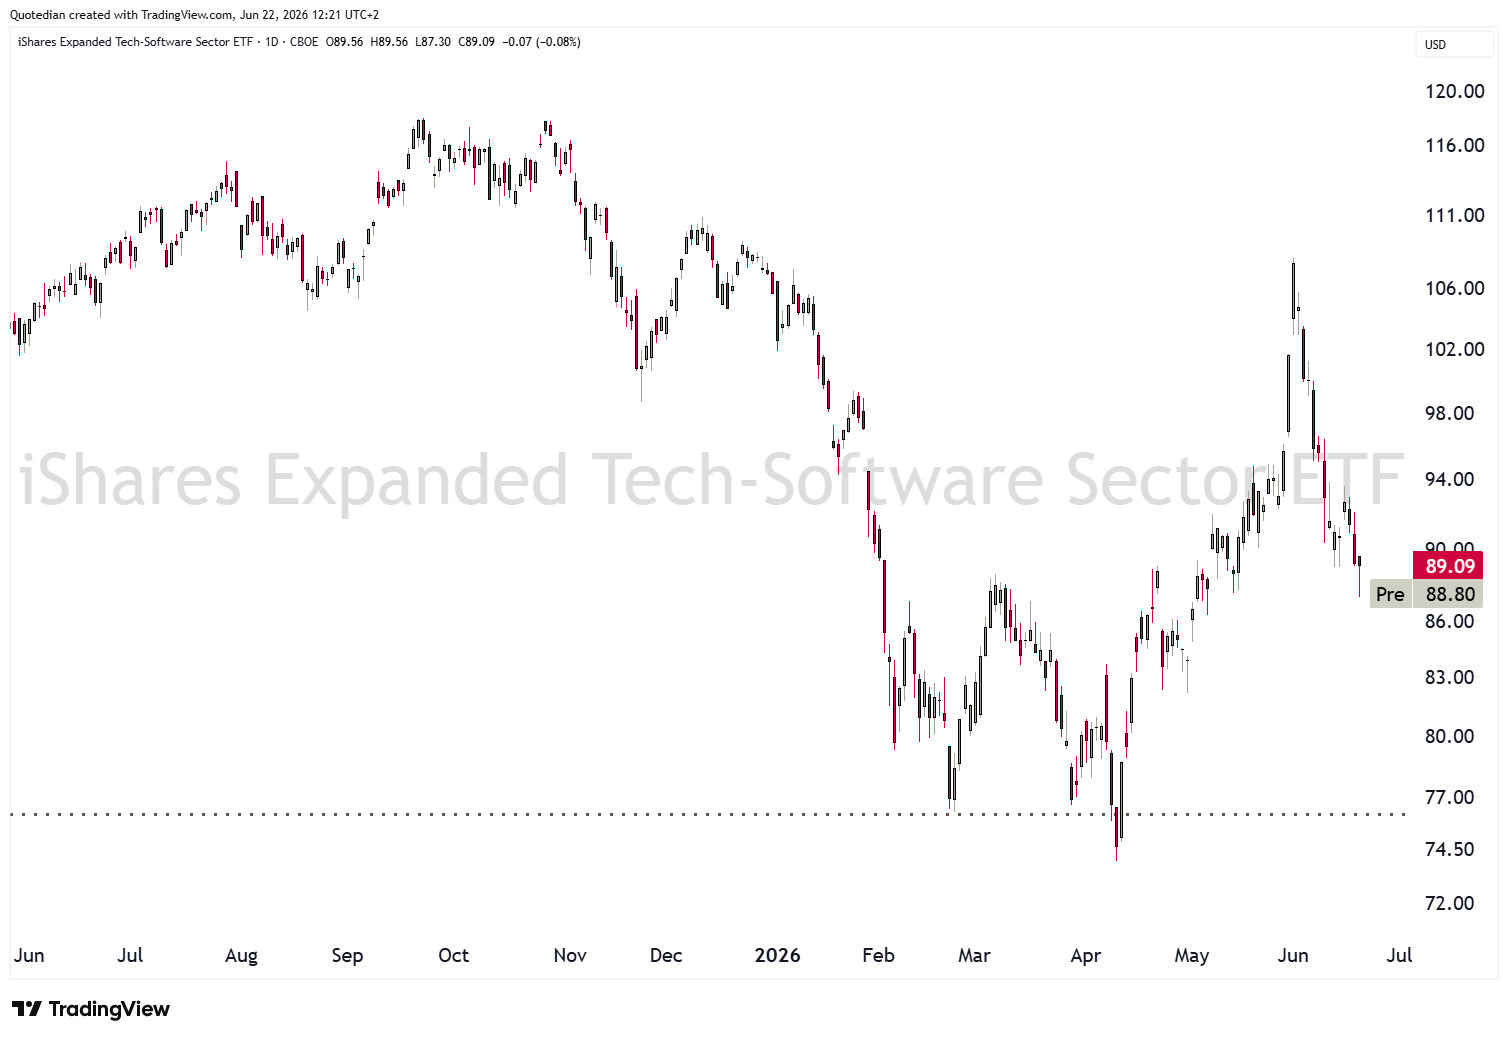
Where we would NOT buy into is the software (SAAS) sector, where the dead cat’s bounce seems to have ended abruptly:
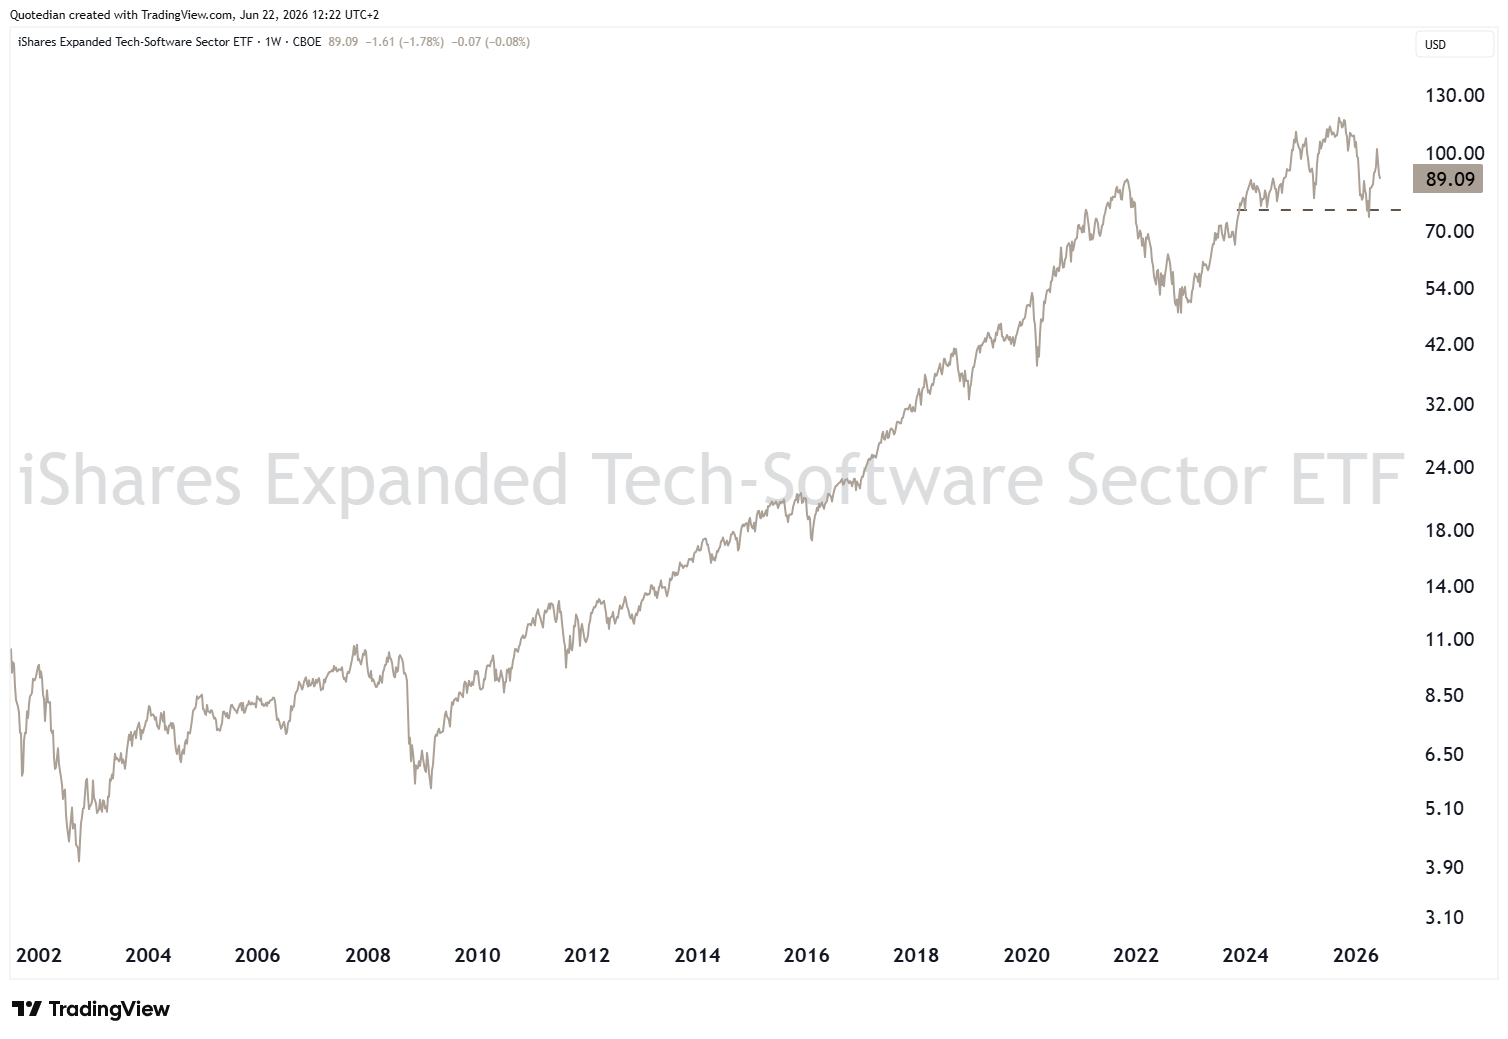
The long-term chart of the same illustrates technical downside potential should support be broken:
And then to finalise this week’s (as usual) too long letter, a few more charts covering currencies and commodities, which are currently all a function of the Greenback.
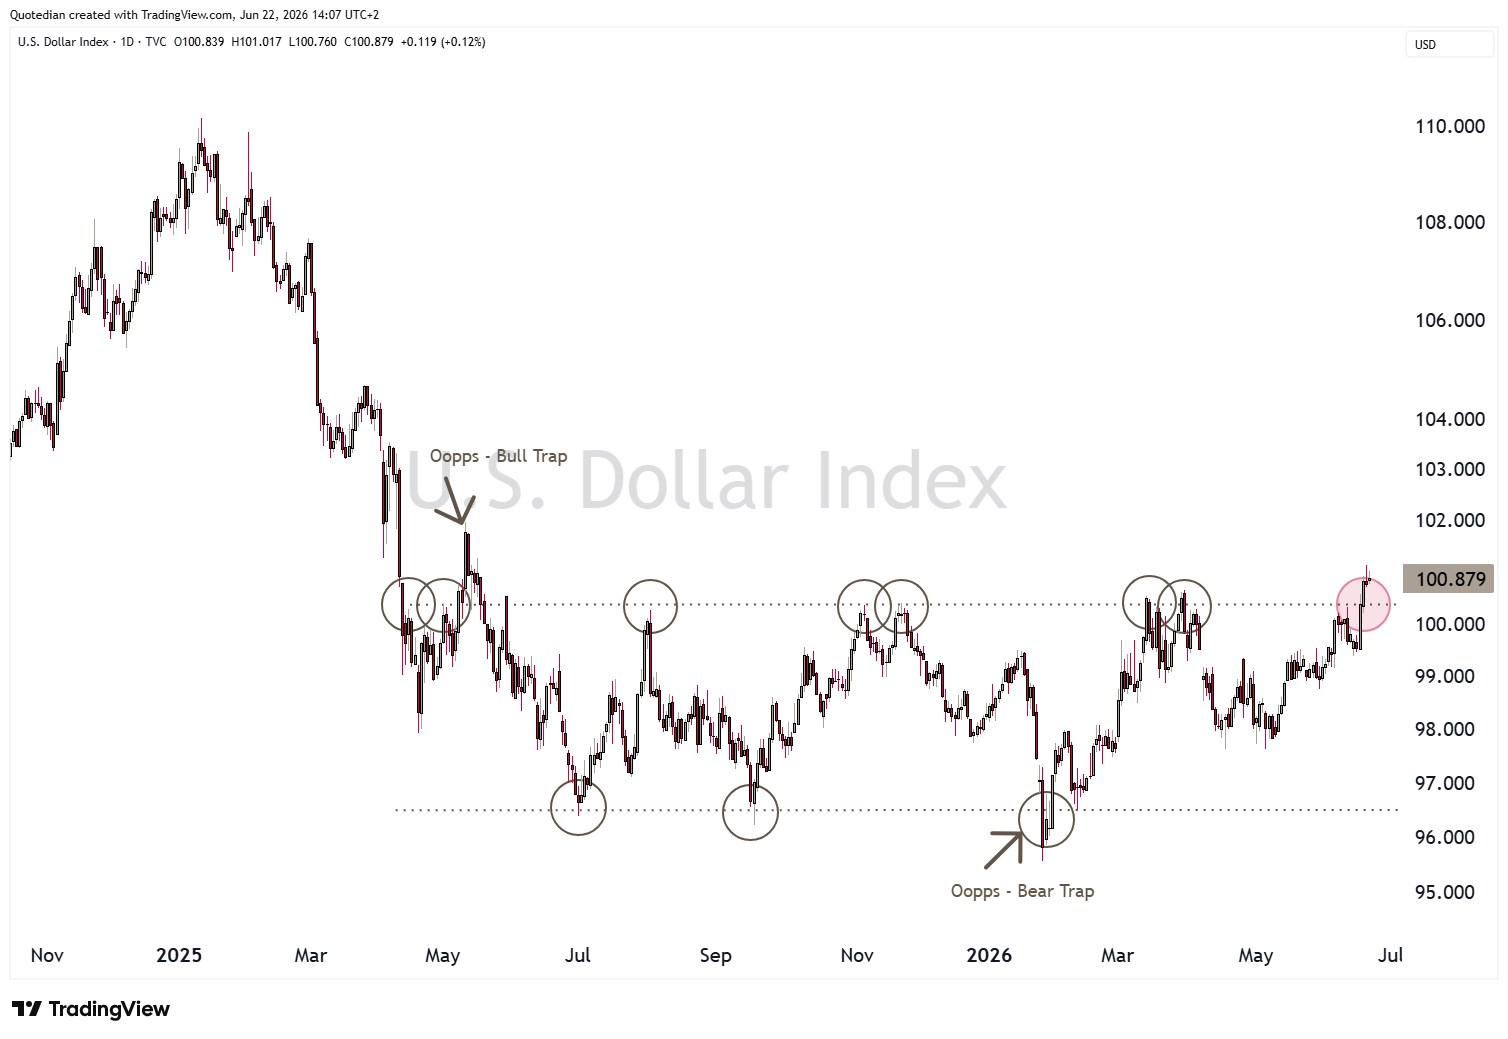
First, keep an eye on that US Dollar (DXY), which on (chart) paper has now broken out of its multi-month range:
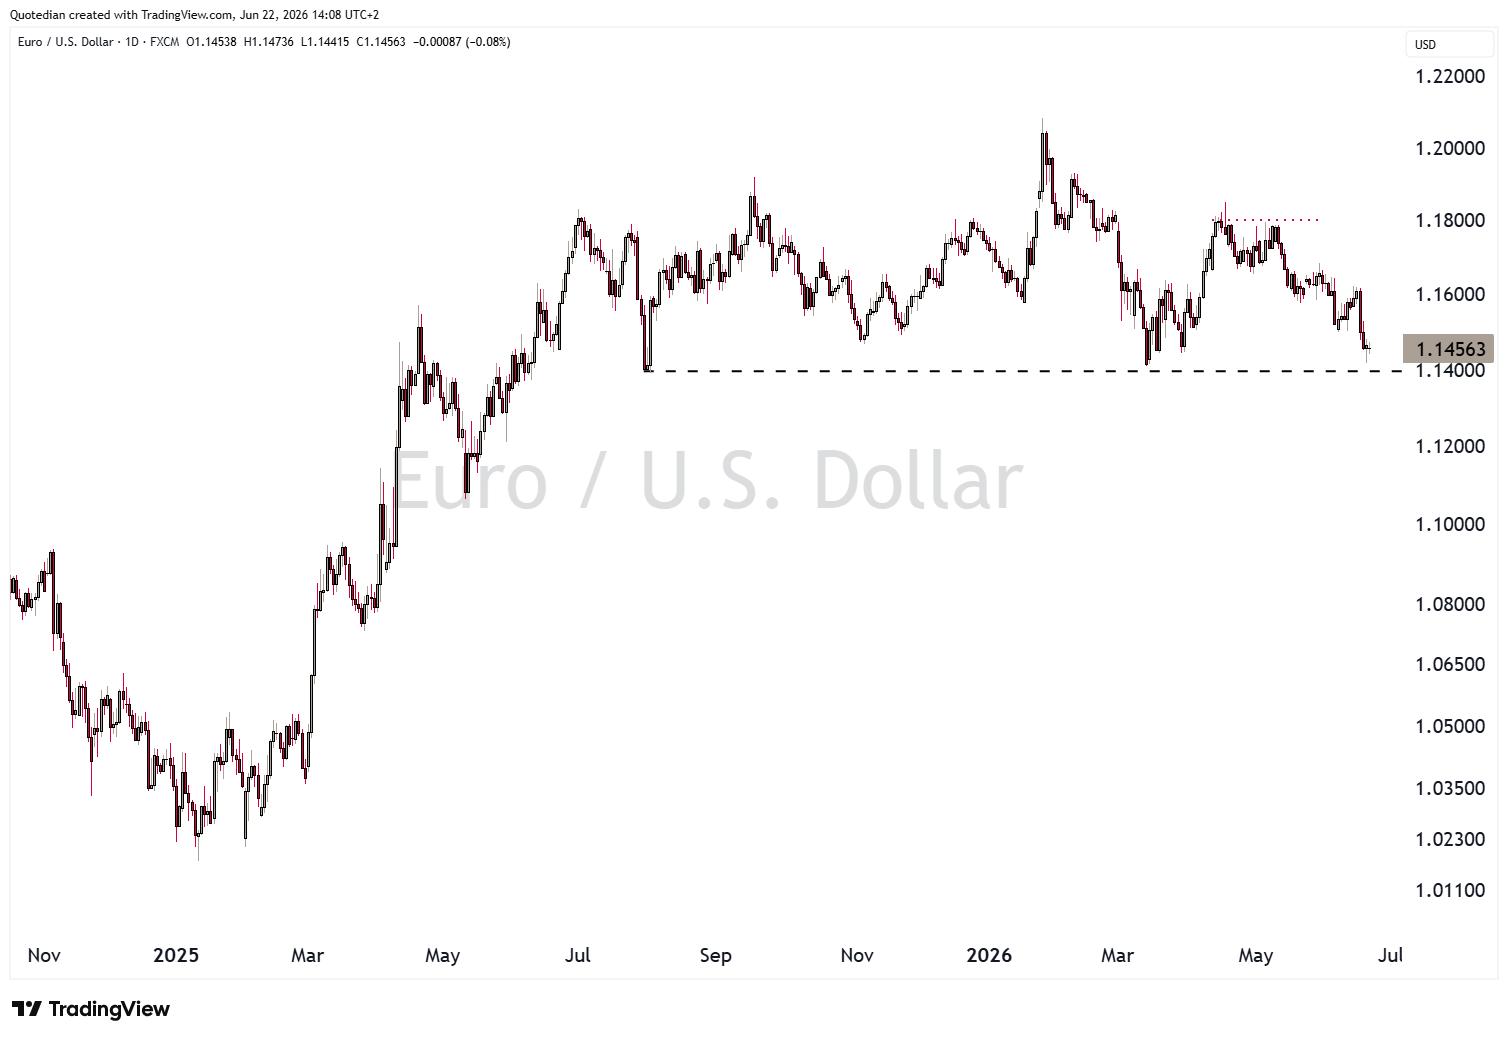
Whilst the EUR/USD cross is just about holding on to key support,
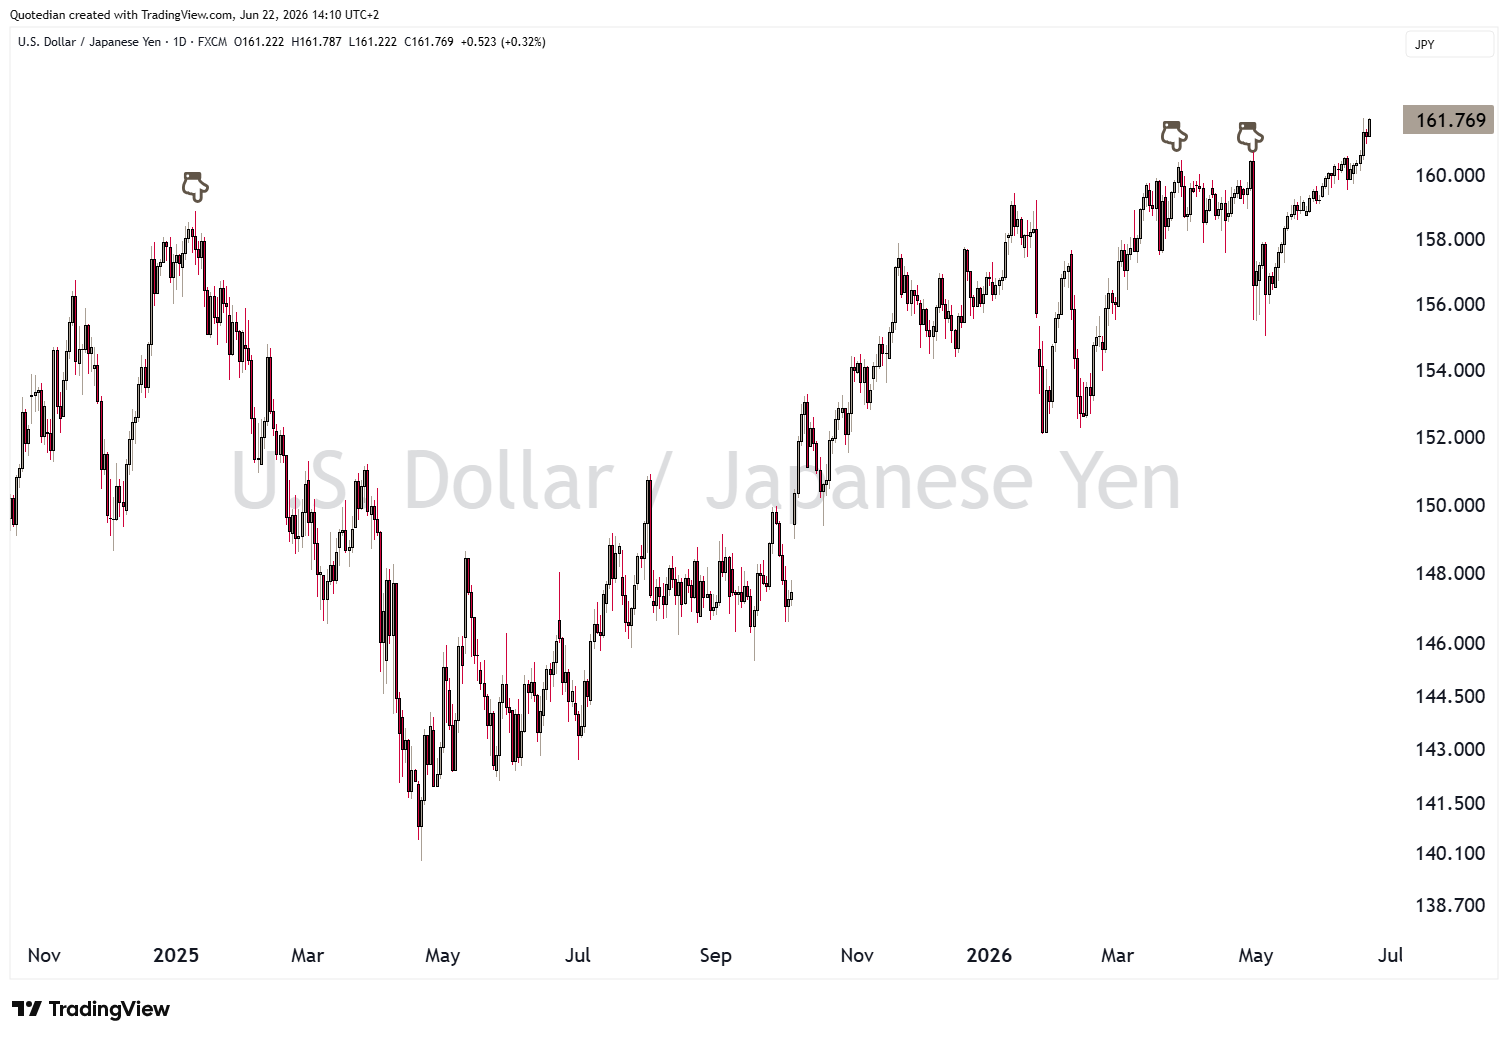
the USD/JPY currency pair now trades WAAYYYY above previous BoJ/MoF intervention levels:
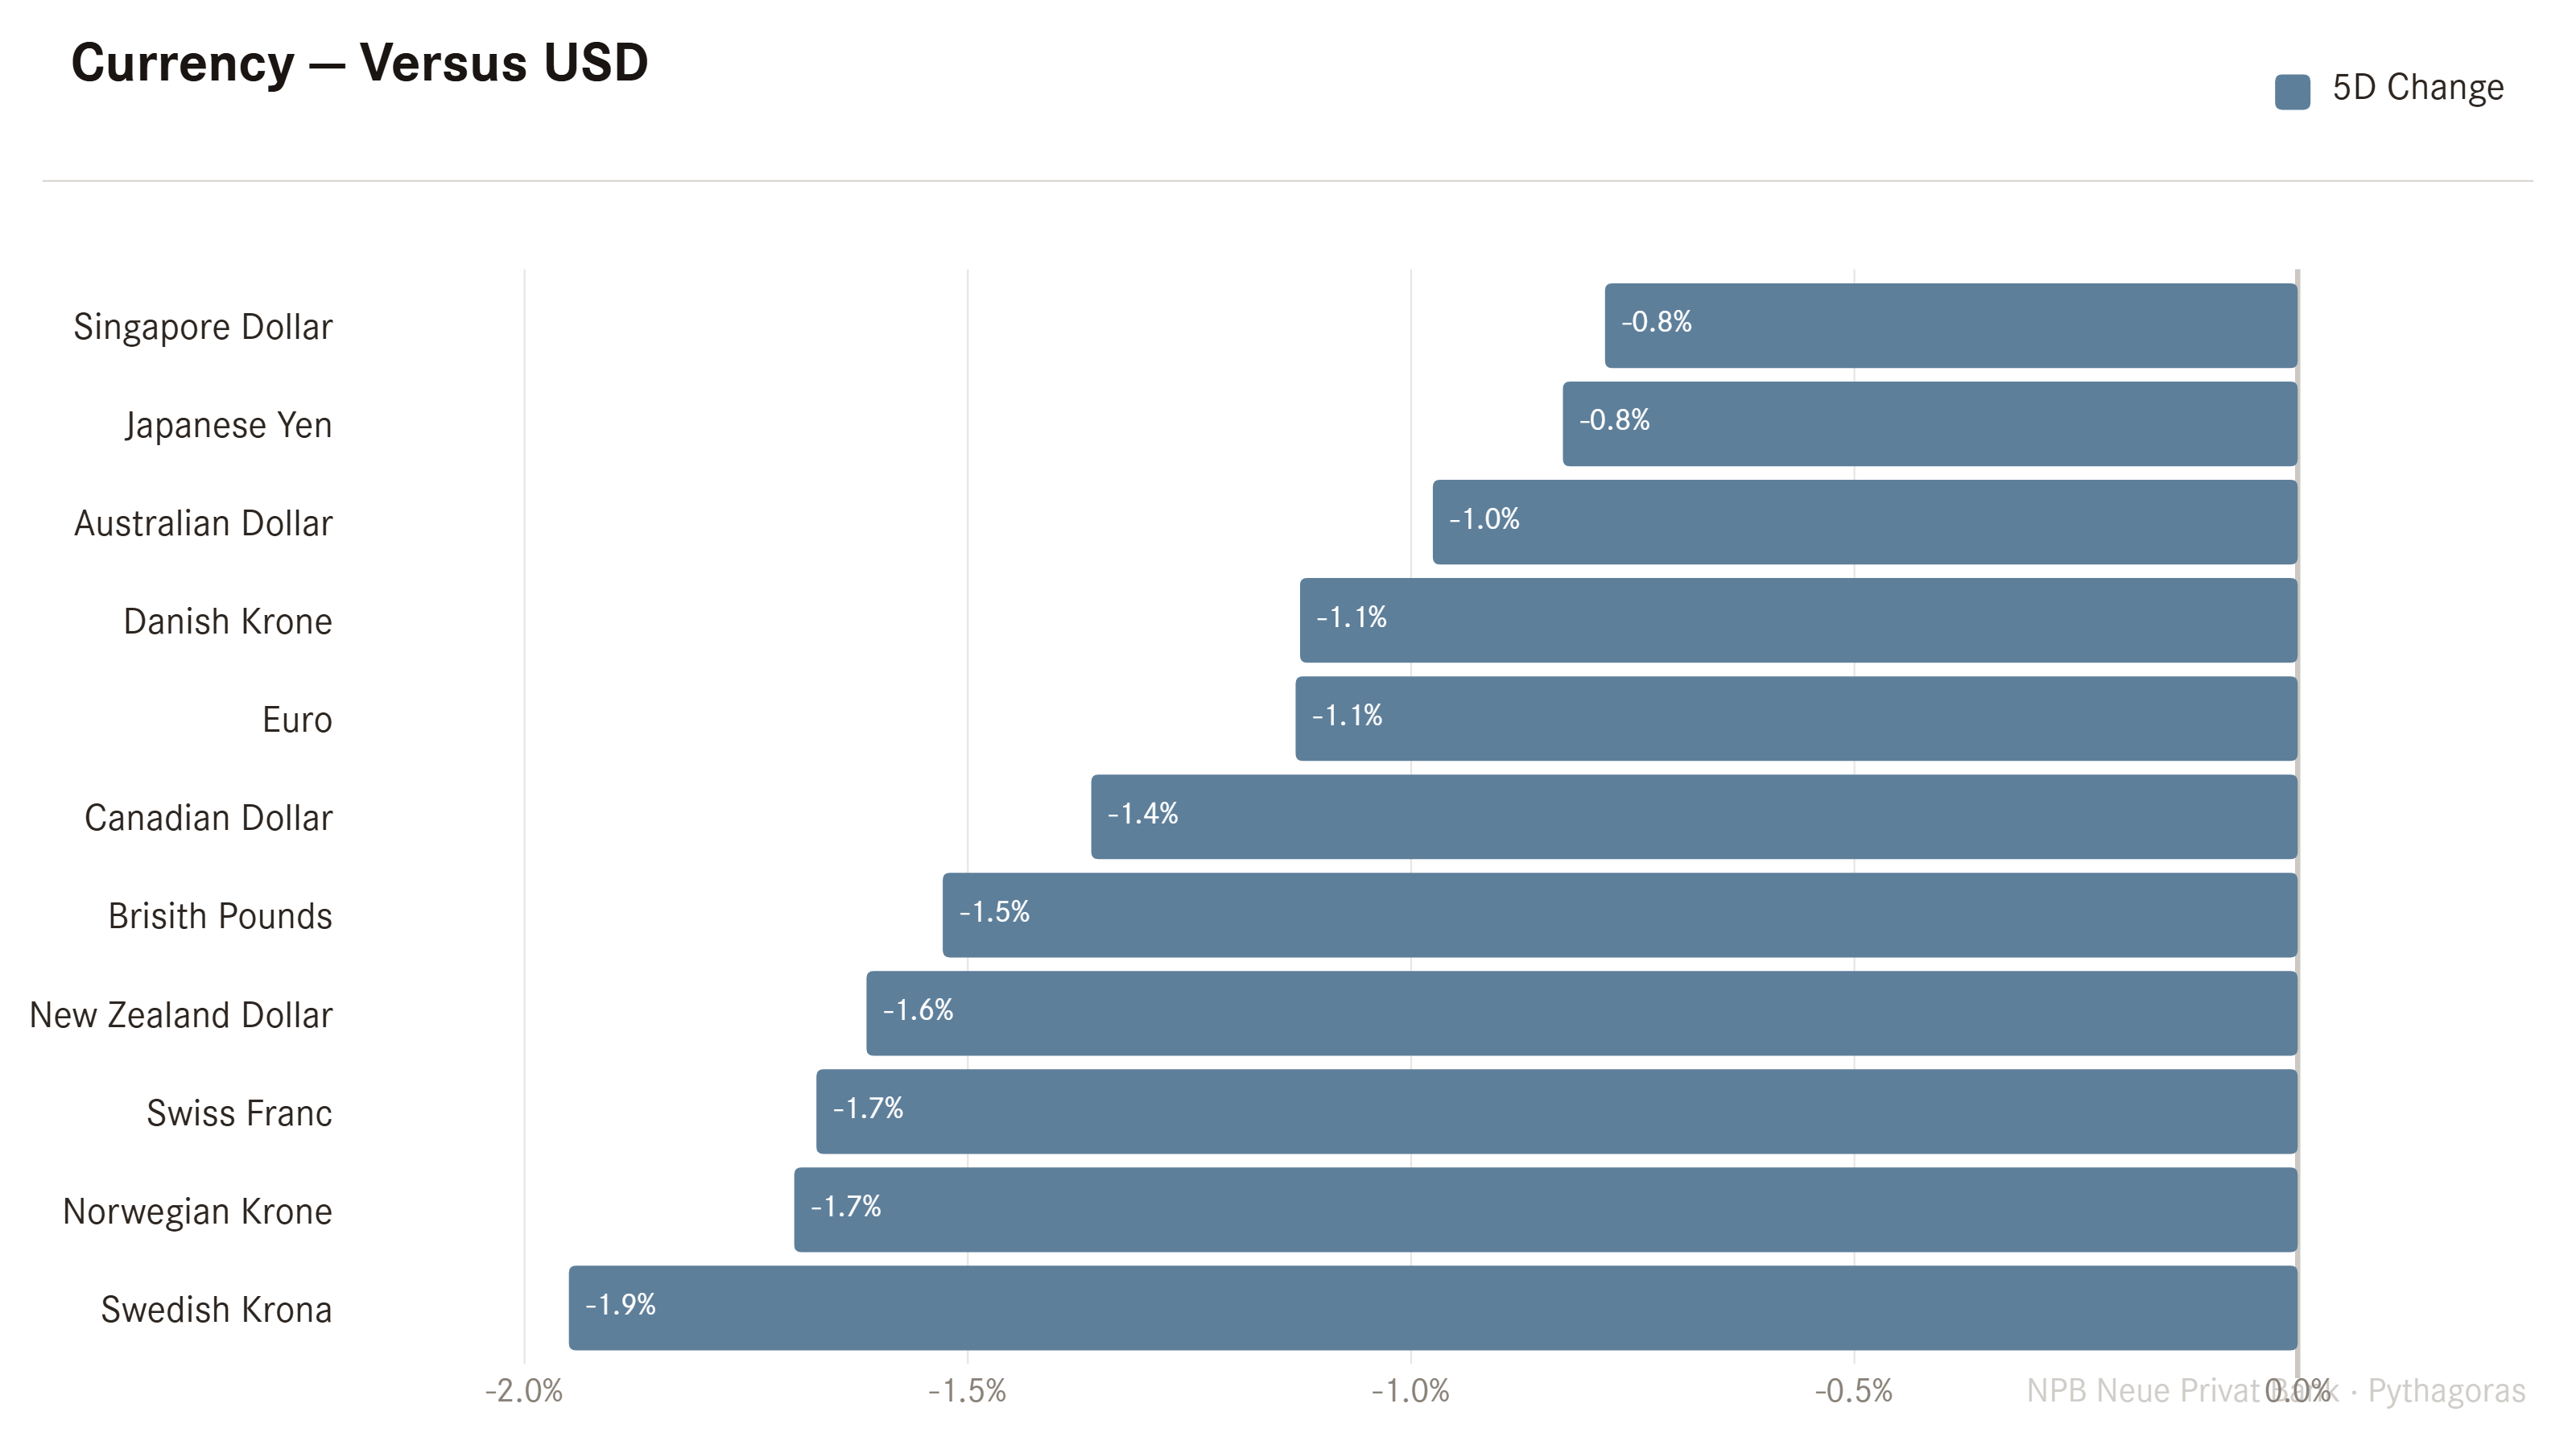
Whilst the USD strength over the past week, mostly likely all interest rate perspectives related, has been pronounced against all other majors,
it is probably most visible versus Gold:
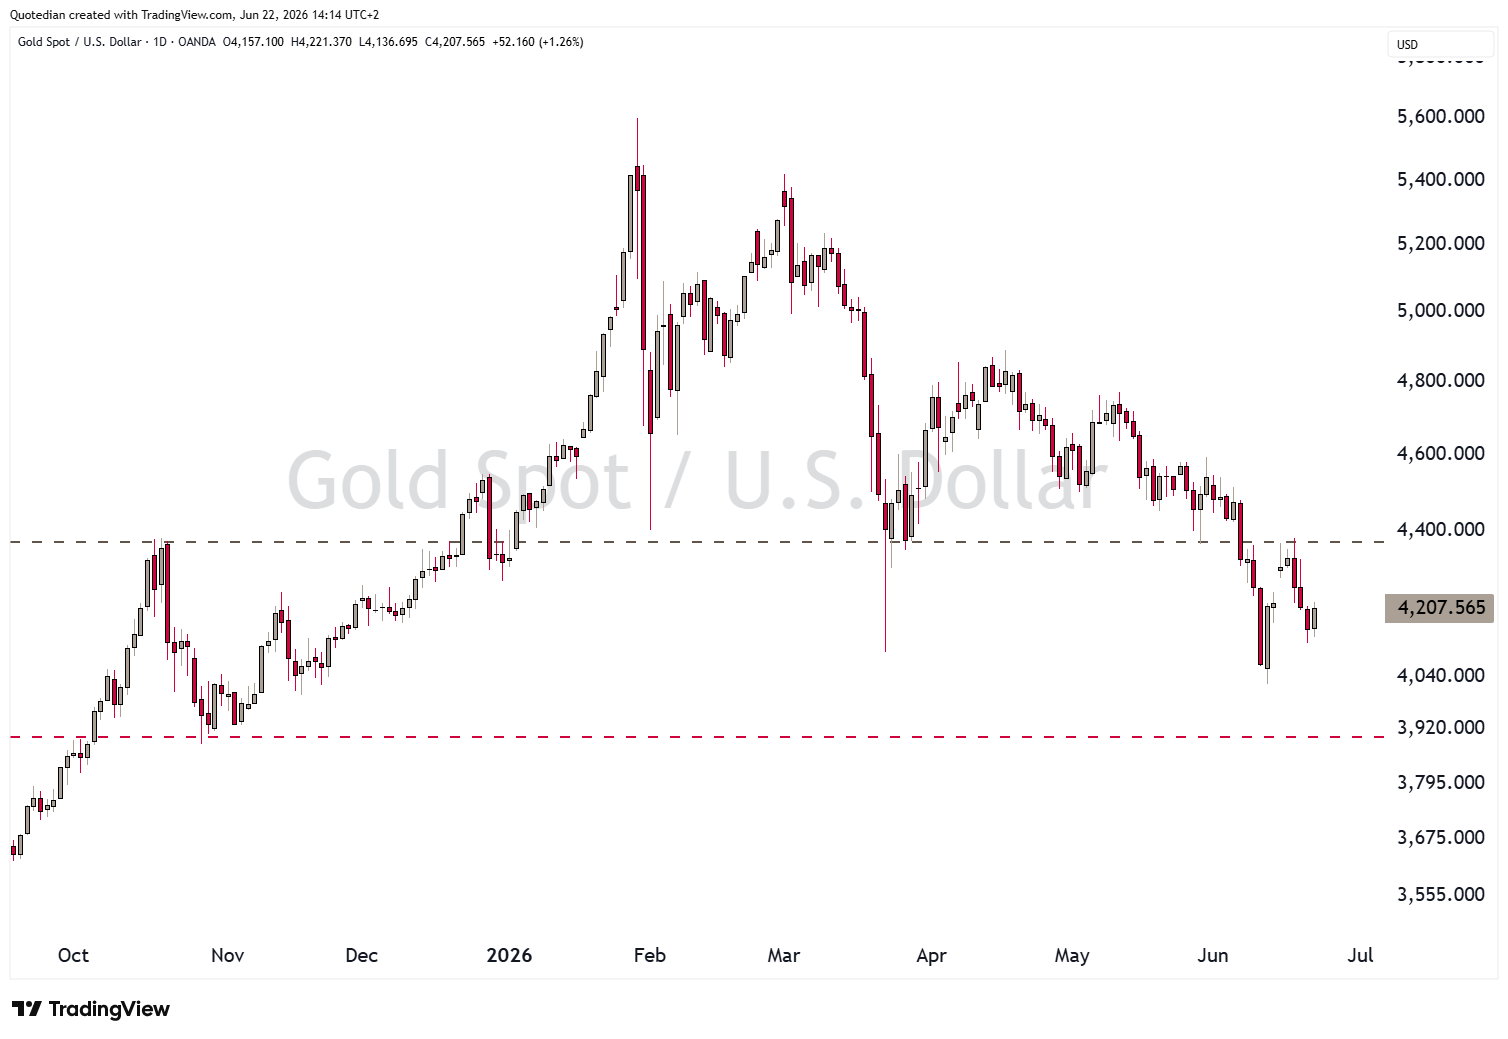
Hence, our underweight Gold call is paying off nicely and the chart pattern has been close to “picture perfect”, with a break of the support line (grey dashed), a subsequent retest from the lower side (support turns into resistance, aka “Kiss of Death”) and finally the renewed turn lower, which should take the price of the yellow metal well below 4,000.

So, back to the introduction to this week’s letter:
1.
Of course, meanwhile talks have been ongoing this weekend at the nearly highest level of the US and the Iranian government on the beautiful Bürgenstock, Switzerland.

So far, so good it seems, which should provide some risk-on tailwind early in the week.
2.
Macro has become more important again over the past few years with central banks’ somewhat reduced intervention in financial markets. Warsh just did the next step in that process, by all but eliminating Forward Guidance and reintroducing the guessing game.

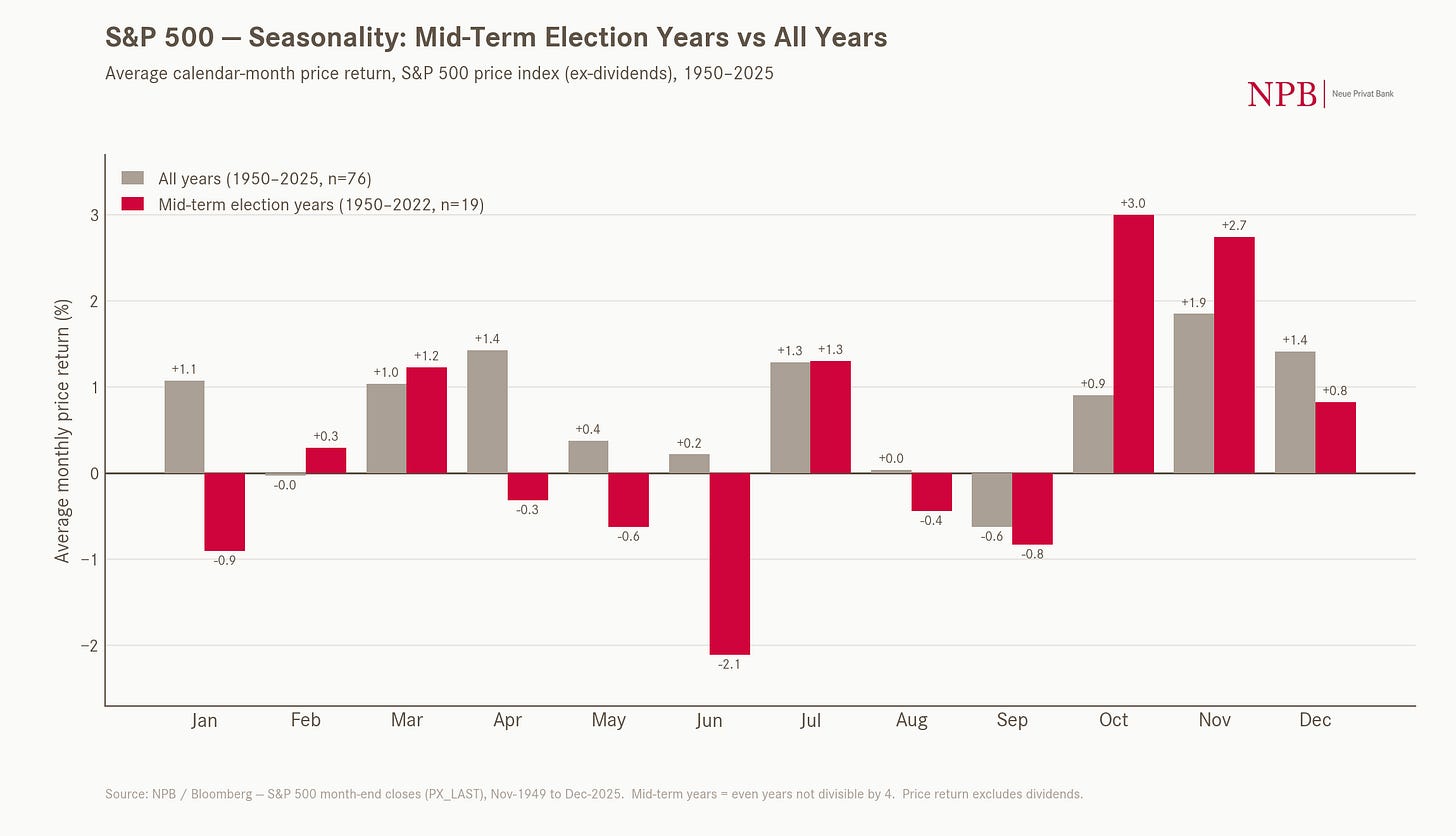
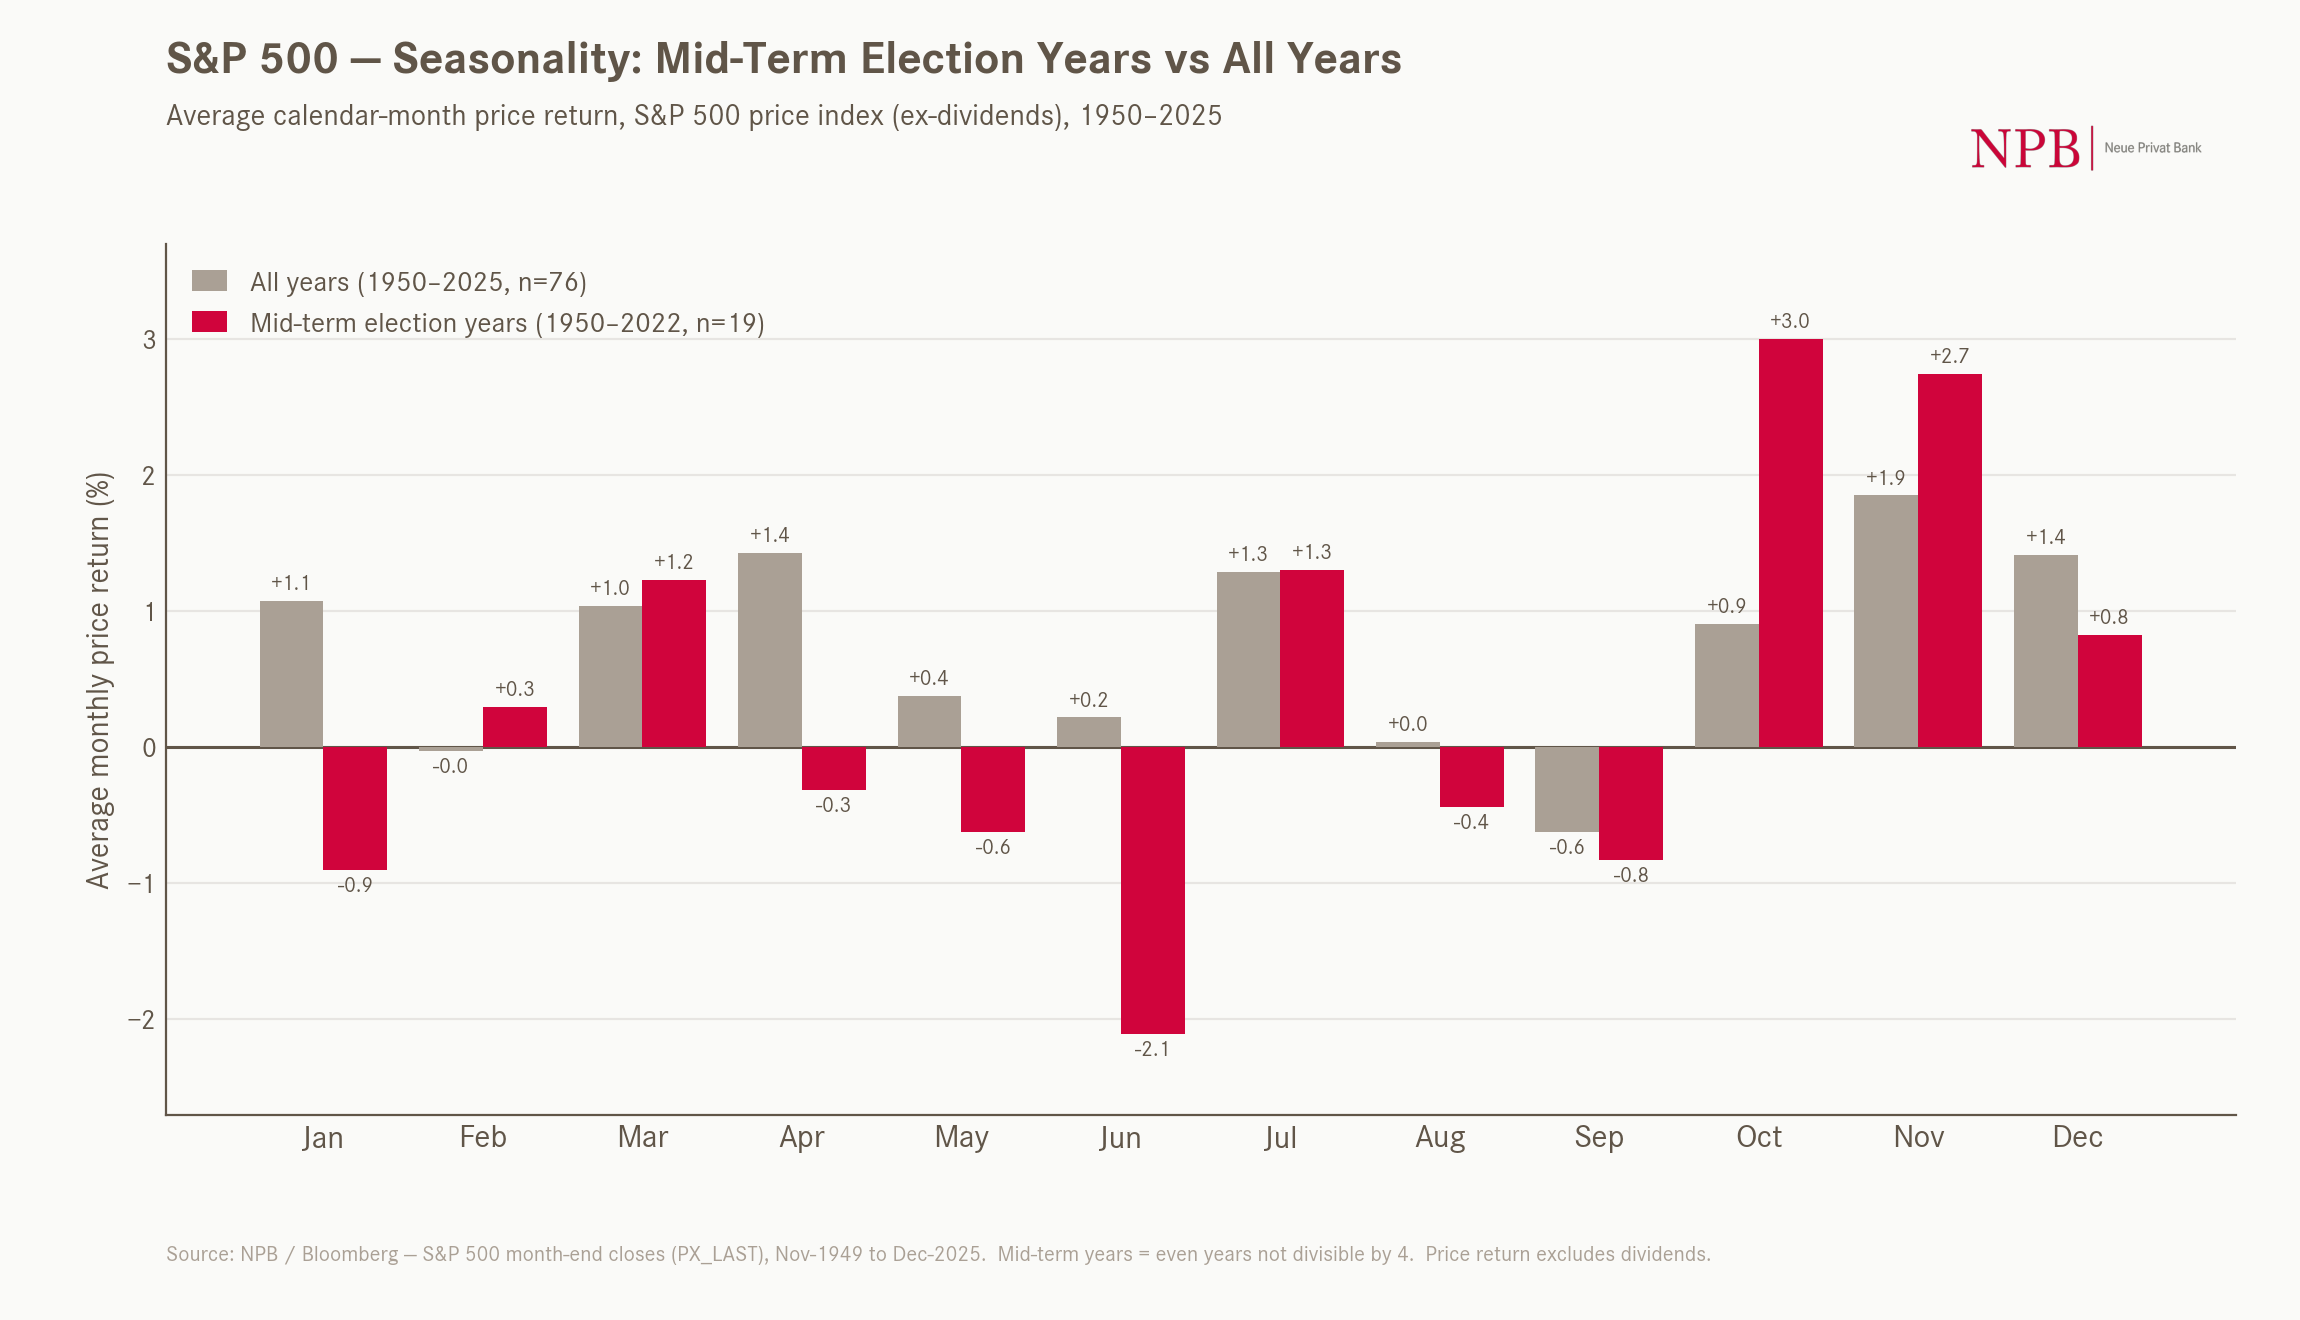
Equity markets are “small” range stuck right now. Watch those lines in the sand. The following chart would argue that stocks head higher in July on efforts by the Trump administration to “massage” the mid-term election, whilst dirt will be thrown around then in August and September:
Bond yields (prices) could move lower (higher) before resuming their secular uptrend (downtrend)
Keep an eye on the US Dollar
Stay out of Gold for now or take advantage of the volatility via option strategies
And last, but very far from least:
R.I.P. Alan Greenspan!

May the Trend be with You!
André

Everything in this document is for educational purposes only (FEPO)
Nothing in this document should be considered investment advice
Investing real money can be costly; don’t do stupid shit
Leave politics at the door—markets don’t care.
Past performance is hopefully no indication of future performance
The views expressed in this document may differ from the views published by NPB Neue Privat Bank AG