

Washington, We Have A Problem
Vol VIII, Issue 17 | Powered by NPB Neue Privat Bank AG
“The budget should be balanced, the treasury refilled, public debt reduced... lest Rome fall.”
— Cicero, 55 BC
Enjoying The Quotedian but not yet signed up for The QuiCQ? What are you waiting for?!!

Late on Friday evening, well after the closing bell had rung on Wall Street, we go this Breaking News item:
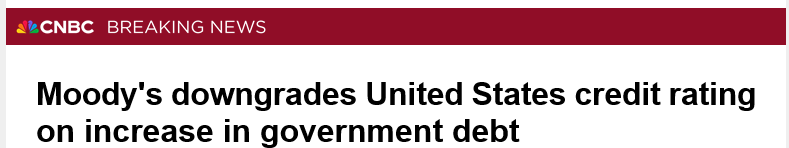
Moody’s downgraded the US debt rating from Aaa to Aa1 and put the outlook from negative to neutral. The agency expects the deficit to grow from 6.4% of GDP in 2024 to nearly 9% by 2035.
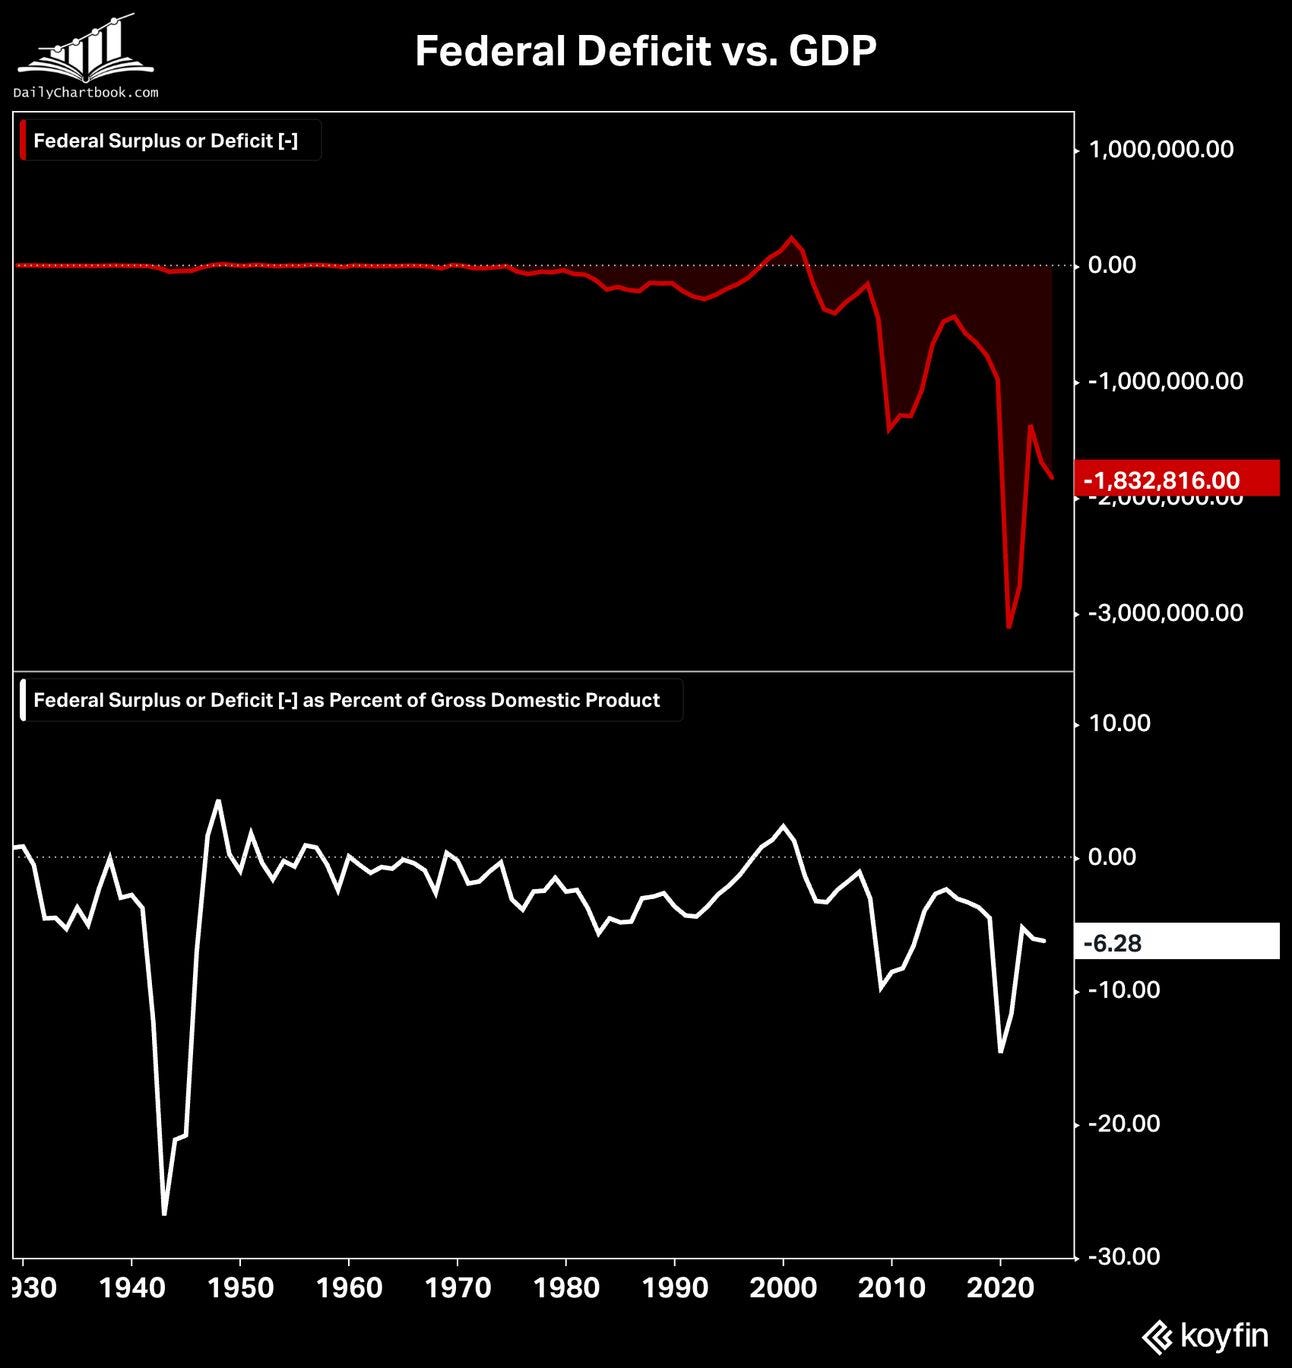
The one-notch cut comes more than a year after Moody’s changed its outlook on the US rating to negative. The federal budget deficit is running near $2 trillion a year, or more than 6% of gross domestic product, and Congressional Republicans are pushing through budget legislation that could add trillions of dollars more. “While we recognize the US’ significant economic and financial strengths, we believe these no longer fully counterbalance the decline in fiscal metrics,” Moody’s wrote in a statement.
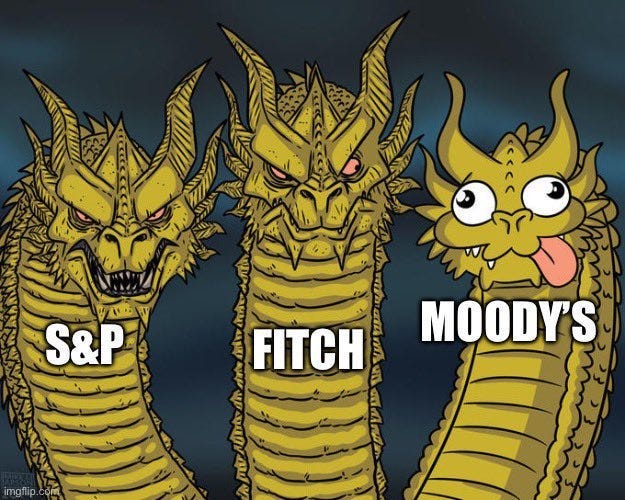
All truth being told, Moody’s was the last remaining major credit rating institute with a Triple-A rating on US debt, with S&P being the first ‘downgrader’ over 14 years ago in 2011, making Moody’s look a bit the odd one standing out:
So, what happend to stocks nearly 14 years ago? The S&P 500 dropped more than 6% the following day, but then put an intermediate bottom in place:
And bonds? Oddly enough, yields did not rise:
What should we expect this time around? Let’s go through the different asset classes and try to put everything into context of the current market environment.

How will the stock market react to the US debt downgrade? It actually shouldn’t, but given one of the speediest recovery rallies after a 20%+ drop, taking everyone and his mother by surprise, it may be a welcome excuse to take some chips off the table:
The 21% drop followed by the 24% rise is as always a good reminder of this:

On the Nasdaq 100, we have moved into tactically overbought territory (RSI):
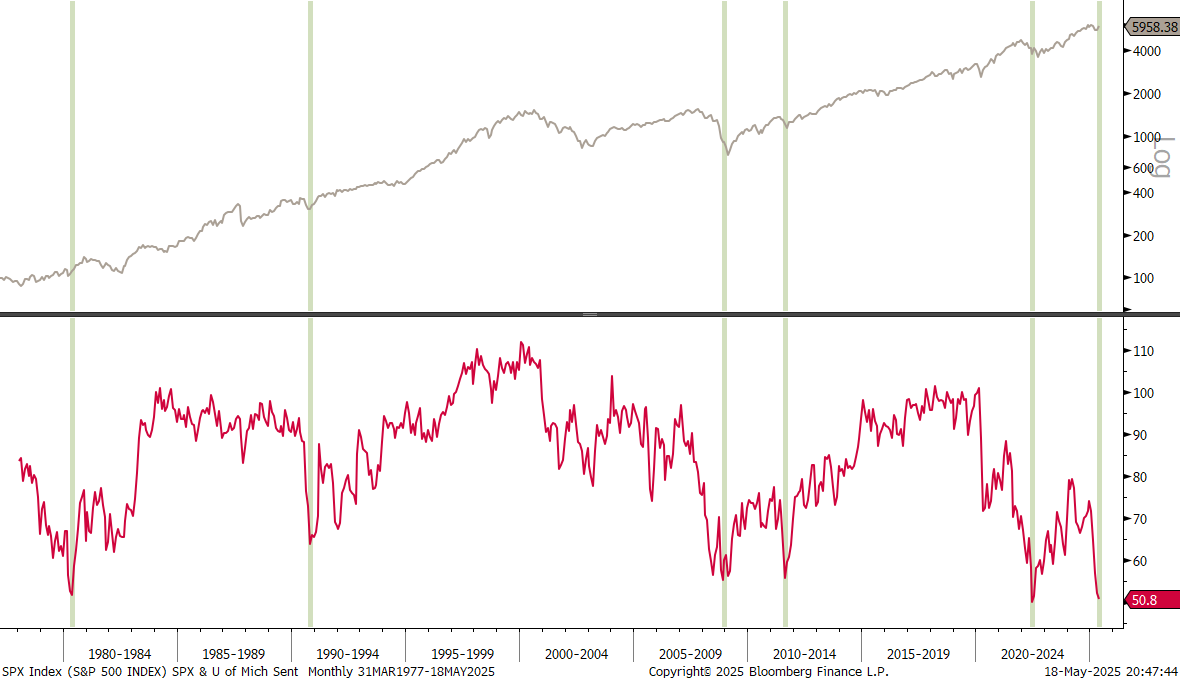
Having said that, consumer sentiment as surveyed by the University of Michigan, was reported at 50.8 well below expectations (53.4) and at one of the lowest levels on record. Such depressed sentiment readings have been pretty decent equity buy signals over the past fifty years:
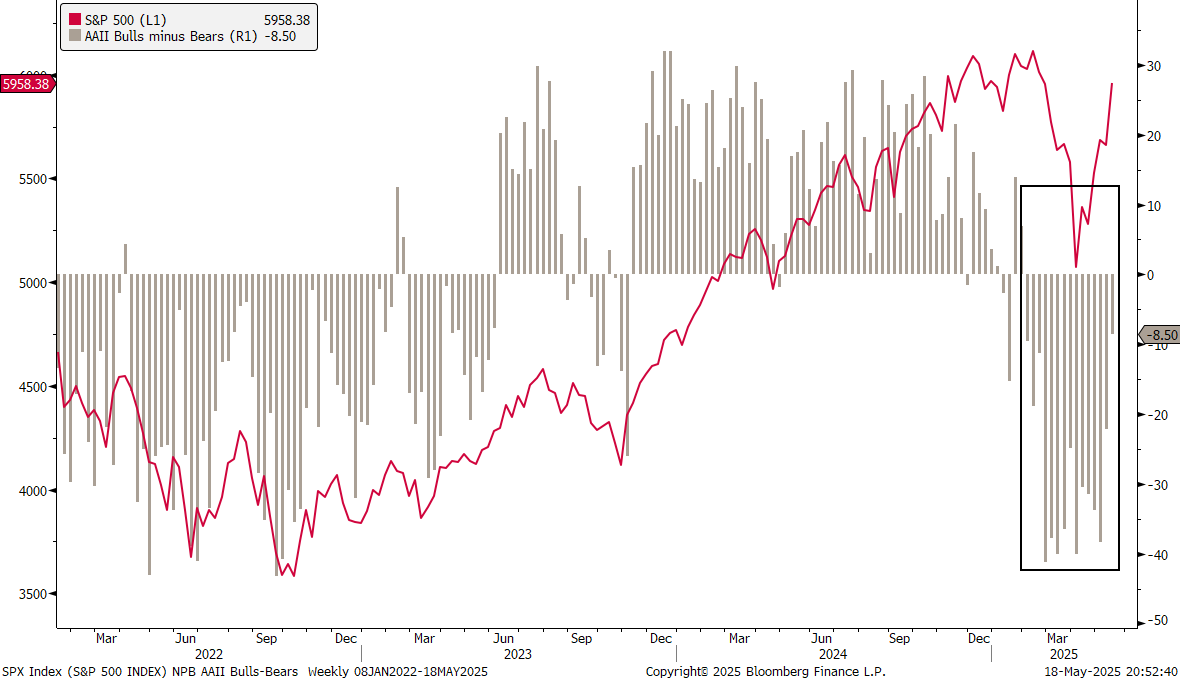
Similarly, retails investors’ sentiment has been now negative a record-breaking 14 weeks, which could provide additional tailwind to the rally:
Small cap stocks made a technically super-important new recovery high and should continue to do well over the coming months:
Whatever tomorrows (Monday, 19.5.) reaction to the debt downgrade, it is probably safe to continue to bet on exodUS and overweight non-US markets. Der Dax just clocked in a new all-time high on Friday:
The broad, pan-European STOXX 600 index (SXXP) needs less than three percent to achieve the same milestone:
Comparing non-US stocks to US equities via a ratio of the iShares MSCI EAFE ETF (EFA) to the Vanguard Total Market ETF (VTI) raises the question whether the trend change is for real this time, or is just another head fake as back in Q2 of 2023?
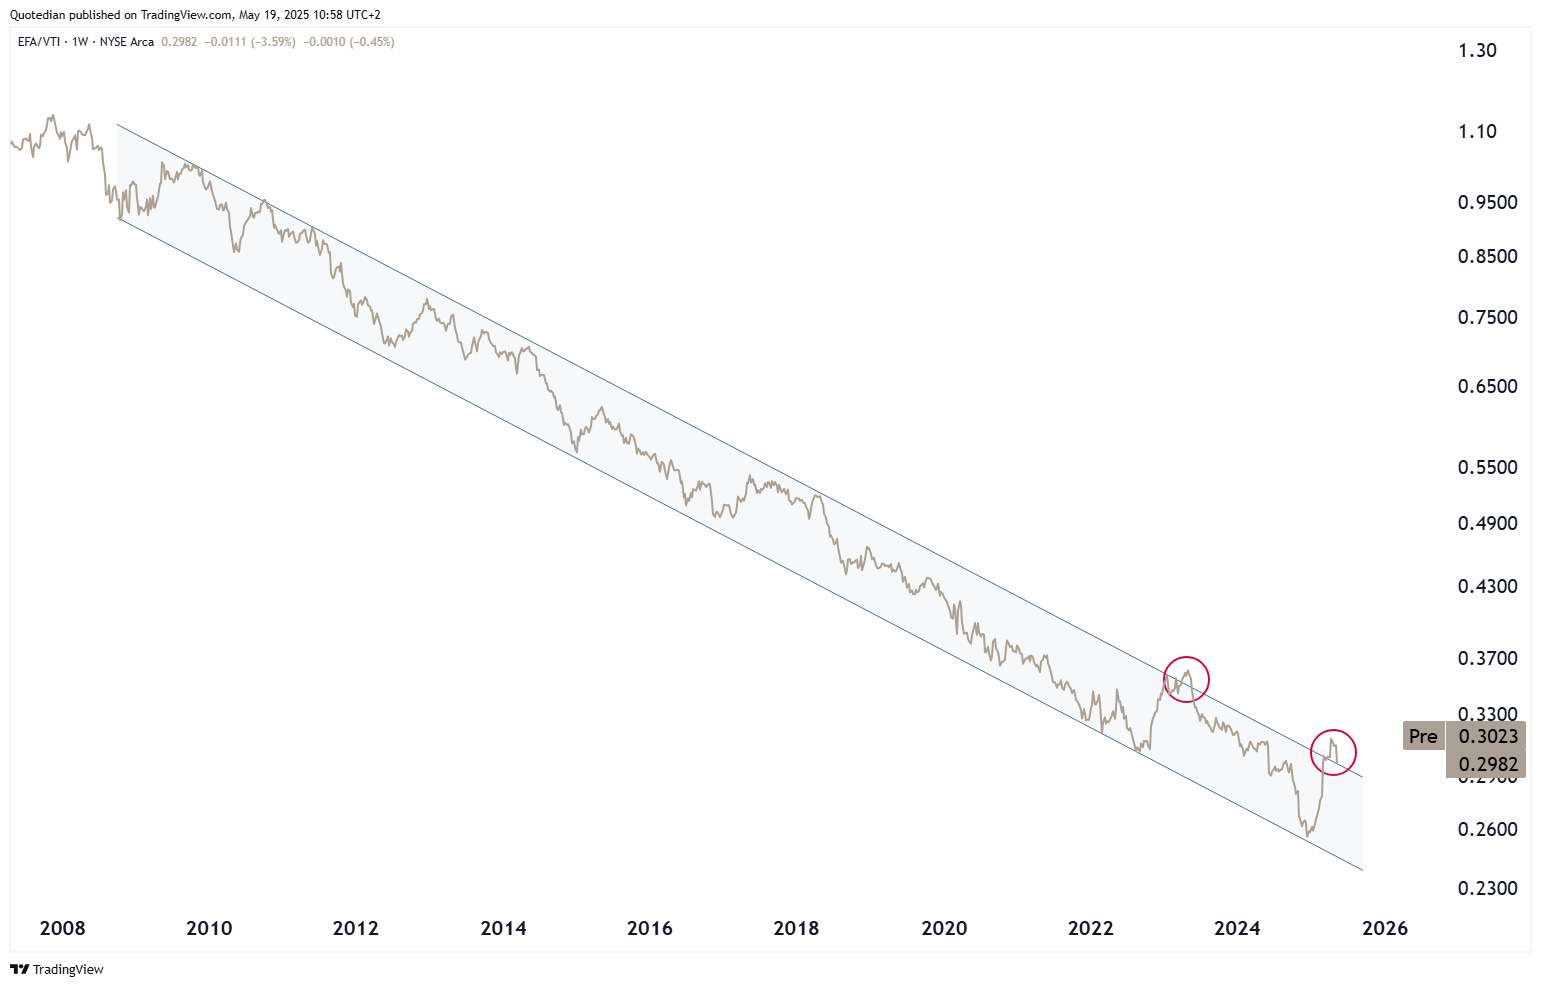
My gut feeling would be the former, i.e. a breakout, but confirmation is needed.
Switzerland’s SMI and the UK’s Footsie are lagging the rest of the European markets a tad:
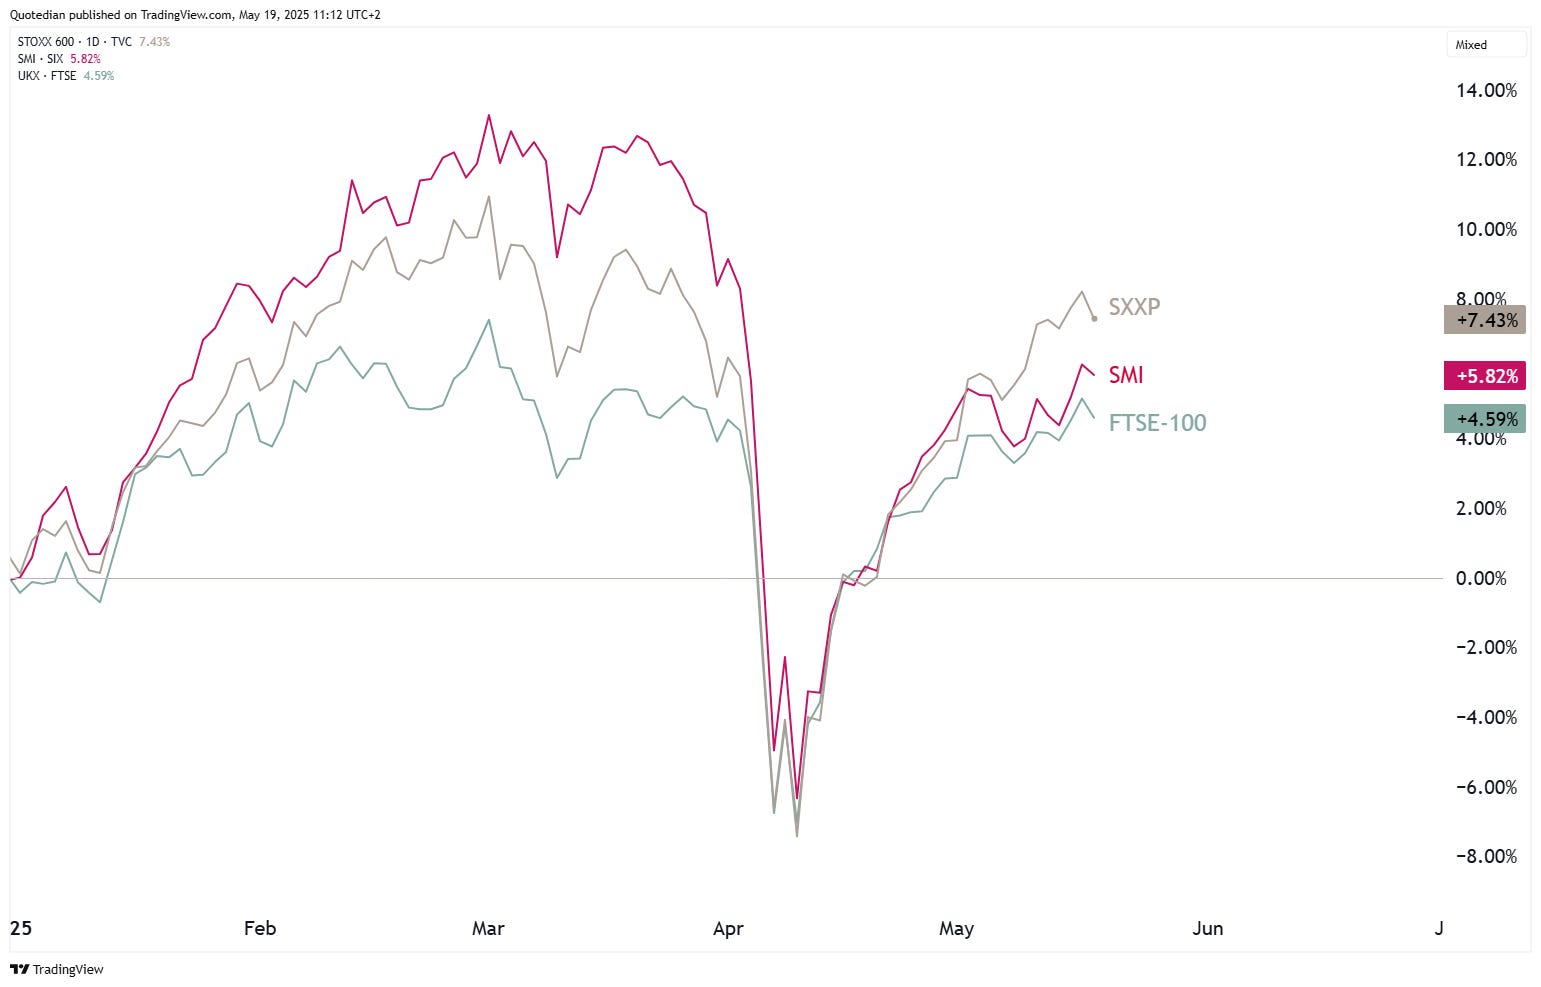
For the SMI, the lag is new, as this market was leading in Q1 of this year. This is likely attributable to an underperformance by index heavy weights Roche and Novartis, which saw business model challenged as chatter regarding them losing their price setting power in the US increased:
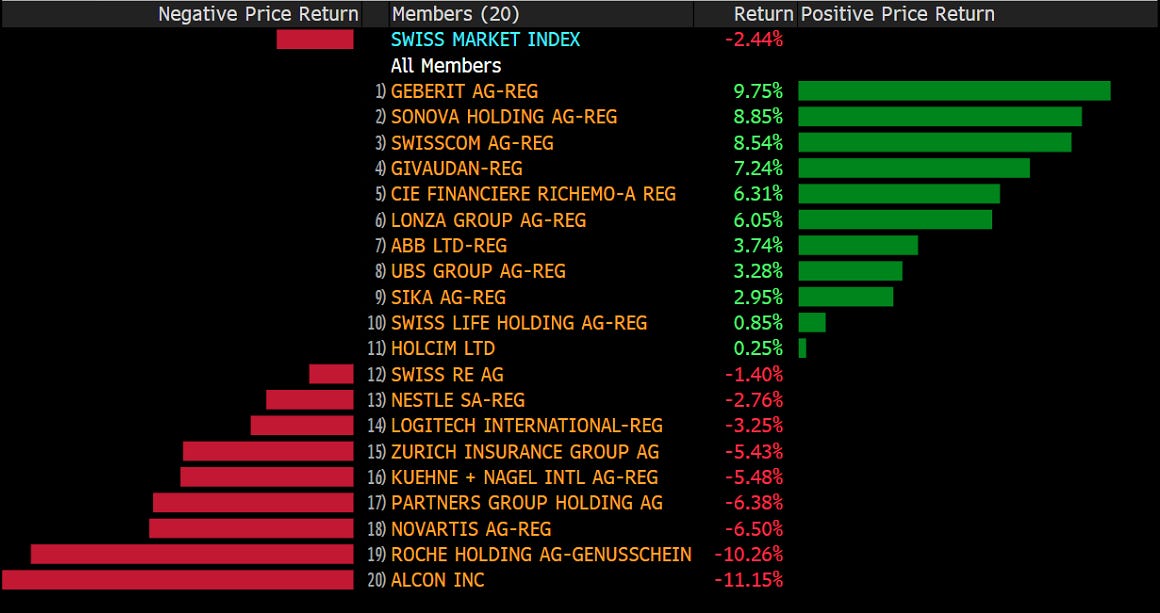
Confirmed!
Turning to Asian equity markets, we note that Japan’s TOPIX index is back into its 14-months old +/-8% trading range:
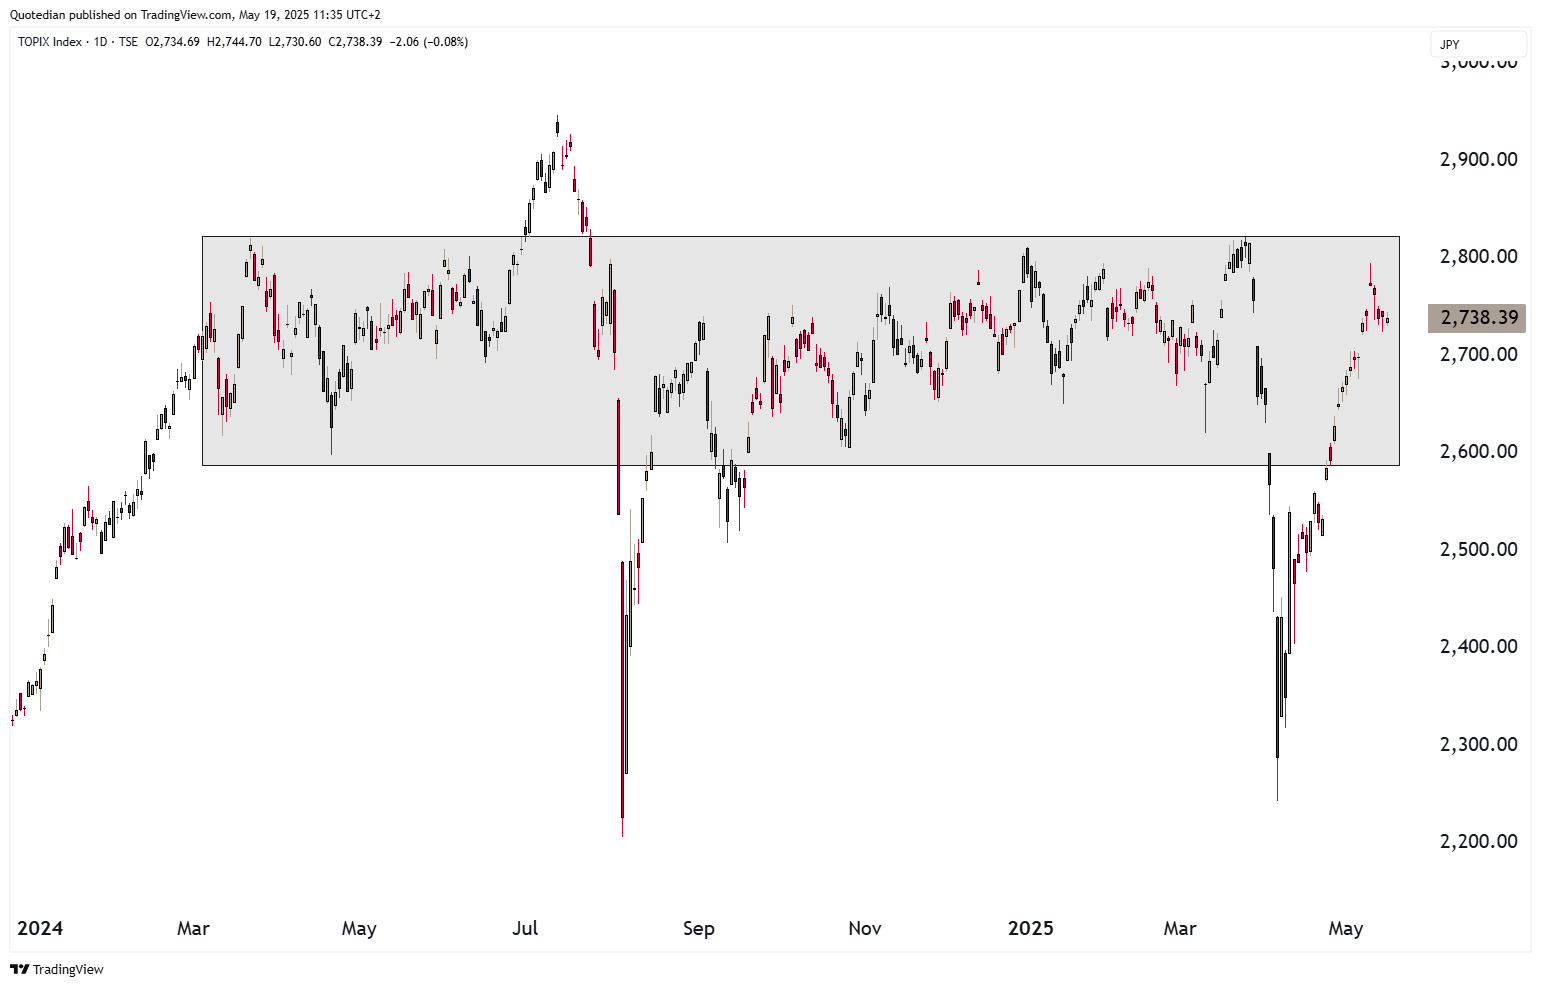
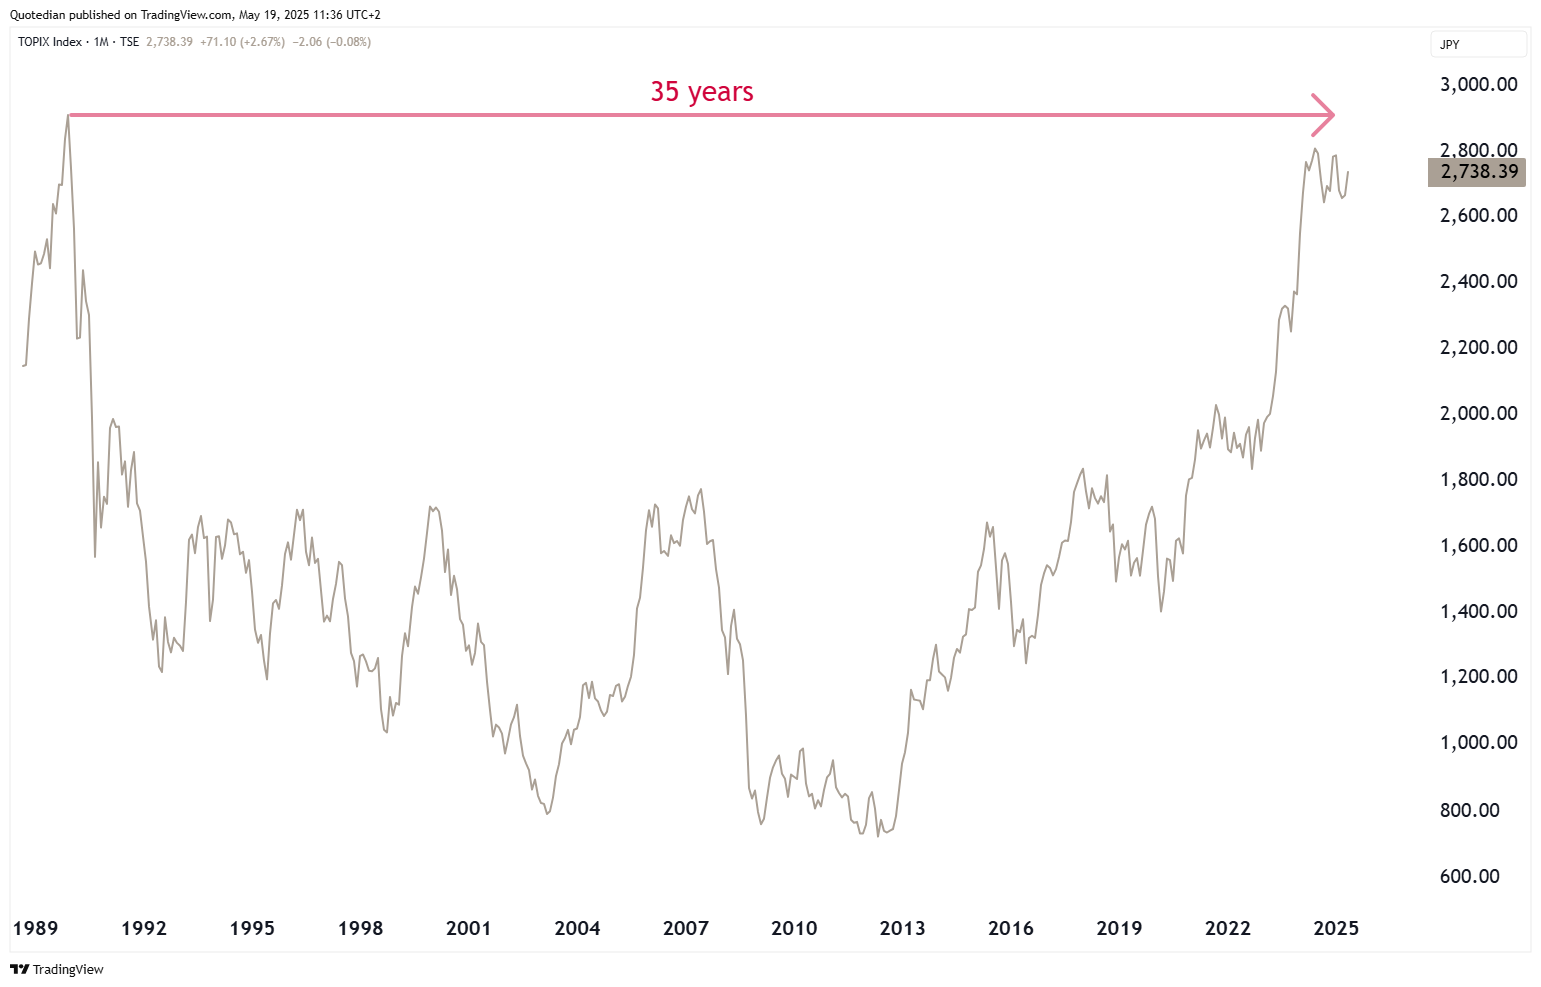
And a bit more than 6% are needed to see the index closing at a new all-time high some 35 years later …
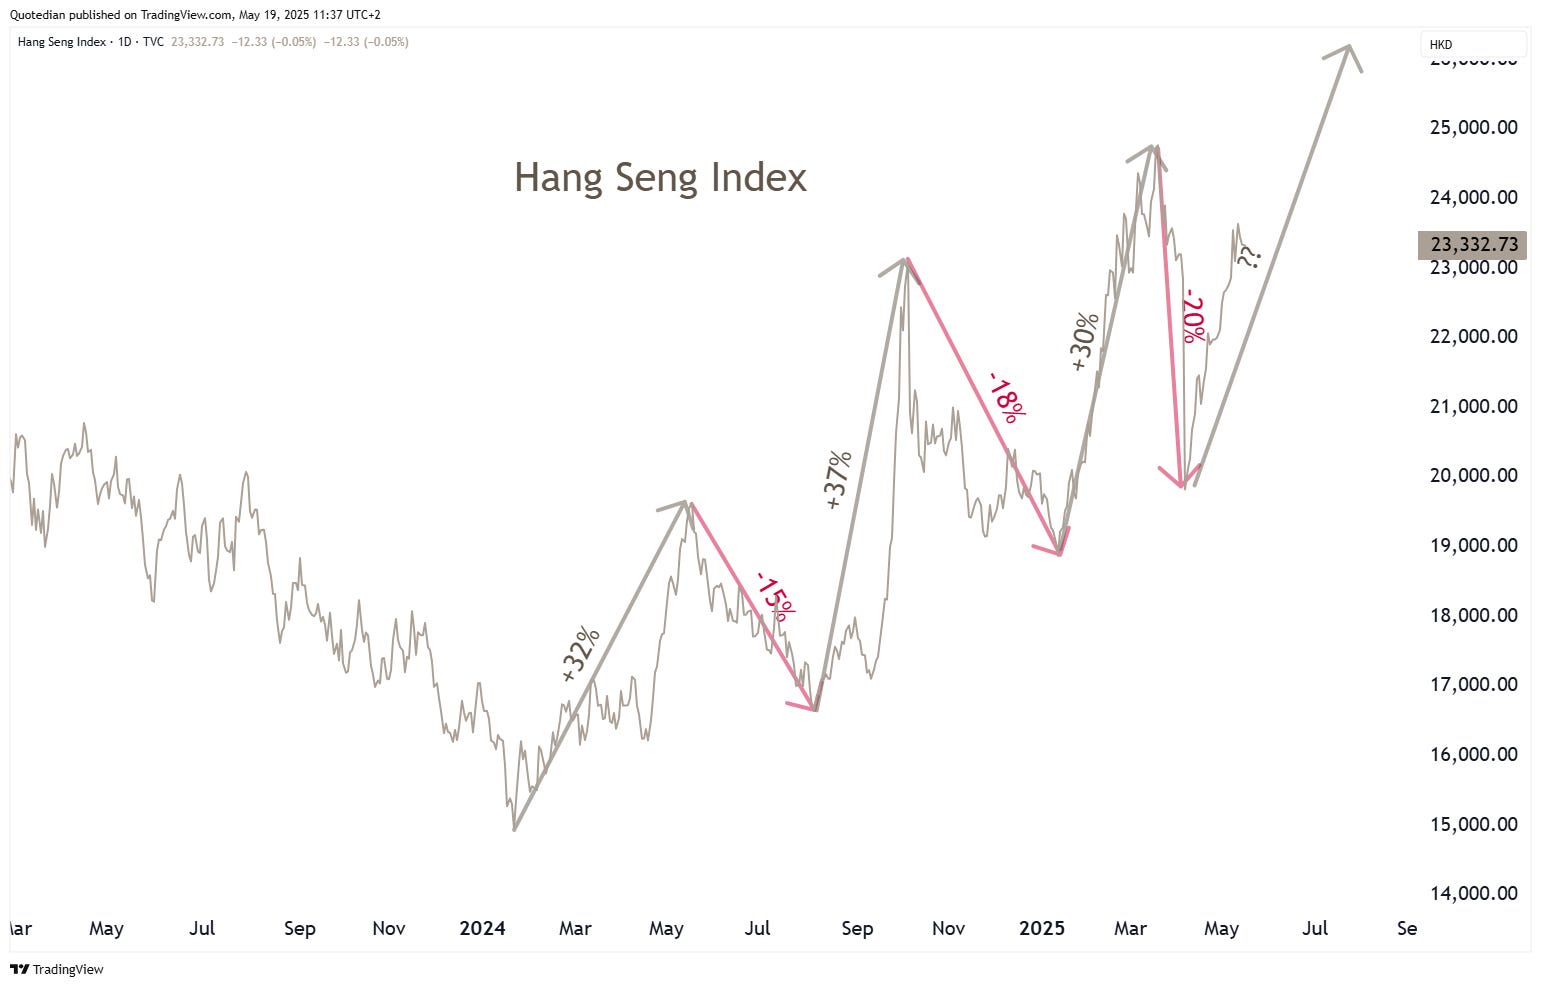
Hong Kong’s Hang Seng continues to ‘play’ nicely within our pre-established pattern and should head above 26,000 in the coming weeks to months:
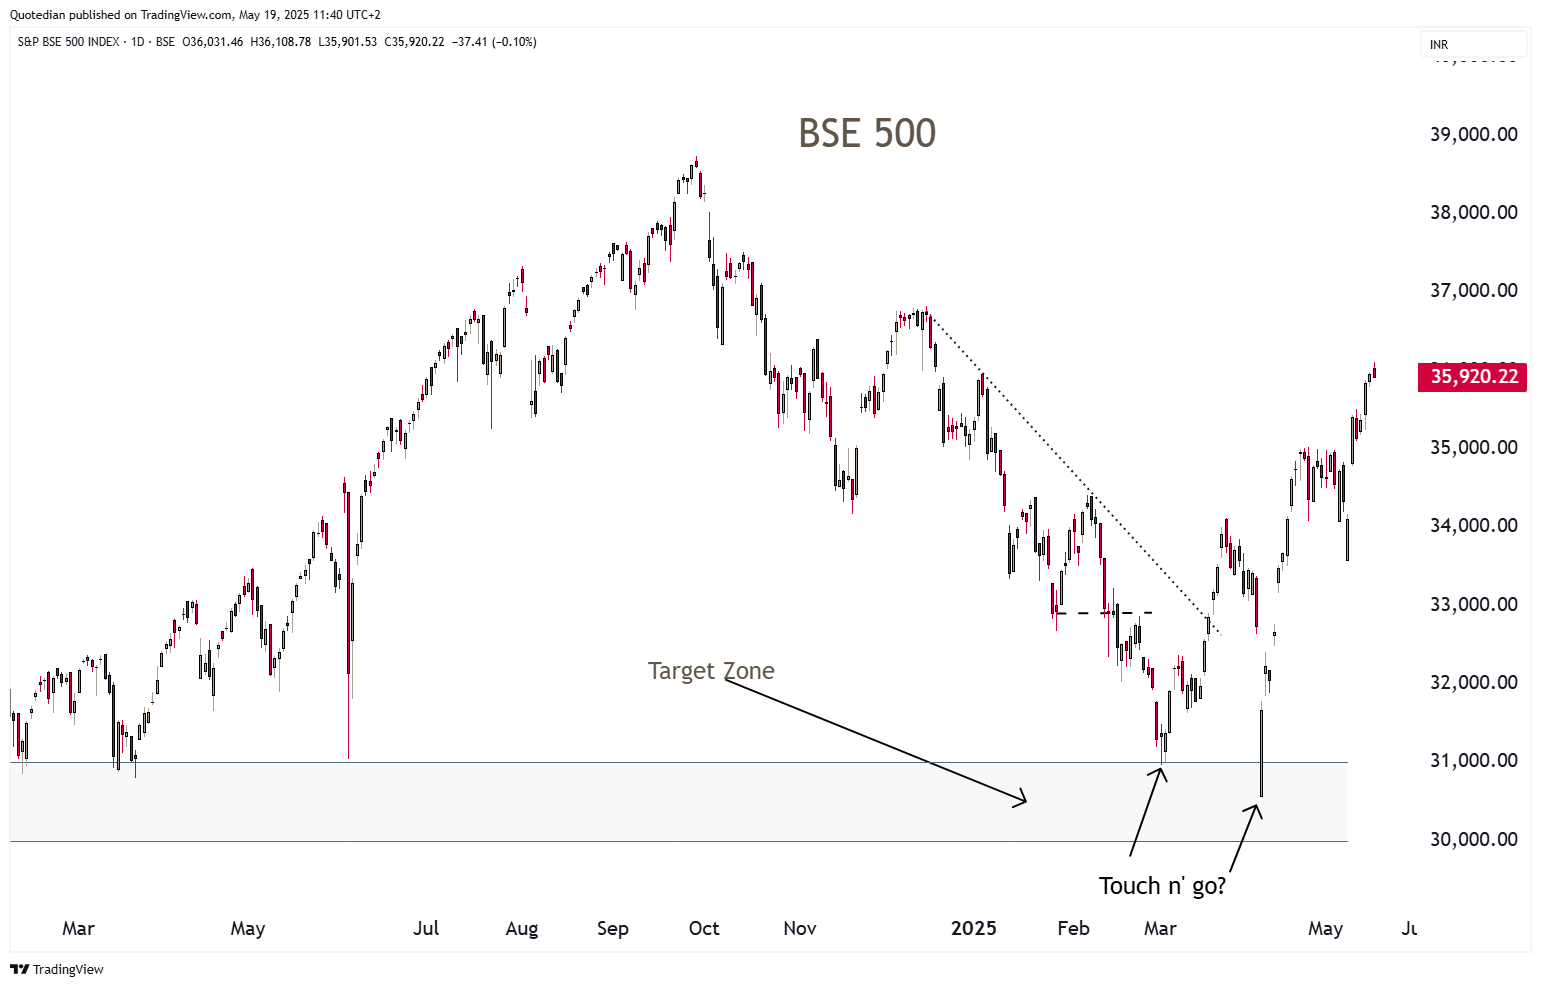
India’s BSE 500 is up 18% from its reaction low on April 7th and is continuing to move its way upwards:
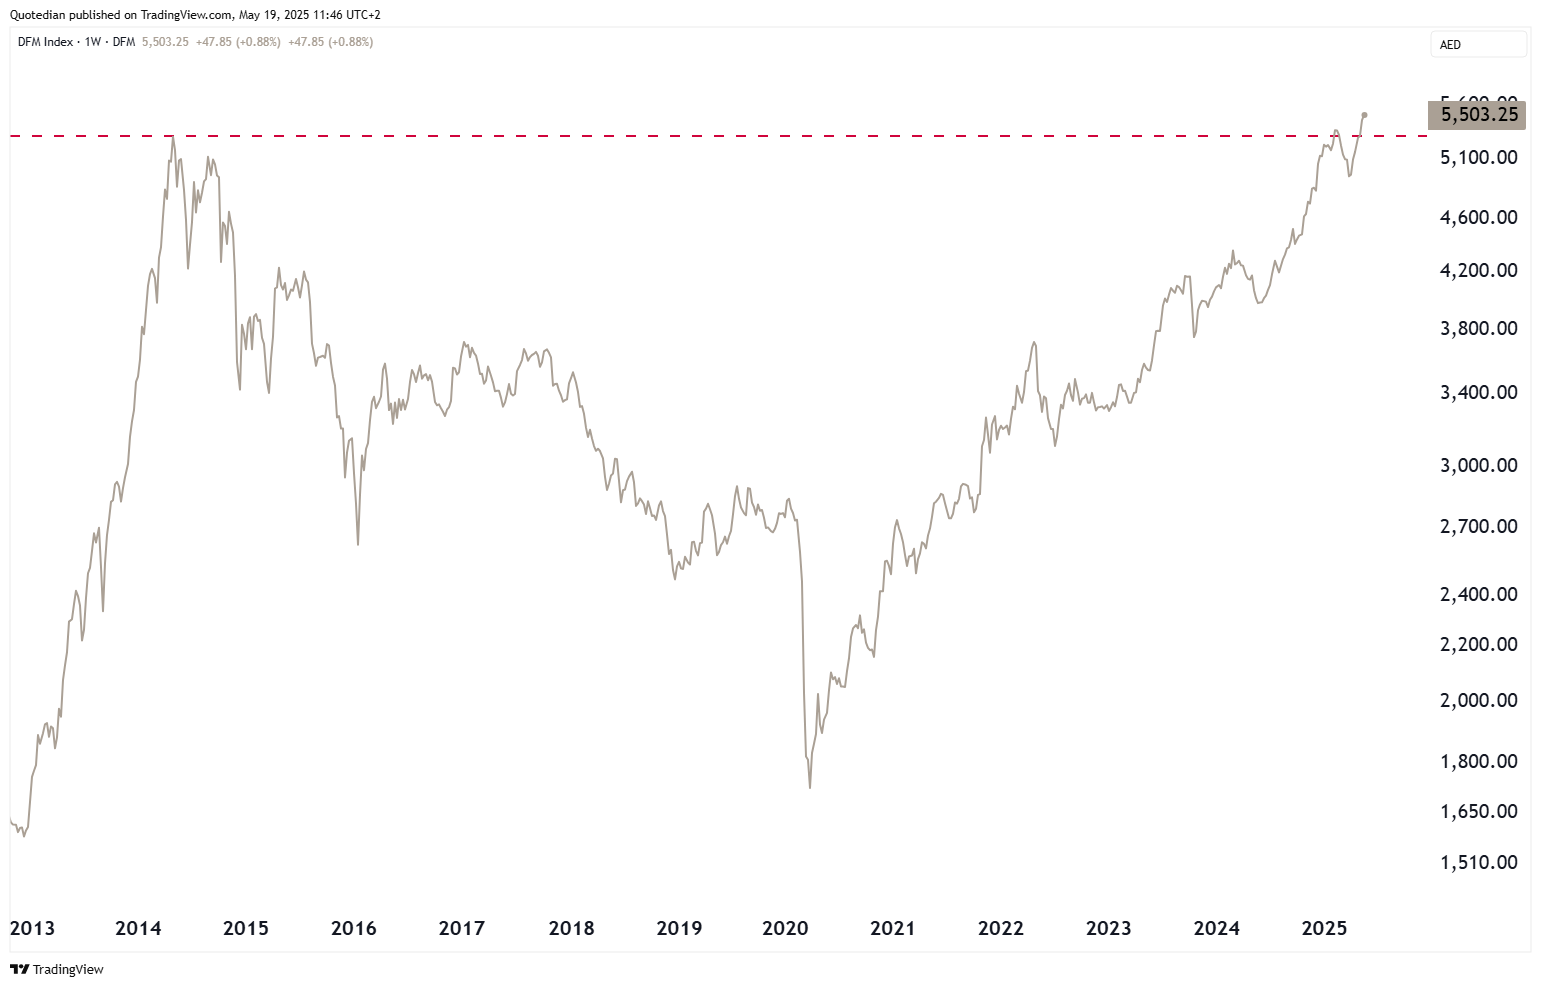
One index clearly breaking out to new (secular) cycle highs is Dubai’s DFMGI, trading at the highest levels in over ten years:
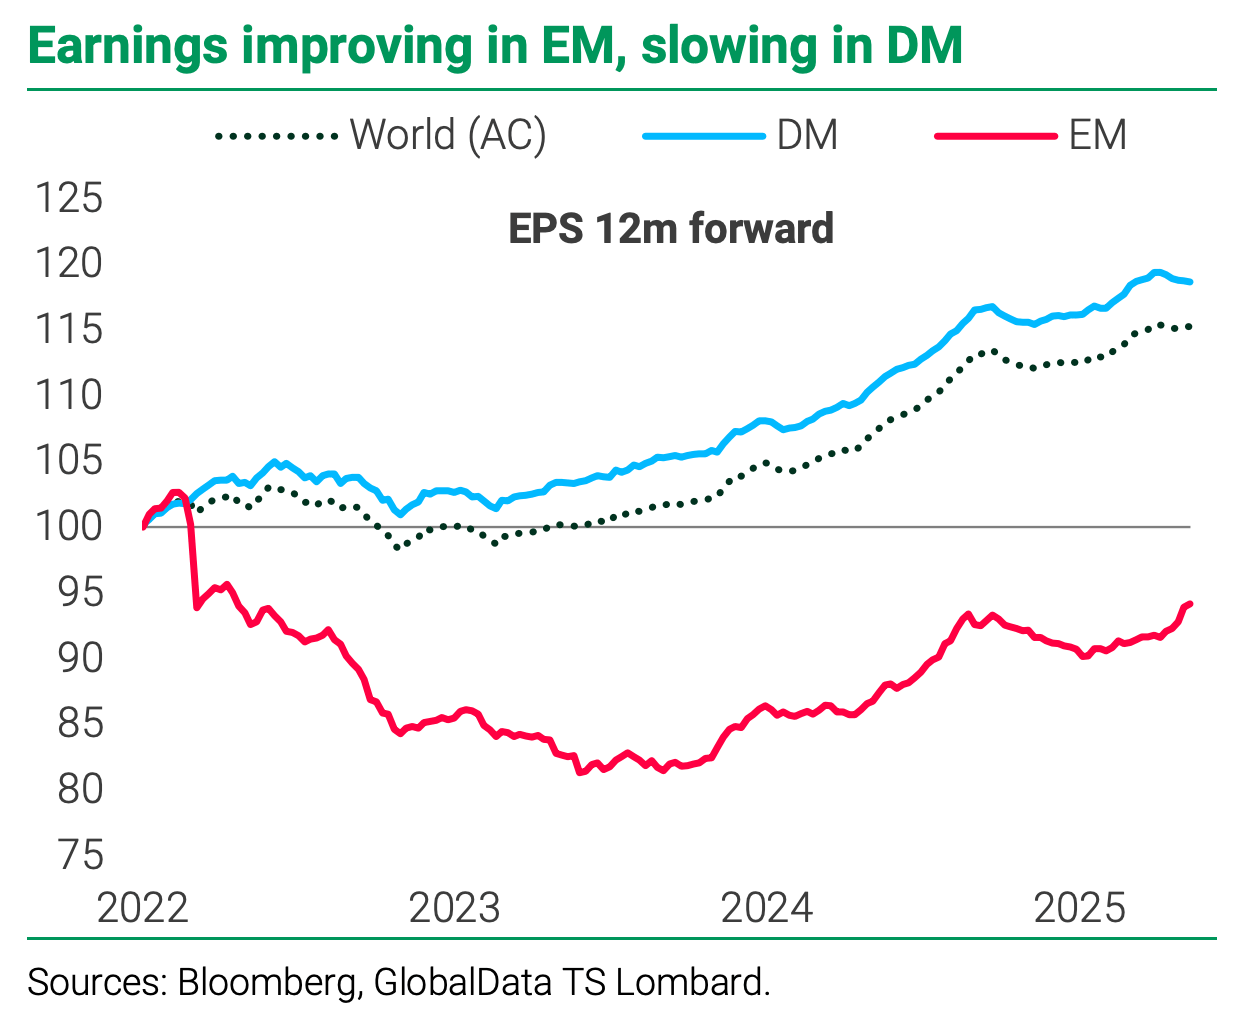
The following chart, courtesy of TS Lombard is then also very fitting, showing that earnings outlook is improving for emerging markets, whilst slowing in developed markets:
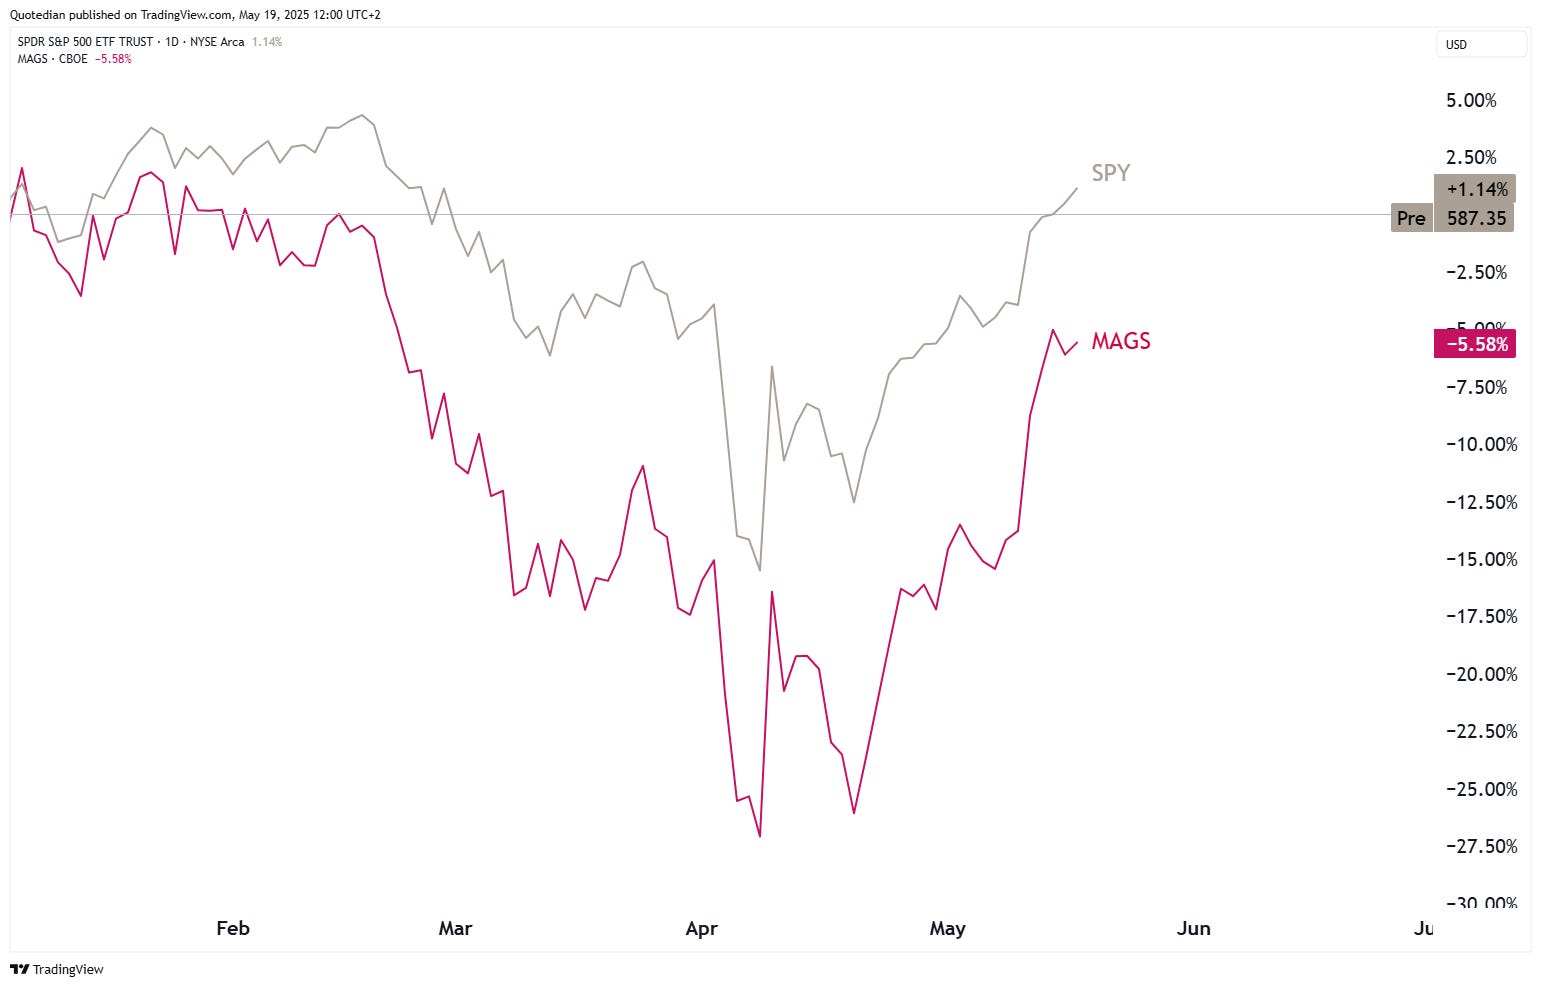
Checking in on sector/factor performance we note in the following year-to-date heatmap how the Mag 7 stocks have been detractors from performance this year, clearly indicating a change in leadership:
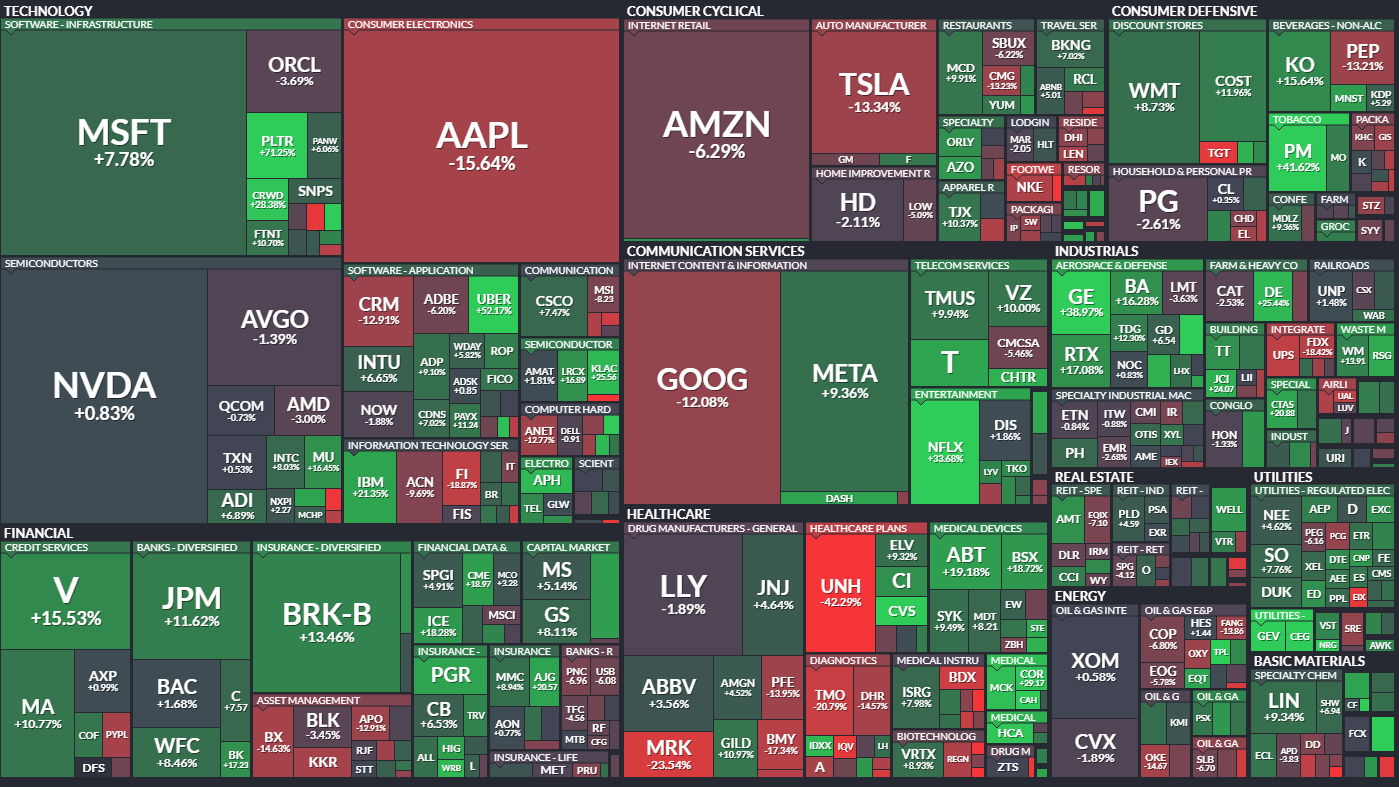
The following chart shows the same, only a bit clearer 😉:
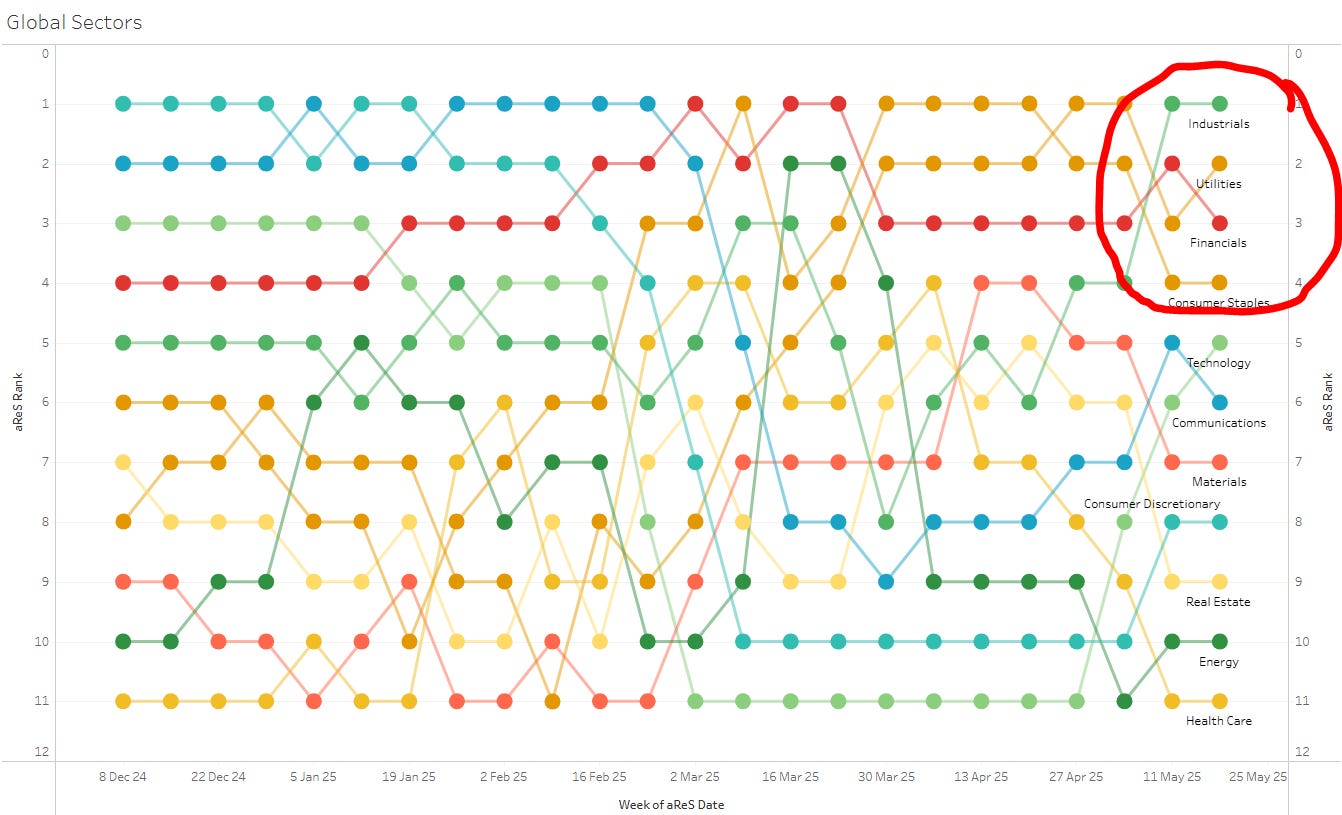
Global sector leadership has also clearly changed from last year:
Finally, to end the equity section, here our usual leaderboard of the best performing stocks in the US and Europe on a YTD basis and how they have performed over the past week:
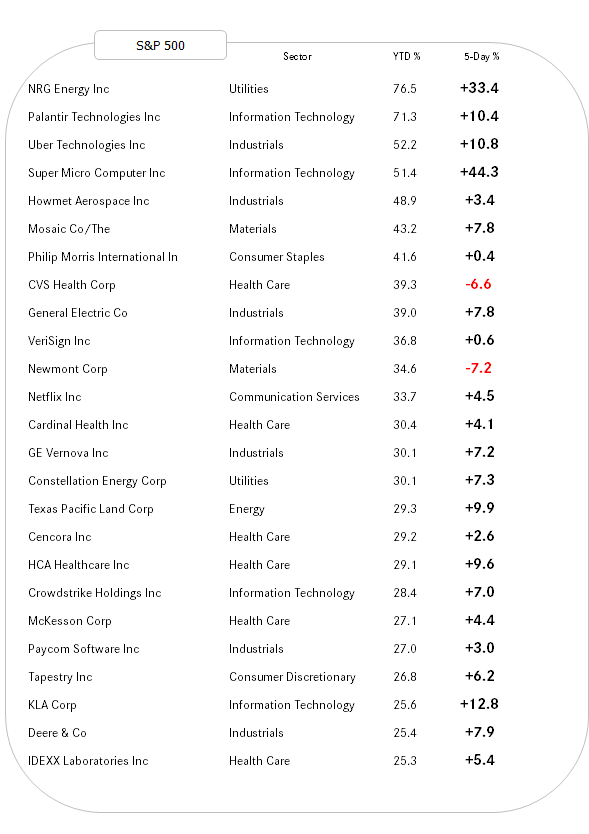
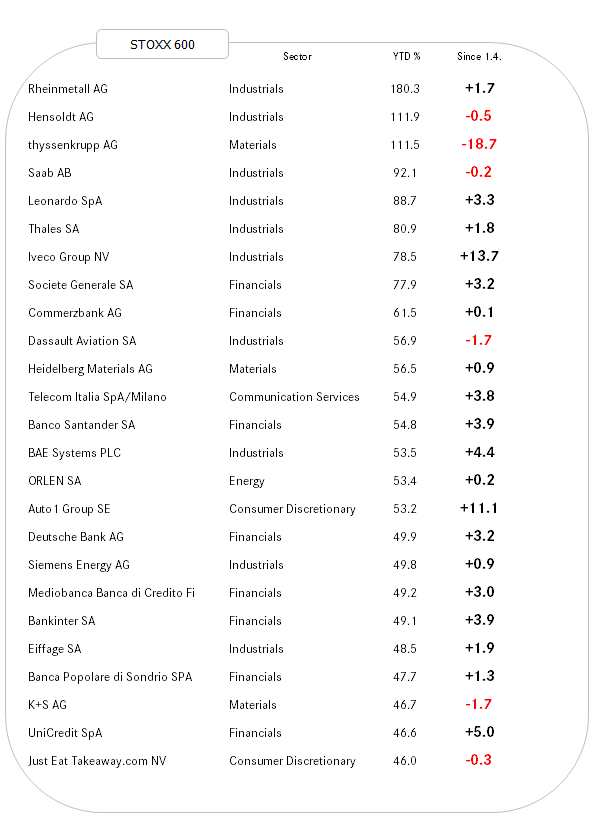
With only a few exceptions, strength begets strength!

Why not star the Fixed Income/Rates section with another quote, this time from Paul Ryan, pronounced all the way back in 2007:
“We don’t have a tax revenue problem in Washington, we have a spending problem in Washington.”
We already back in the introductory chapter of this week’s letter, that bond yields did not react a whole lot to the “original” US debt downgrade back in August of 2011. Quite “au contraire”, went bonds on to rally another 30% as measured by the iShares 20+ Year Treasury ETF (TLT):
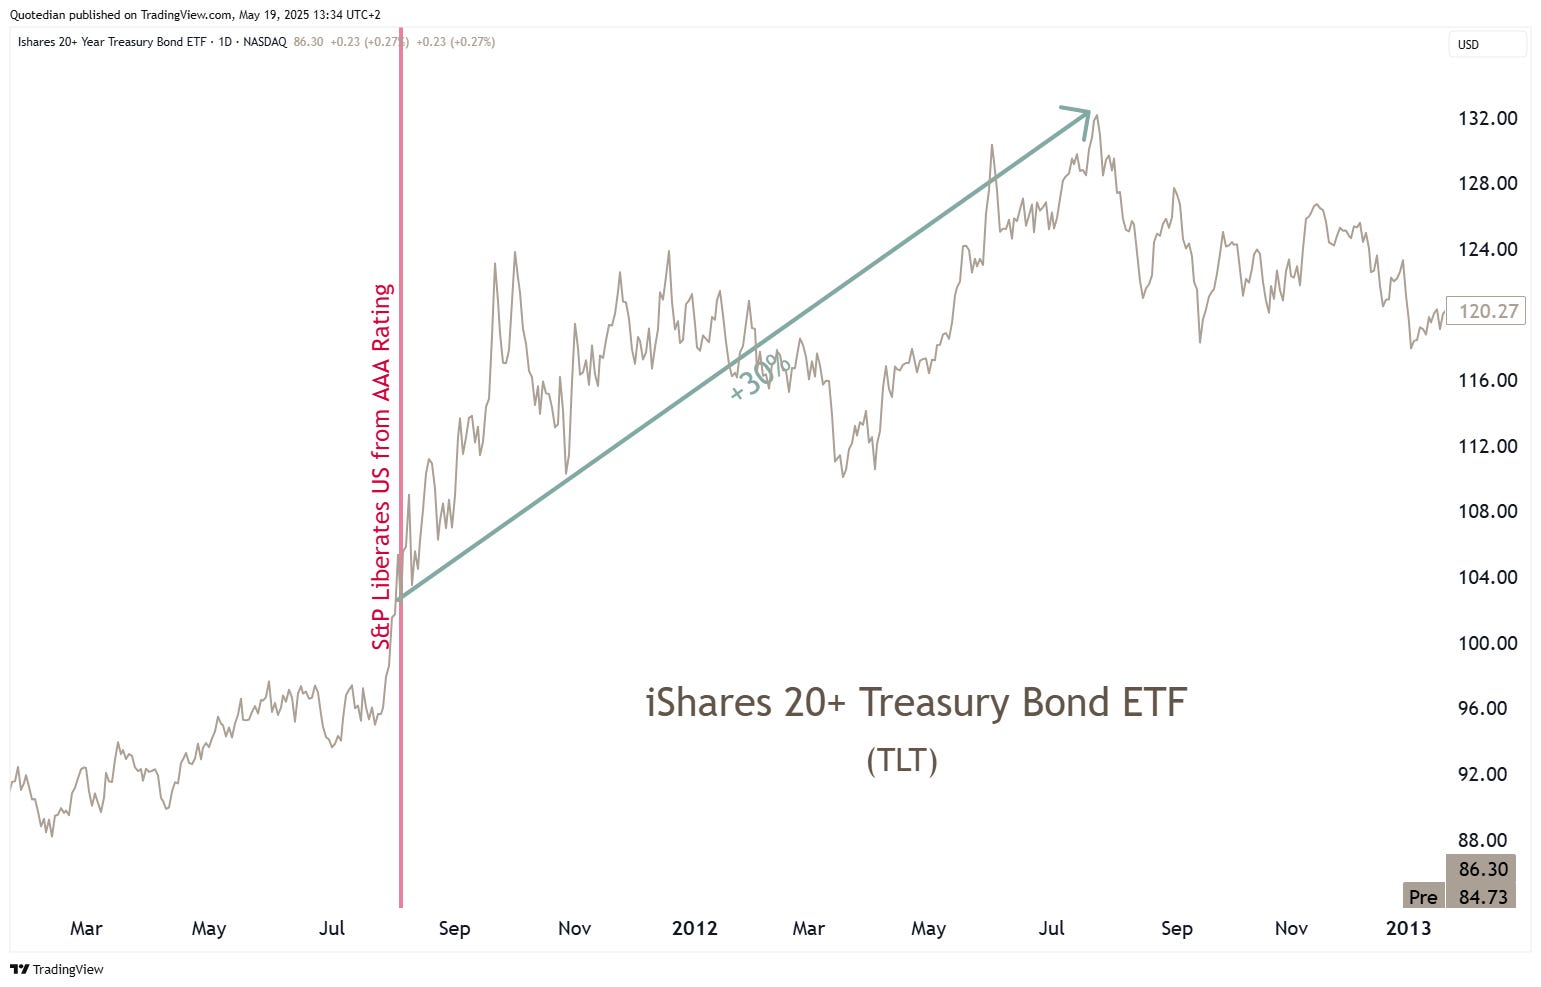
However, the situation was quite different back then than it is today. In 2011, the European Sovereign Debt market was cooking up to its most important crises since the establishment of the EU and ‘only’ a double AA+ rating for the US was still more than good enough in international comparison.
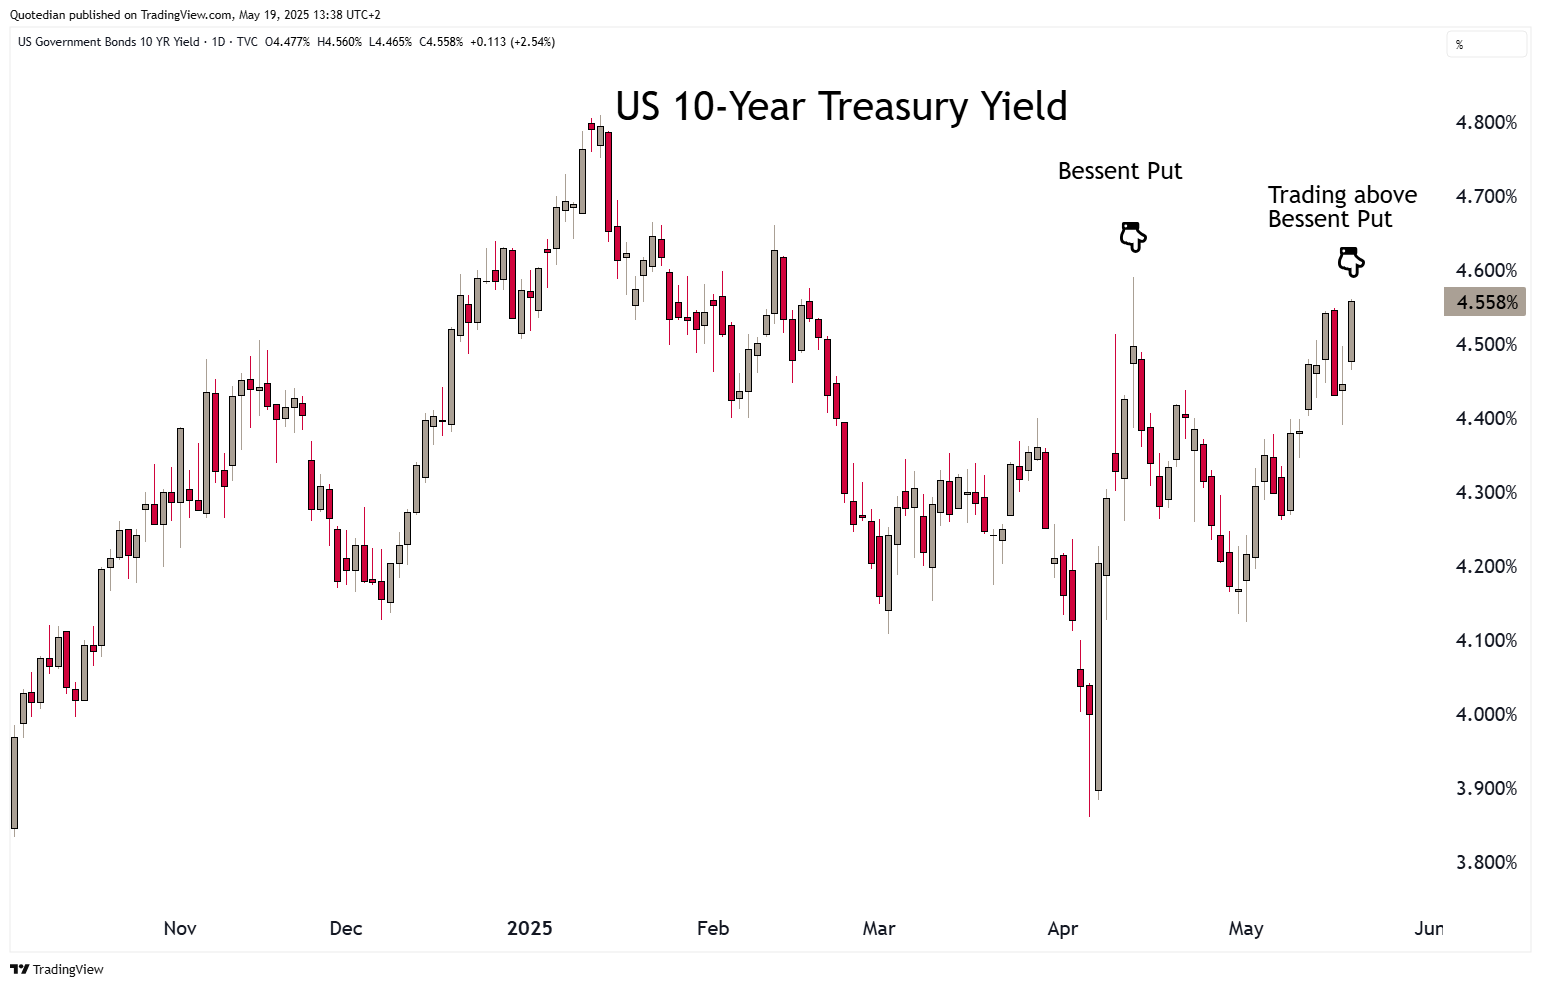
Today, after Moody’s Friday downgrade, the bond market is not so happy, with the Tens trading above 4.55% (in terms of yield),
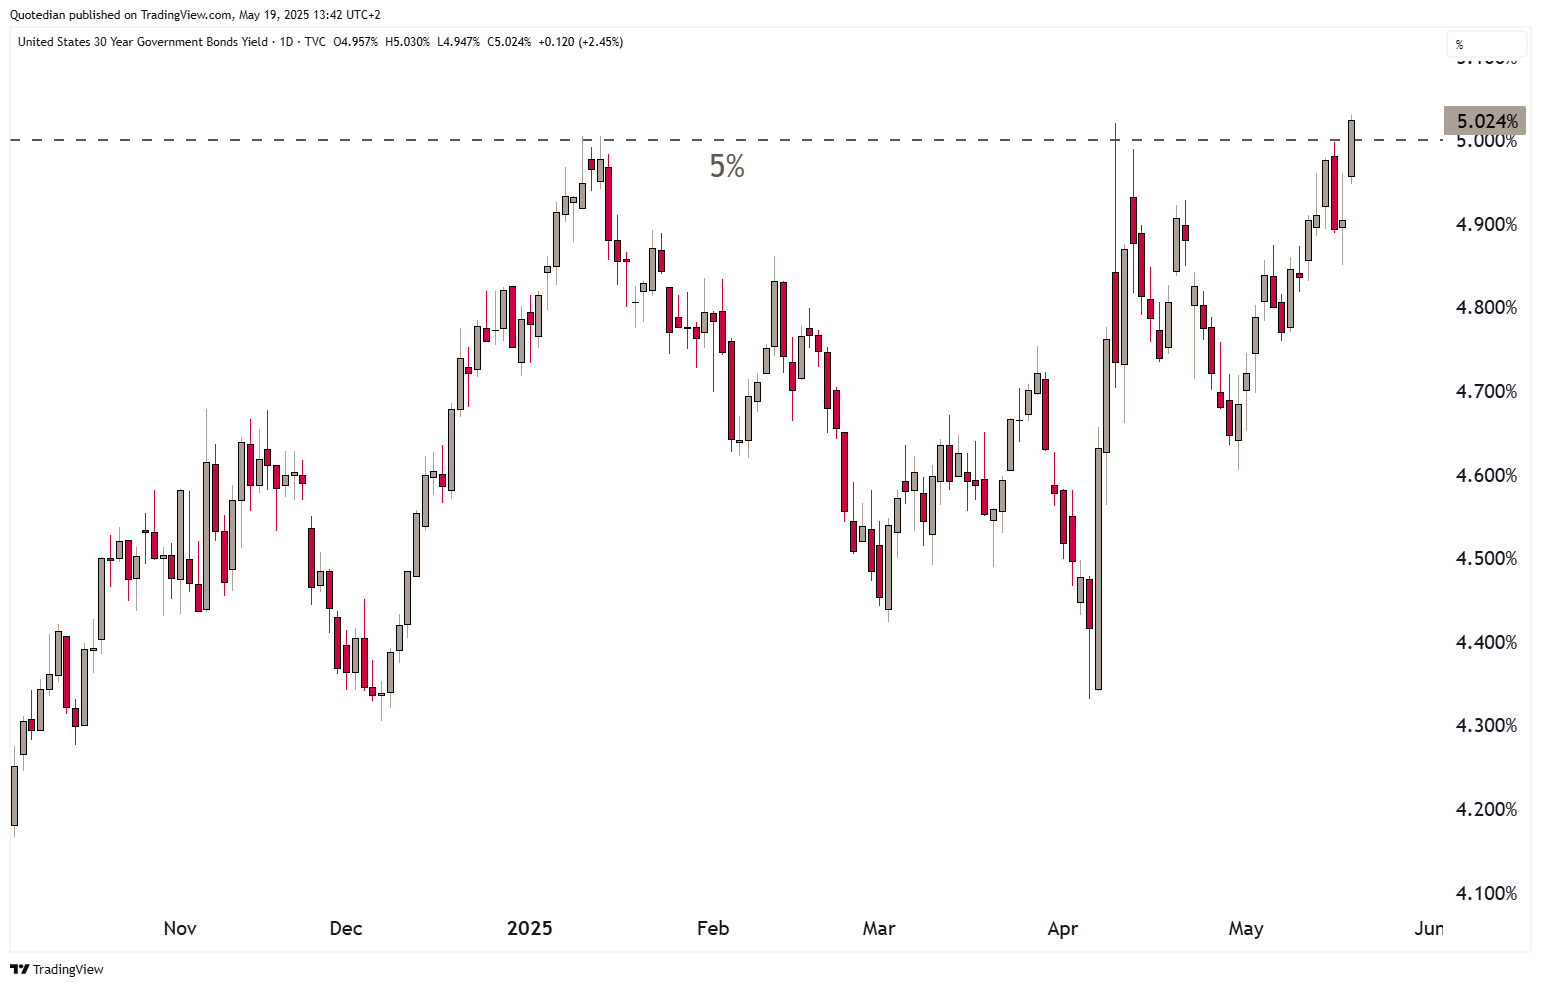
and the 30-year yield moving north of 5%:
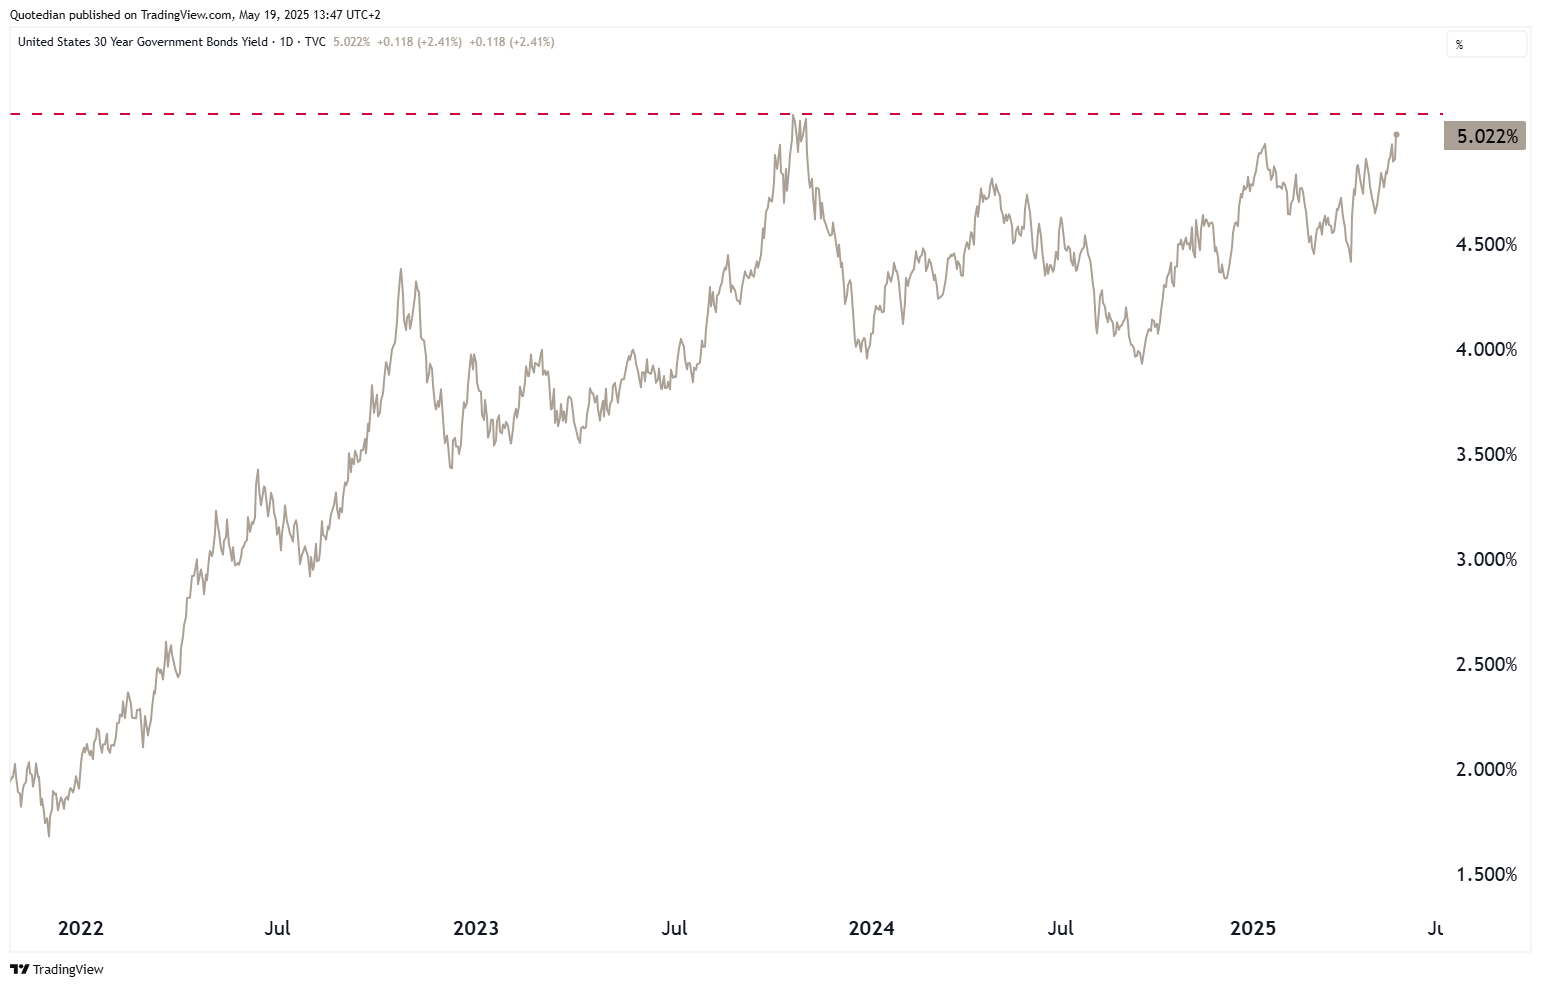
As a matter of fact, the 30-year yield is closing in on the 2023 cycle high, which in turn was the highest level seen since 2007:
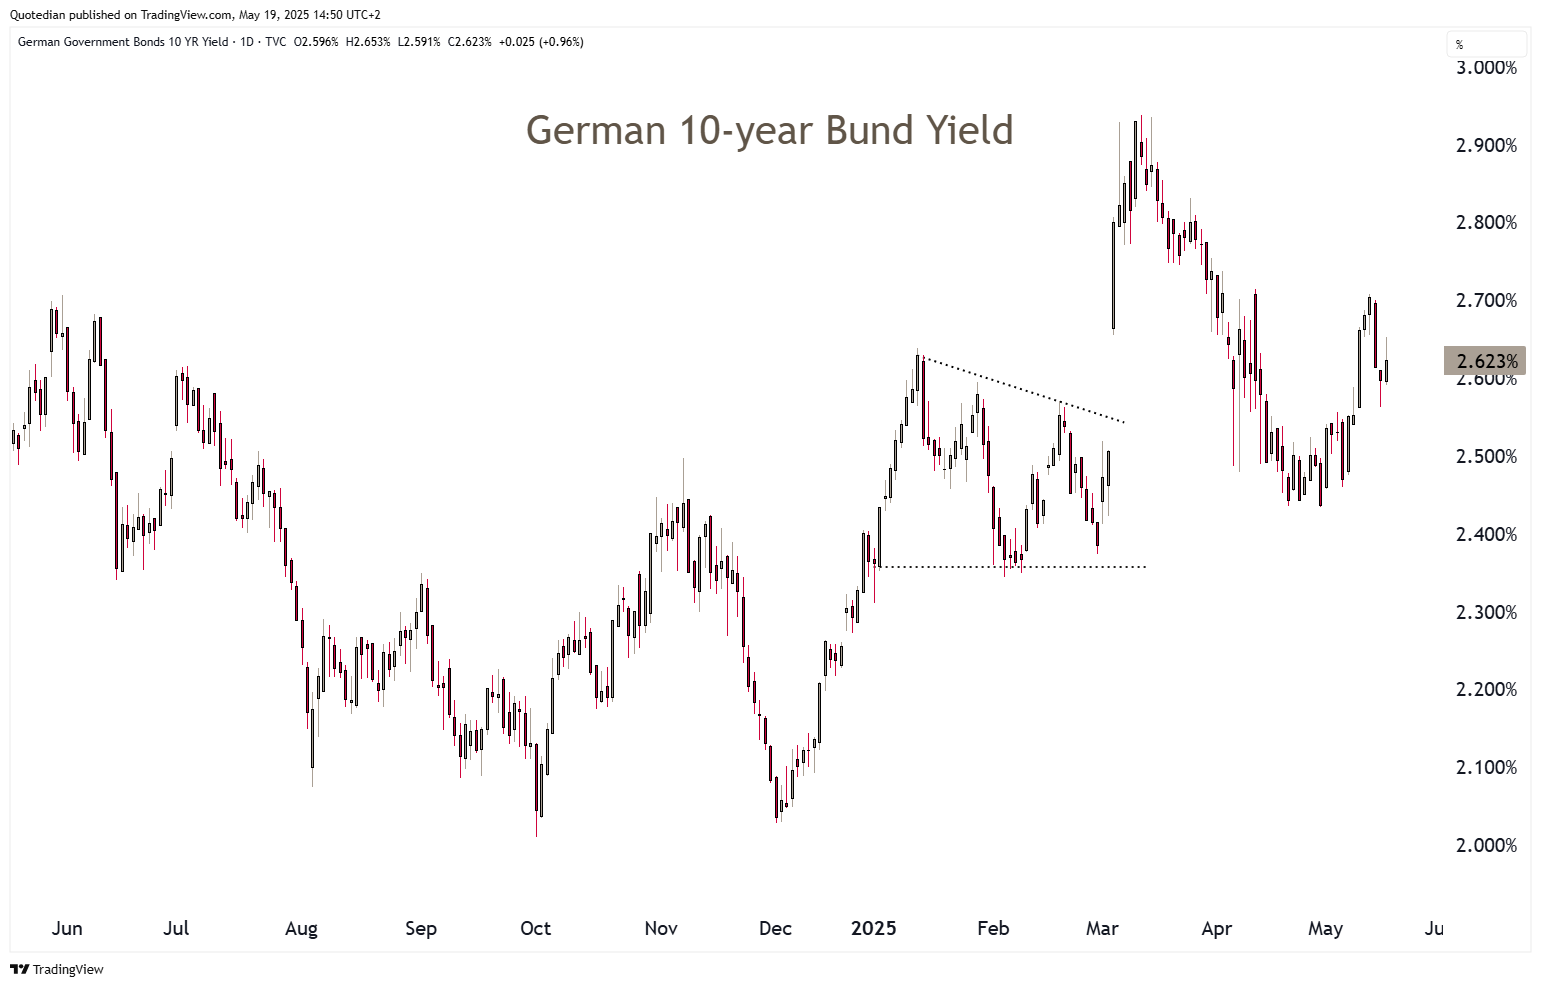
German yields also seem to be on the rise again, albeit a tad more muted:
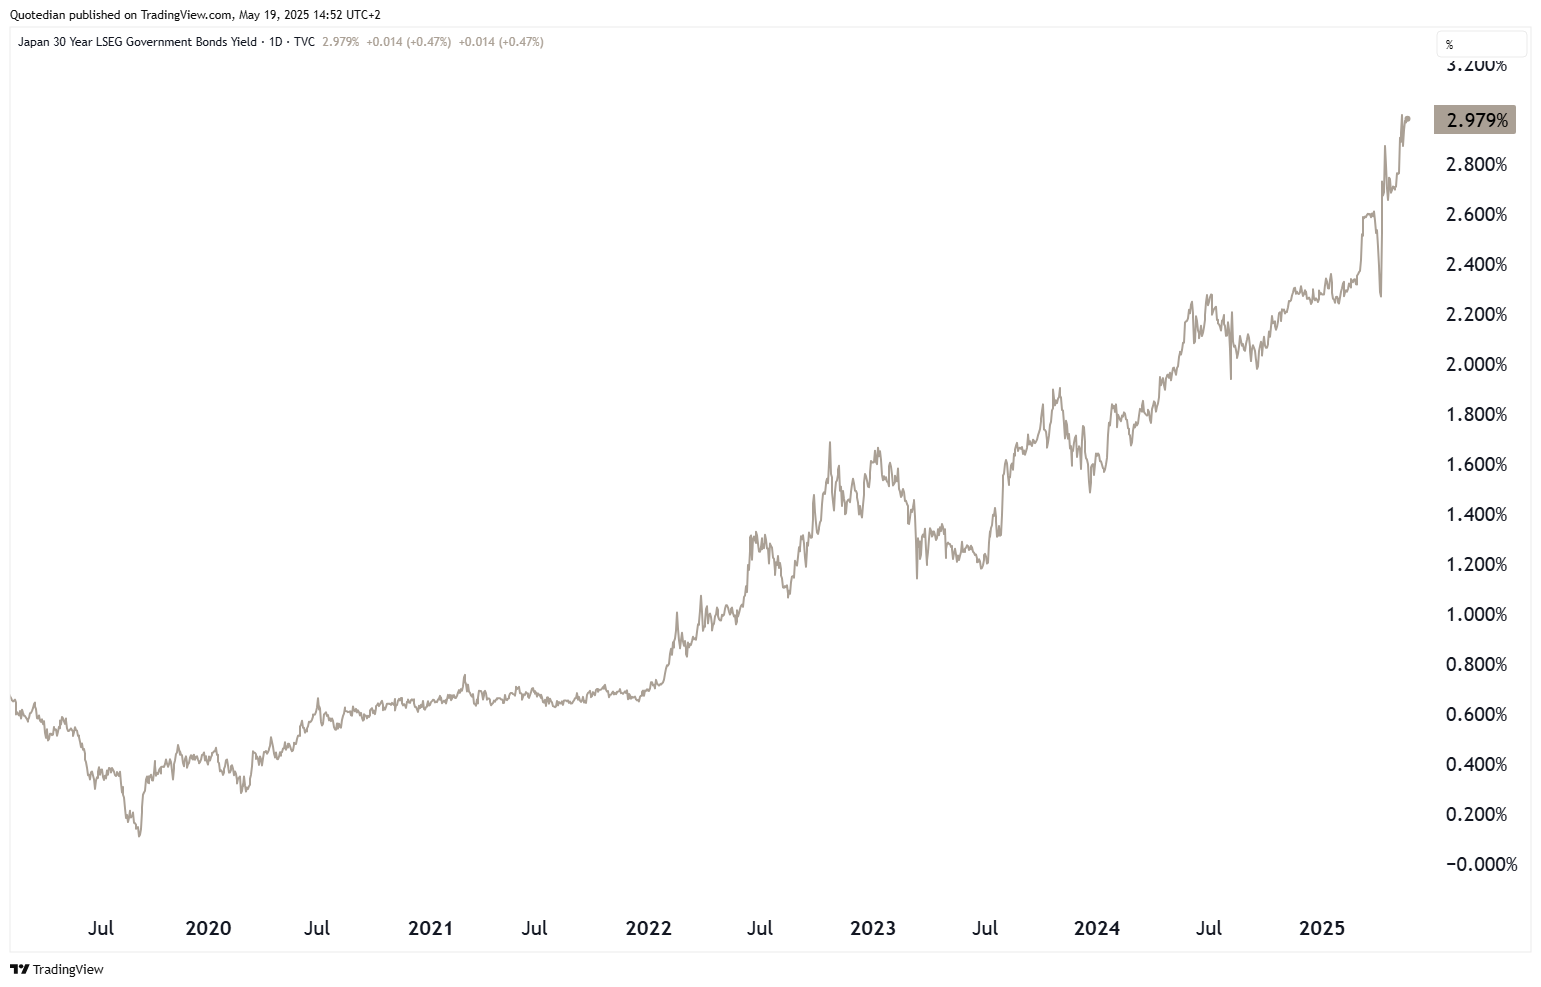
But one of the most relentless uptrend in yields could be observed in Japanese yields, with for example the 30-year version up from 0.10% five years ago now just shy of 3%:
Even though the numbers seem small, do not underestimate this moves. A 0.40% 30-year JGB issued at par in 2019 for example, trades at 60% today, providing an annual loss of over 8% (calculating the generous 0.40% coupon back in):
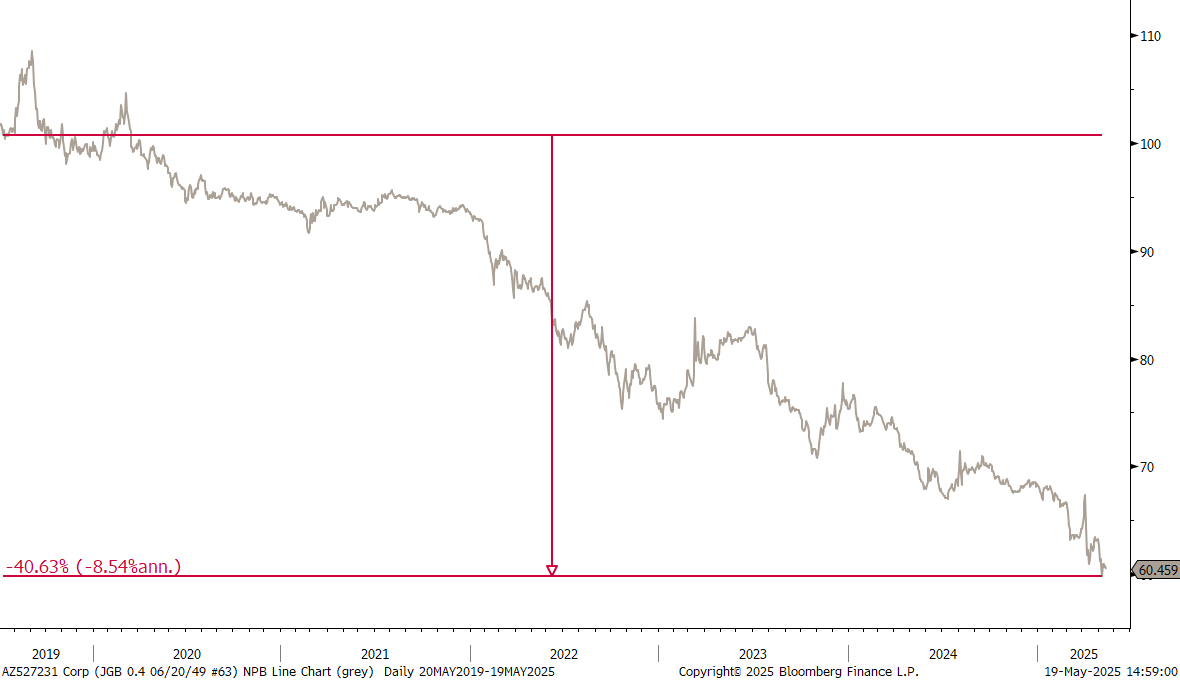
It’s the JGB widow-maker trade all over again - only in reverse!
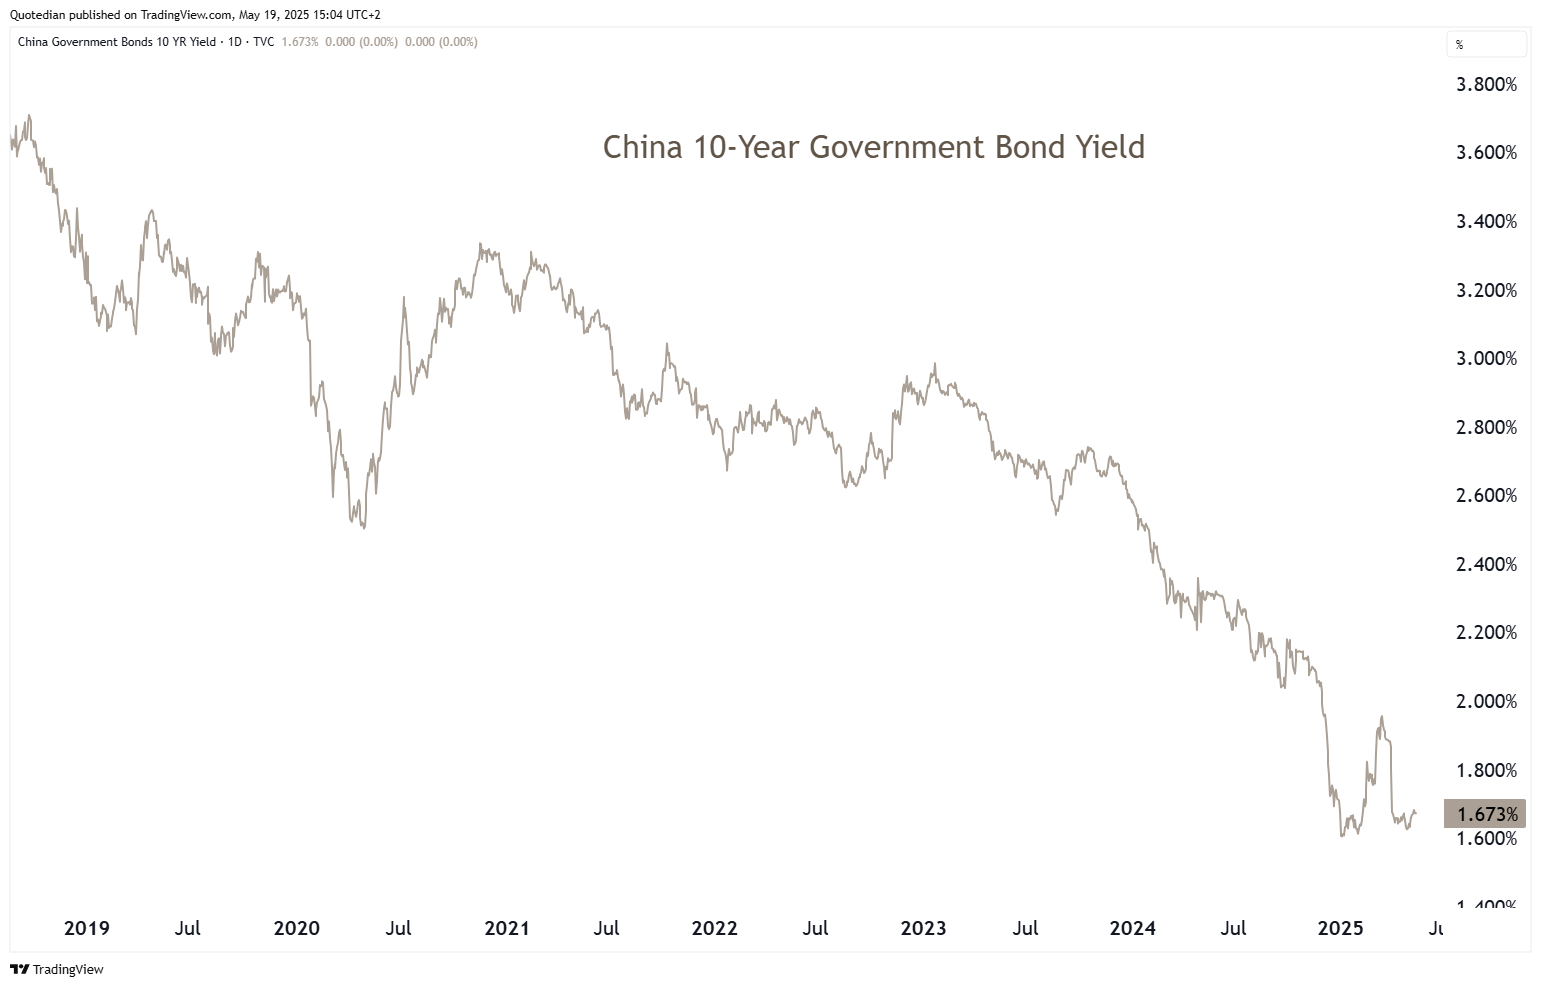
Two of the few places where yields seem to go down but not up include China,
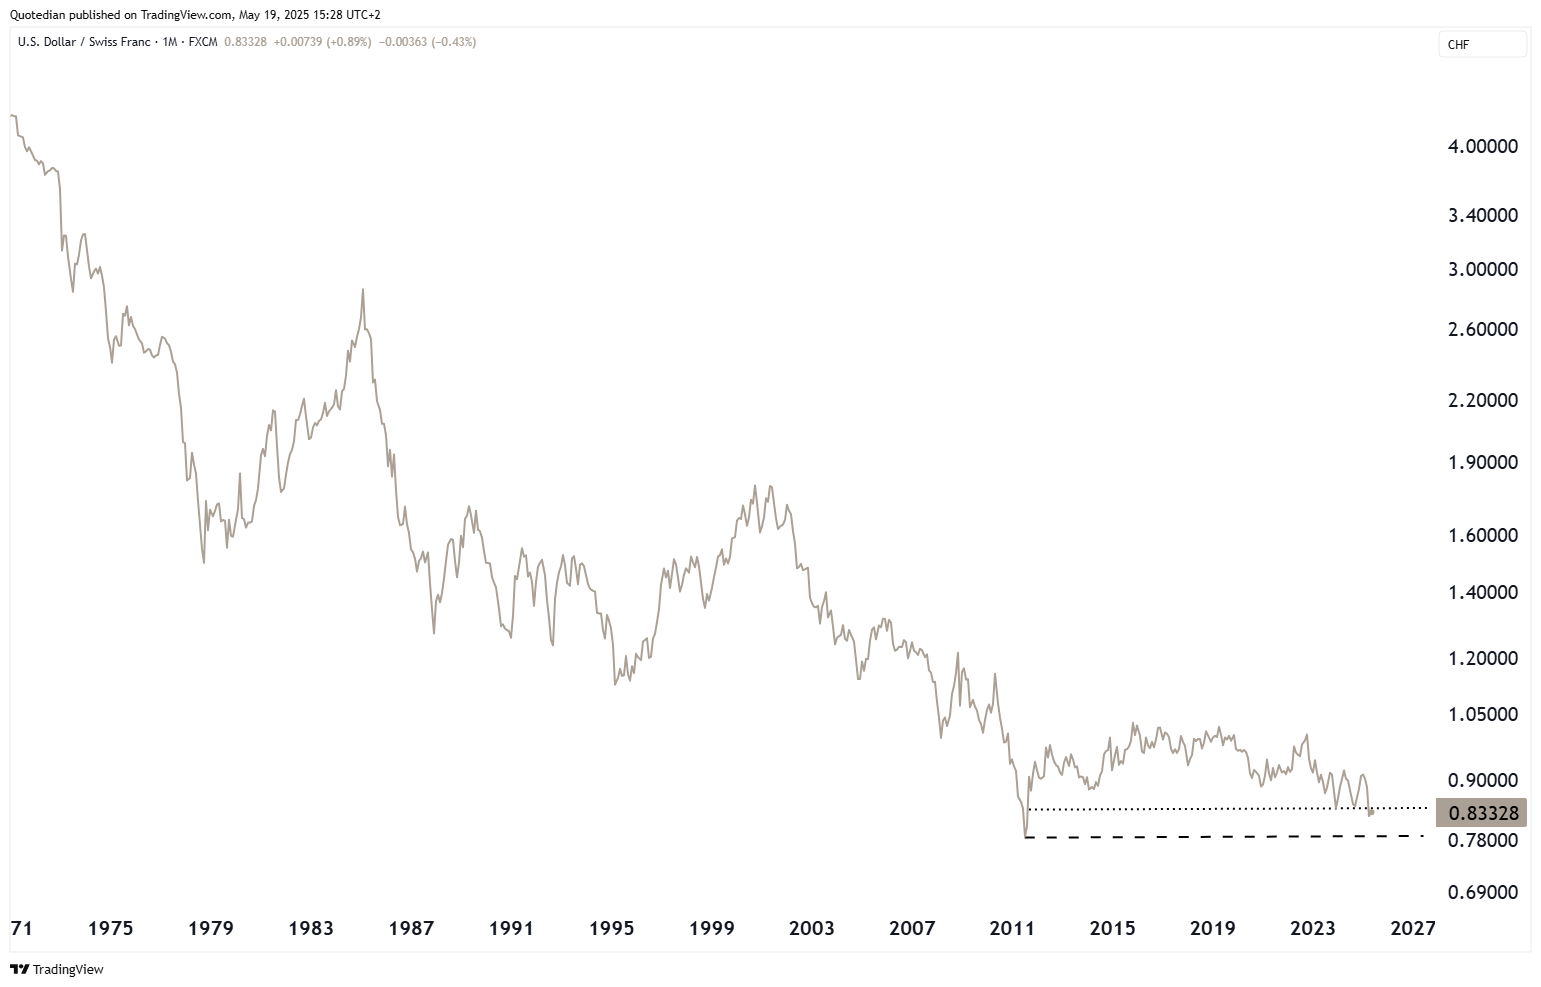
and Switzerland:
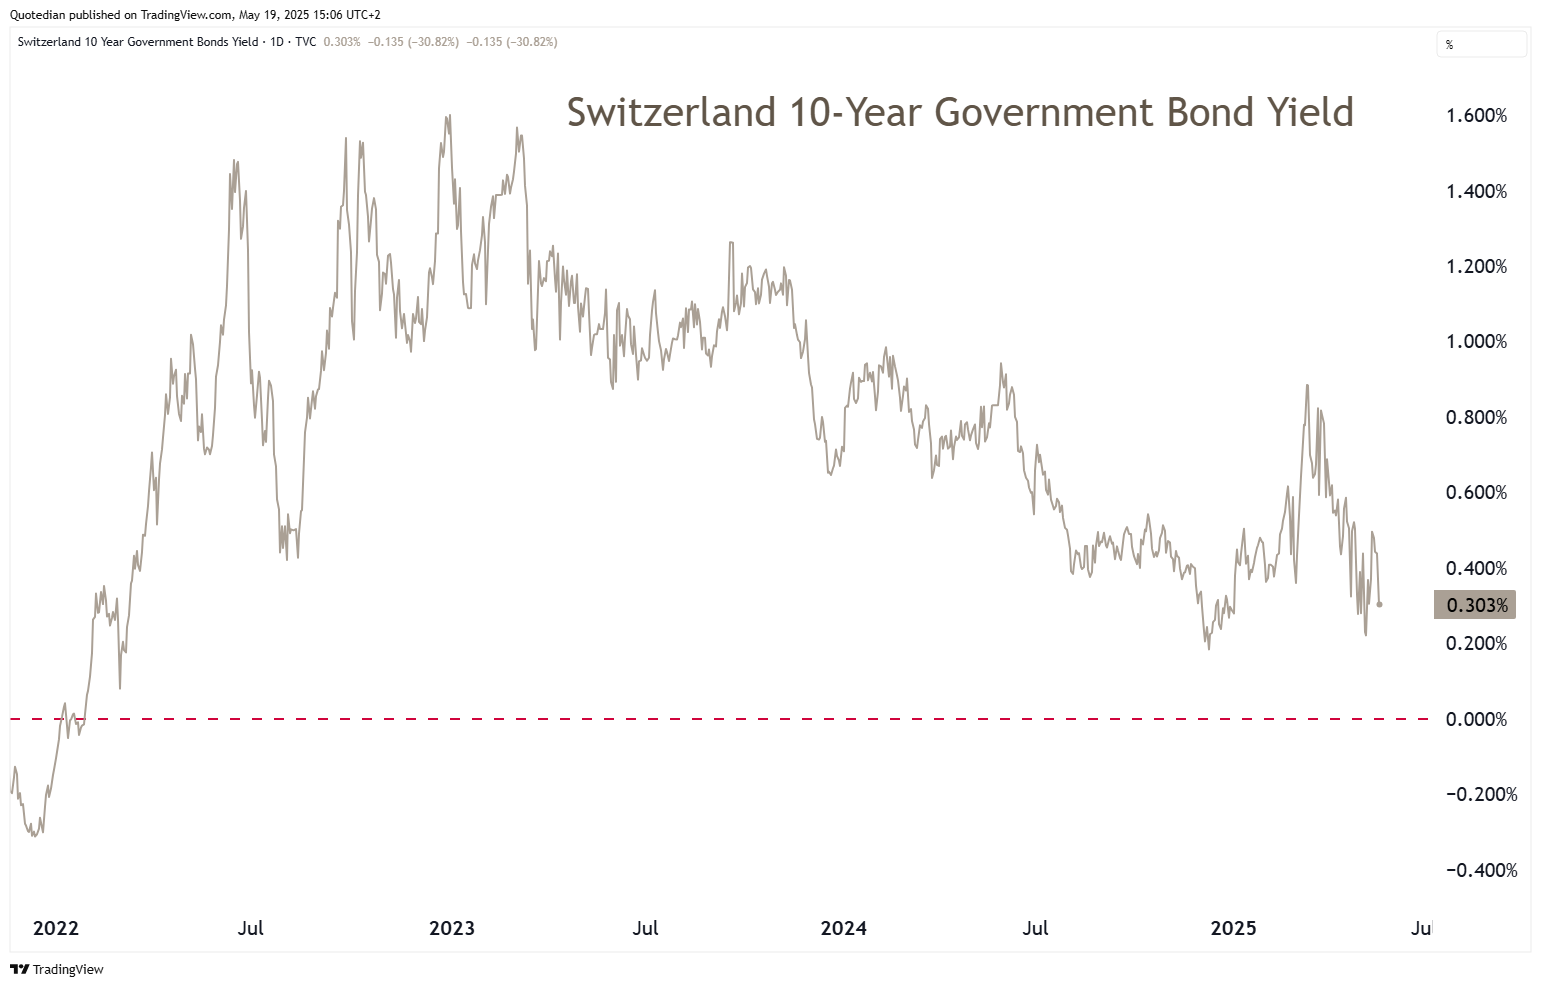
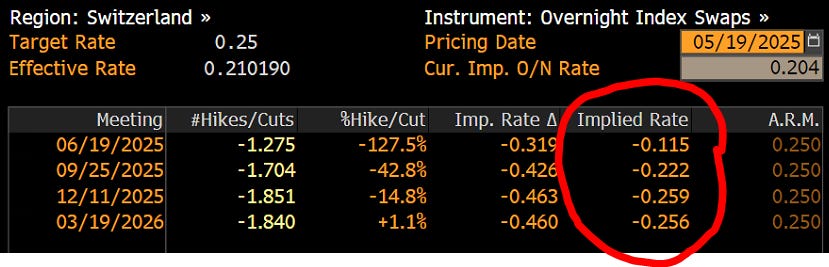
For this later country, futures traders expect the Swiss National Bank (SNB) to set a negative policy rate by latest September, maybe already June:
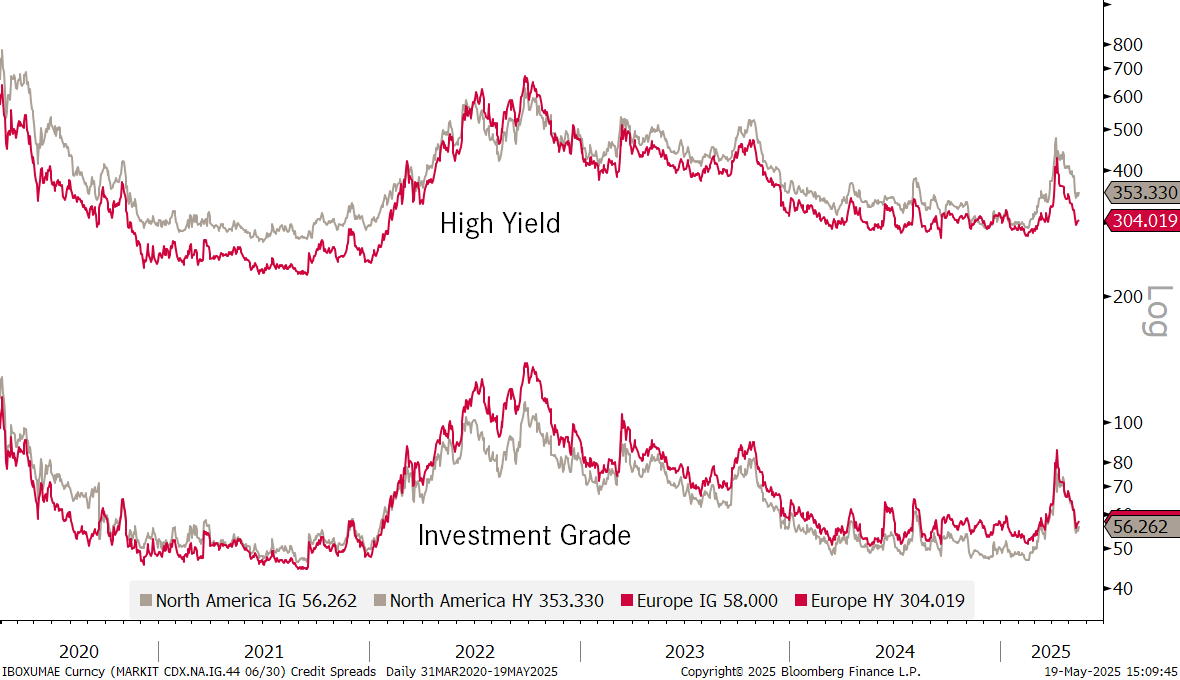
In the department of credit risks, investors have nearly completed the up-down round trip:
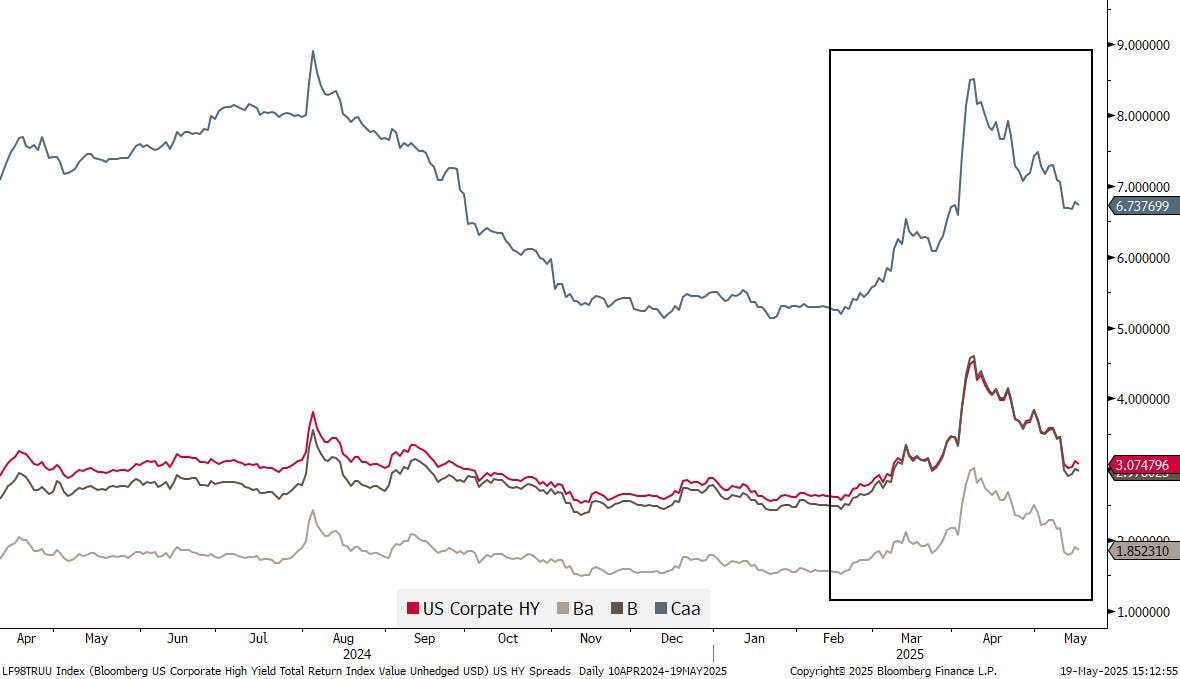
Though a close up on US high yield for example shows that not all risk segments have recovered equally:

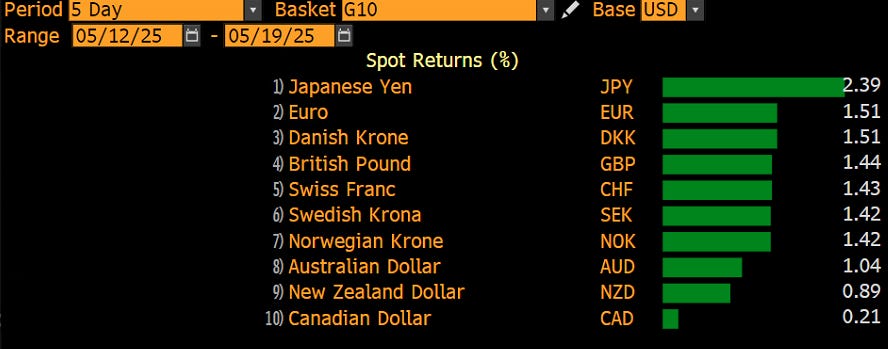
In the currency space, the US Dollar has been weakening since the Moody’s downgrade on Friday,
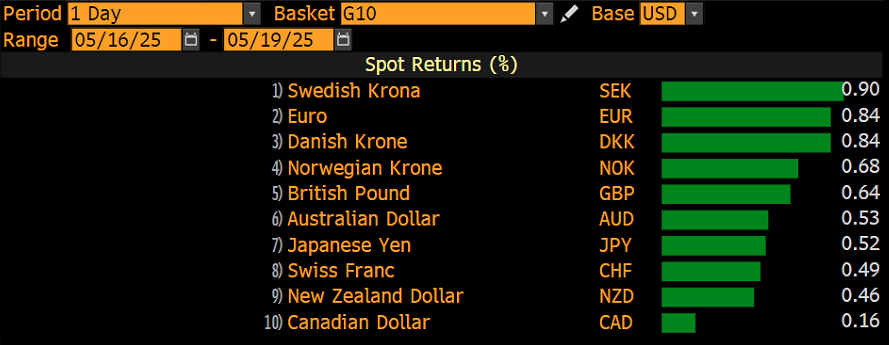
but actually had been doing so already since the beginning of last week:
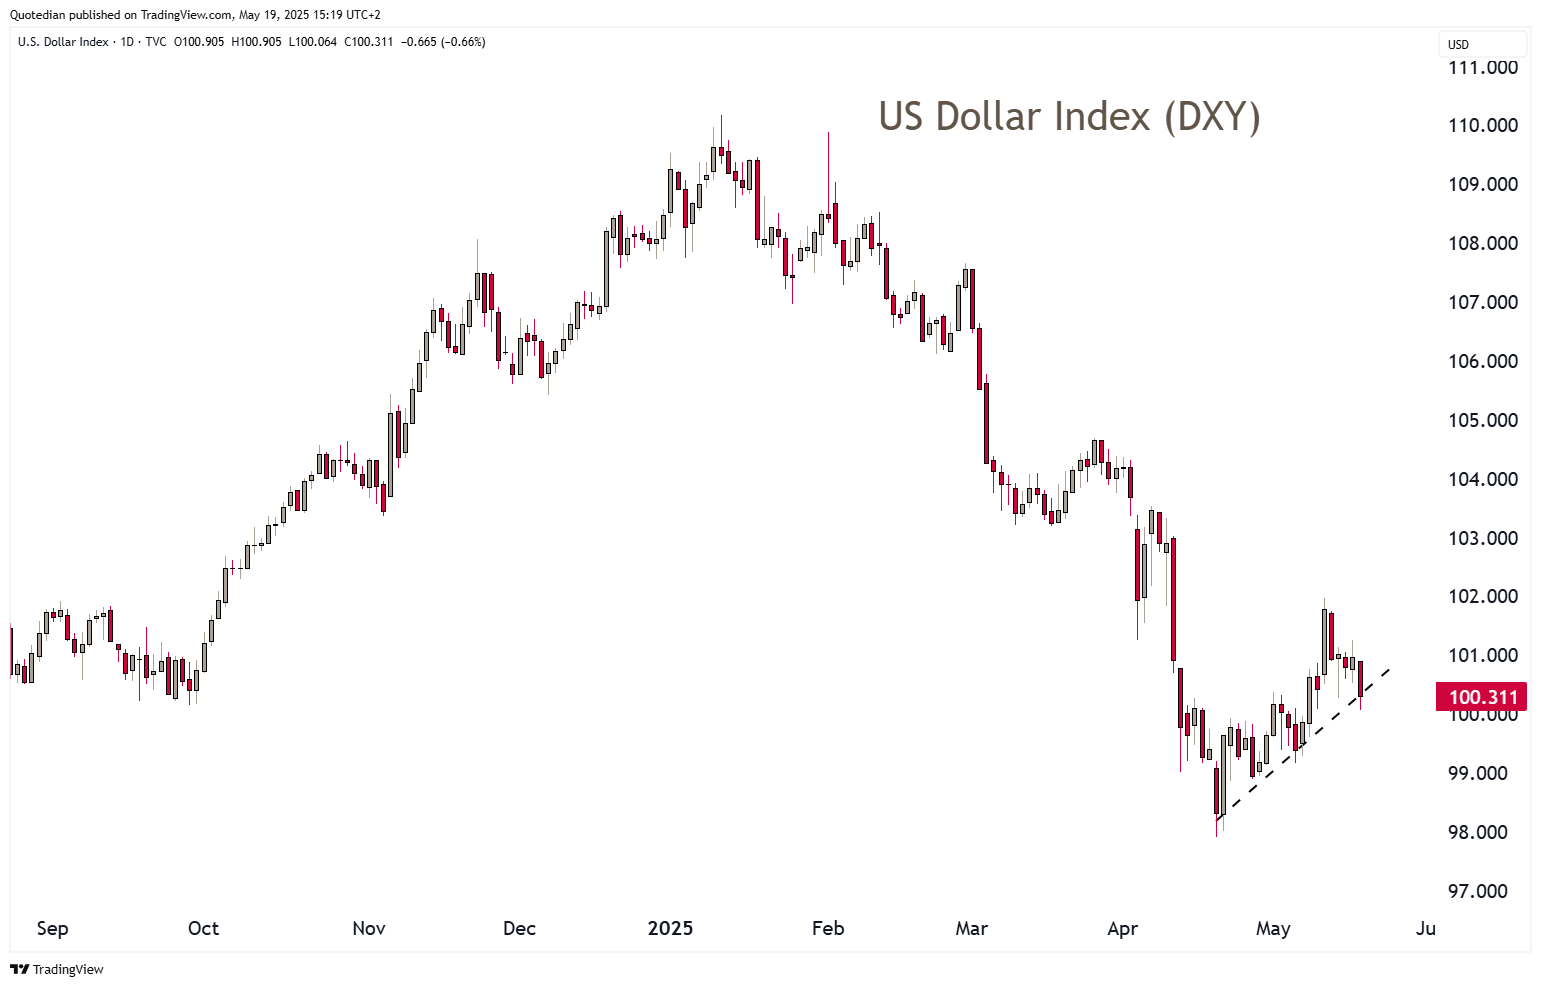
The Dollar Index (DXY) is at risk of falling out of its short-term uptrend in place since mid April:
On the EUR/USD chart, this translates as such:
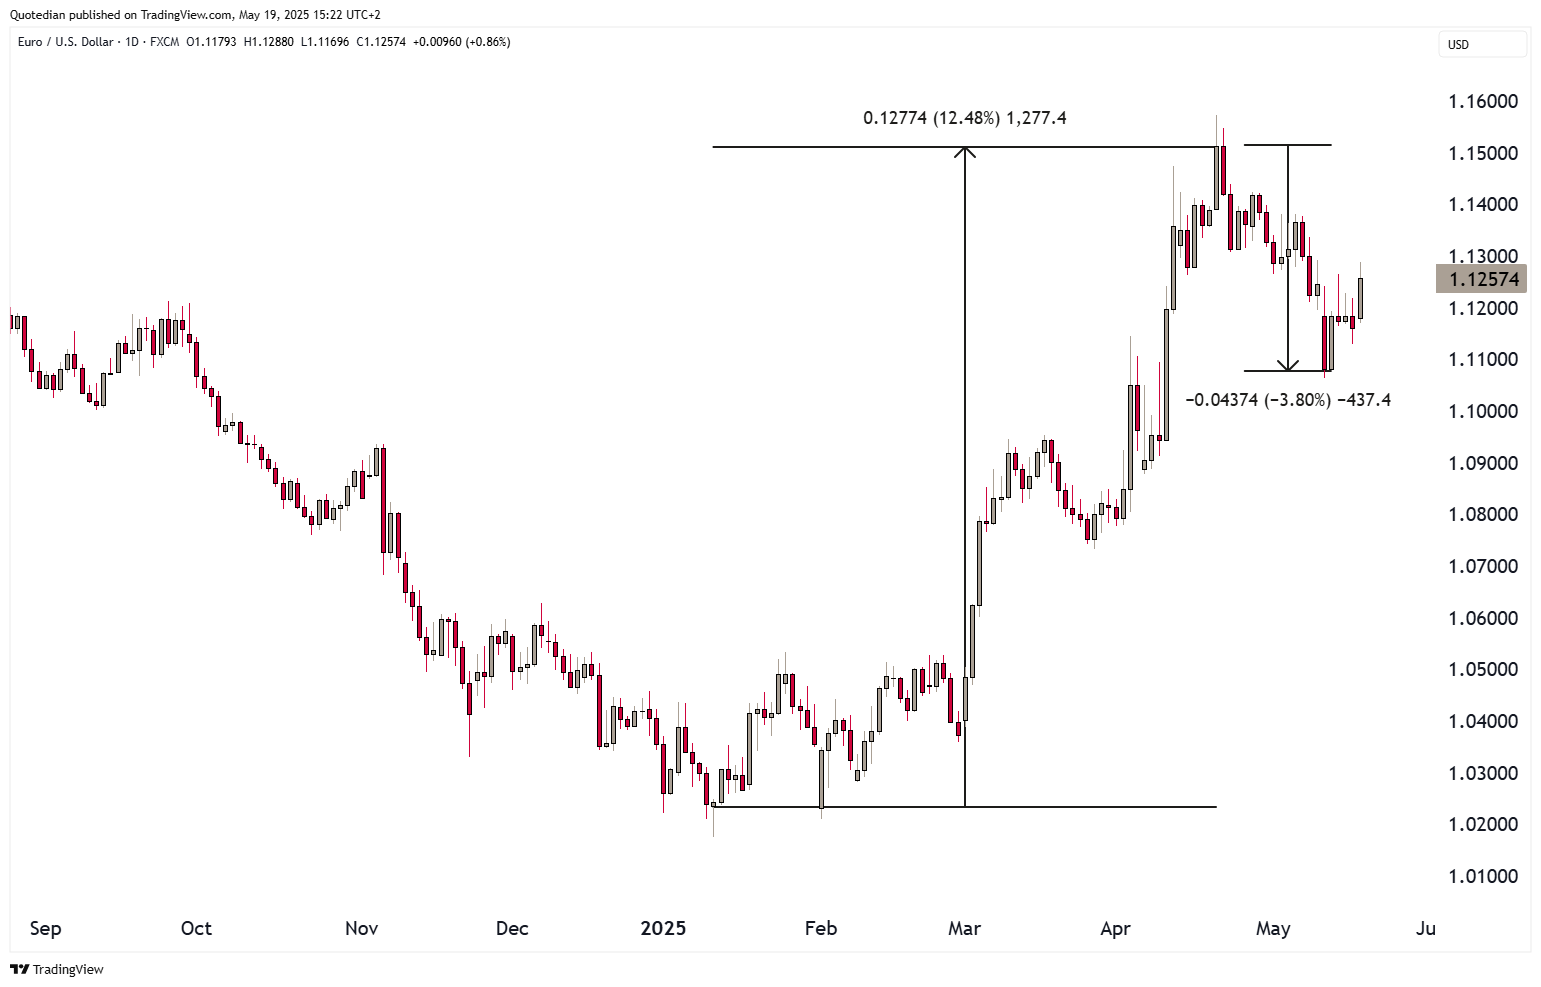
The recovery “rally”, if ended now, has been relatively shallow at only about one third of the prior decline, hinting to more structural weakness for the Greenback to come.
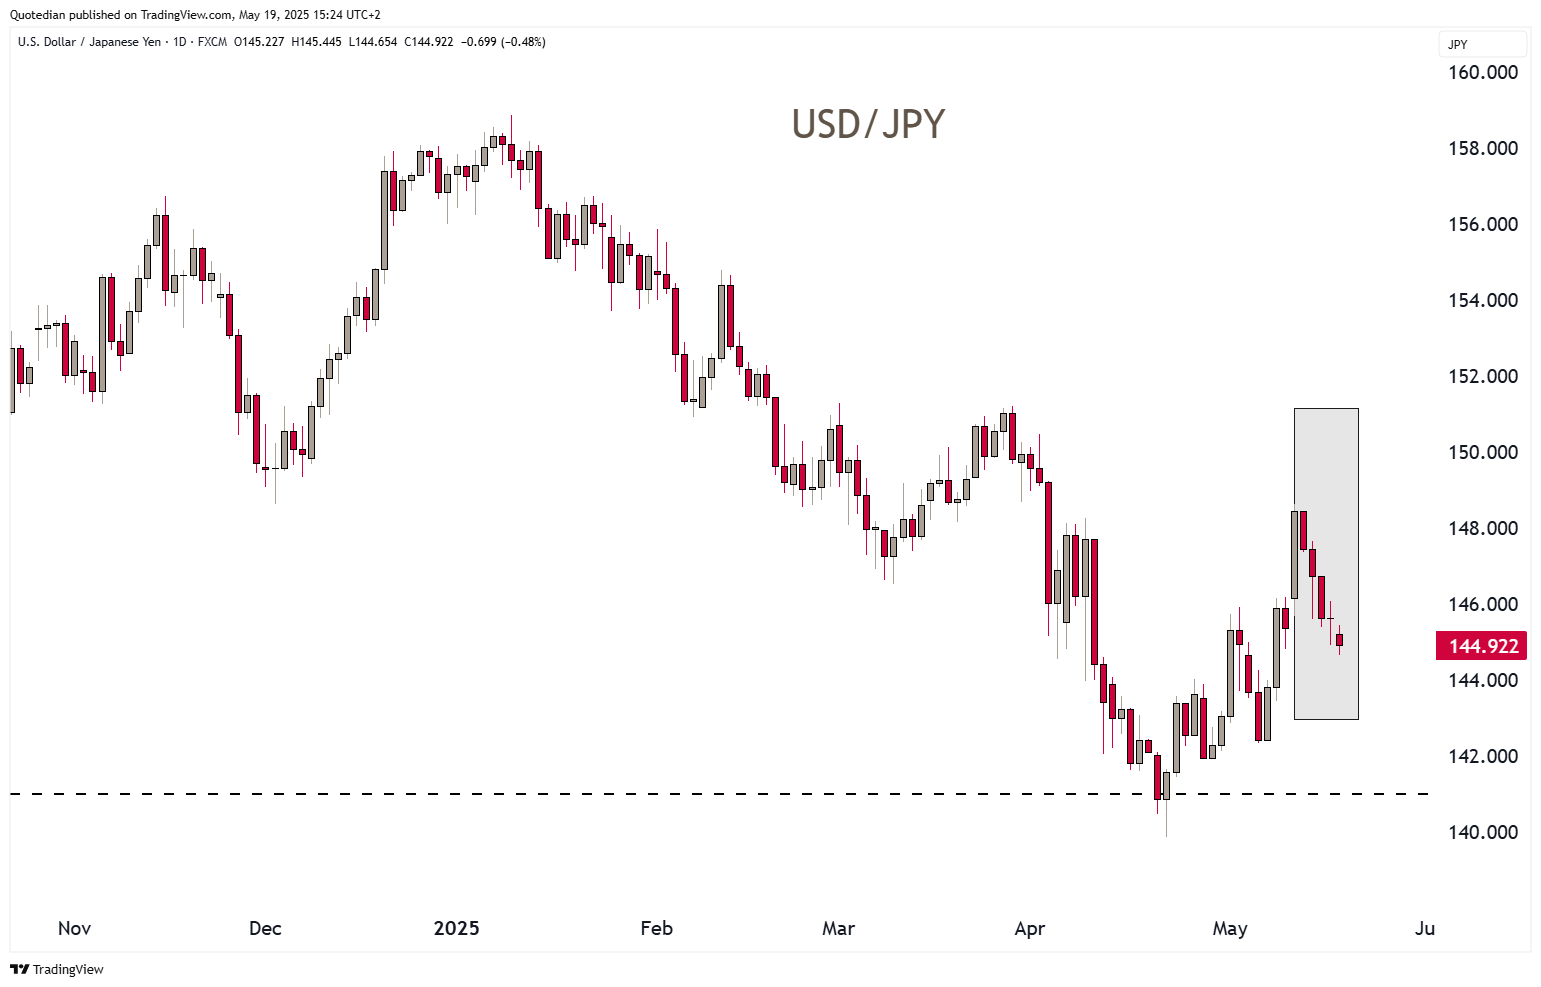
The USD/JPY cross remains extremely volatile, with the currency pair rapidly approaching key support at 140 again:
How low will the SNB take its policy rate to weaken the Swissy?
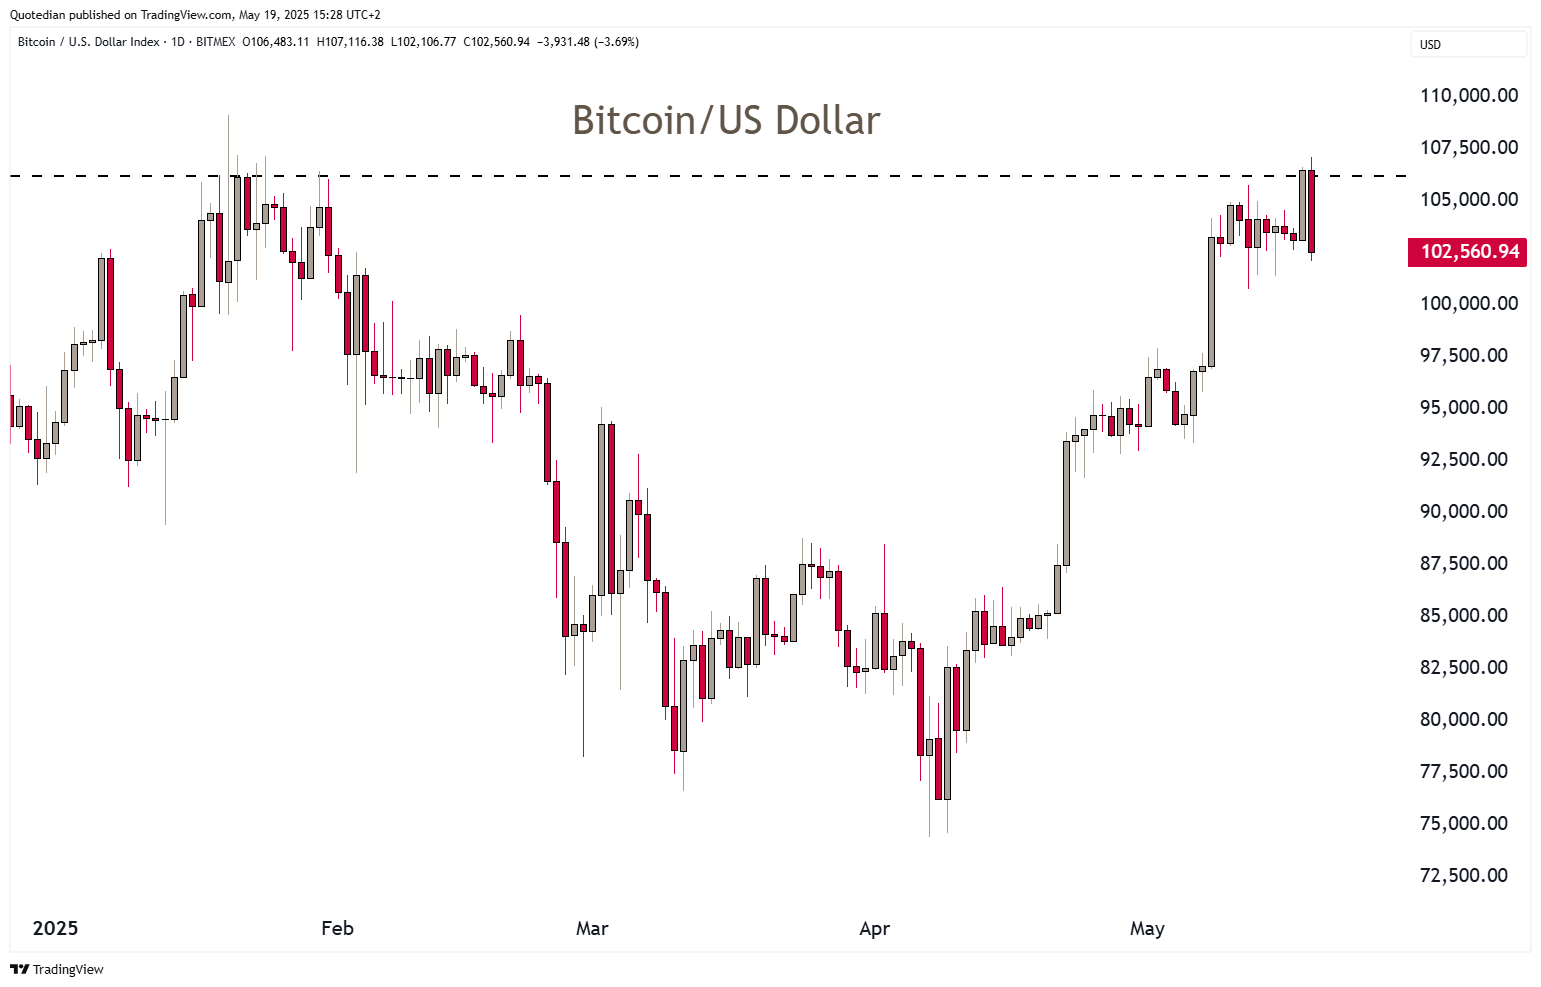
In cryptocurrencies, Bitcoin has knocked its head against key resistance … for now:
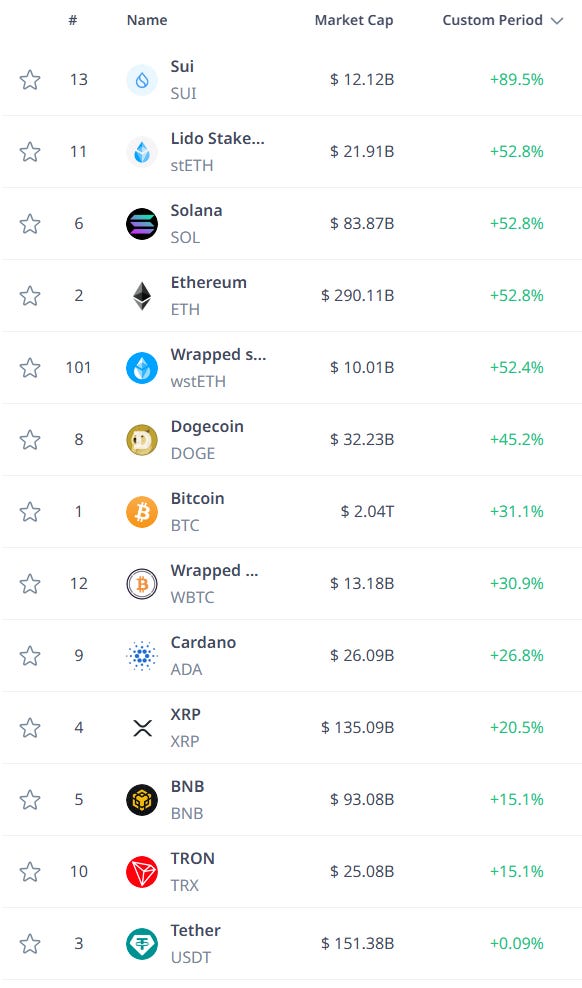
Even so, some of the cryptocurrency performances have been close to stunning:
Here’s another stunner … the chart below shows that two assets, which intuitively one would have guessed should behave similar due to their potential to ‘hedge’ fiat-currencies, actually have a negative correlation to each other:
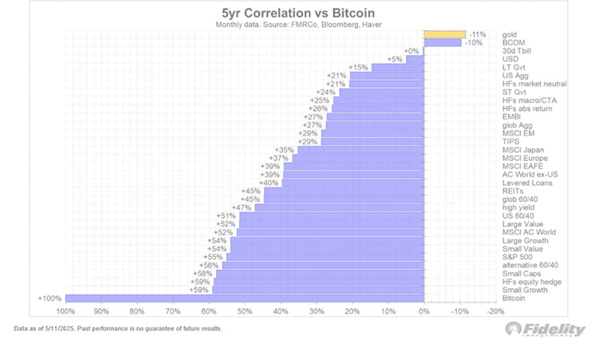
Yes, Gold and Bitcoin!

Let’s use the previous observation as segue in to the last section of these week’s letter and have a closer look at gold.
The yellow metal seems to have a put a double-top in place close to the levels where we reduced our tactical overweight, however, so far it has also failed to break down meaningfully:
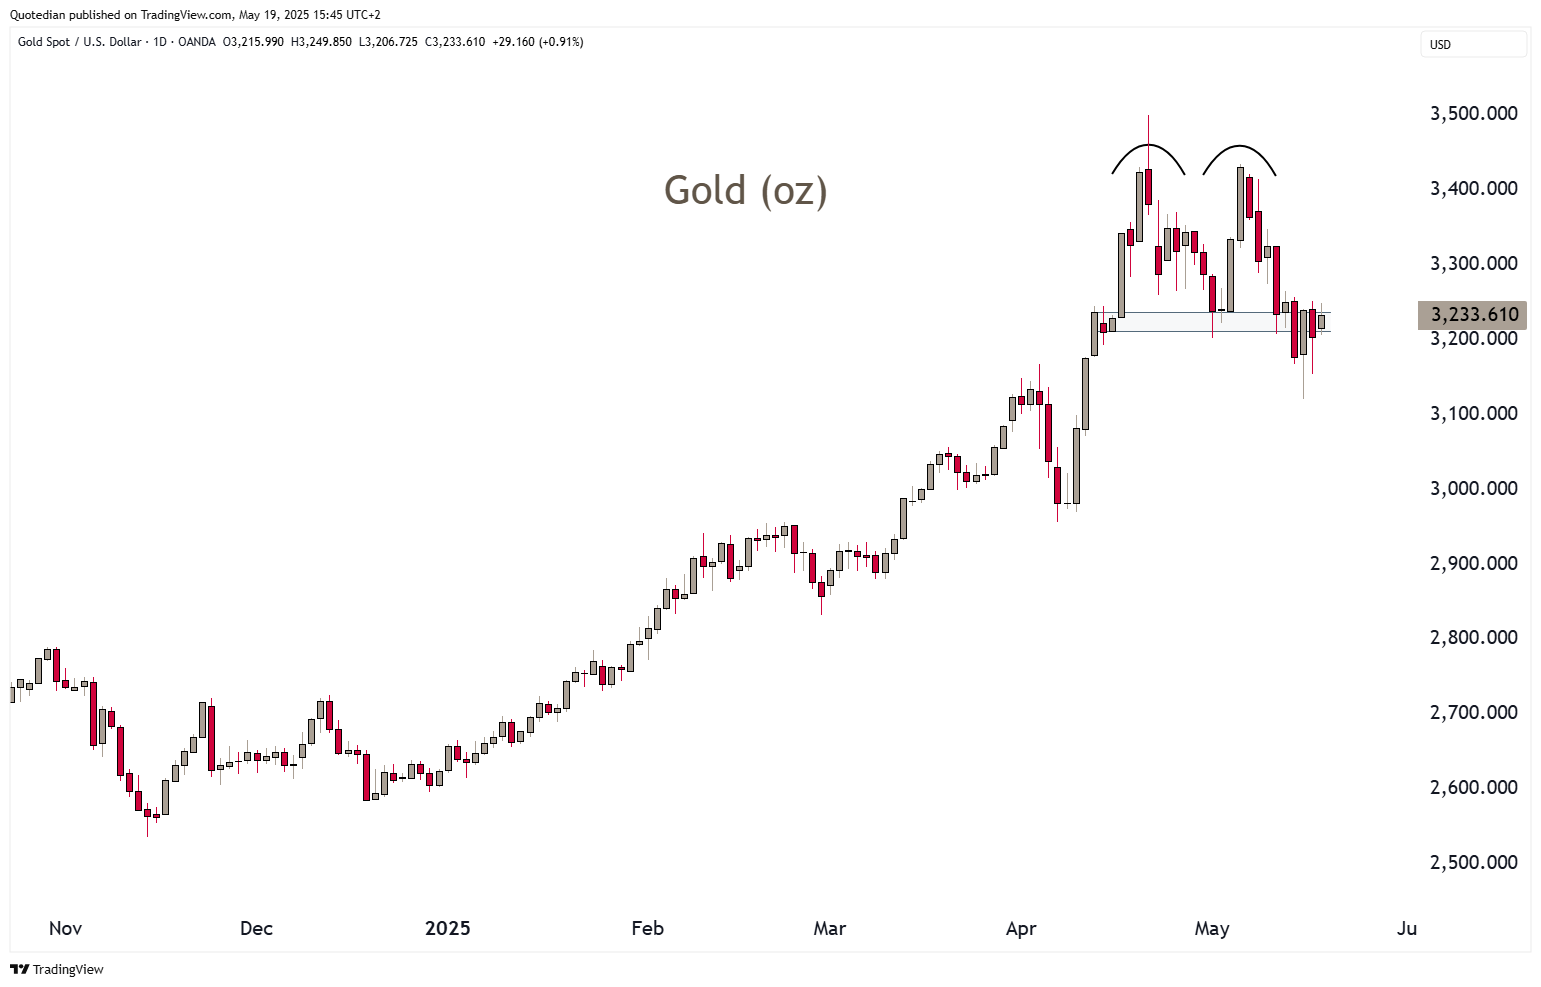
I still prefer a dip to below 3,100 here, but stay open-minded, especially if a close above 3,400 should produce itself. Structurally, Gold clearly remains in a secular uptrend.
OK, enough for this week. But just before we hang up, here’s financial analysts’ joke, courtesy JC Parets at Trendlabs:
A technical analyst and a fundamental analyst are chatting about the markets in the kitchen.
Accidentally, one of them knocks a kitchen knife off the table, and it lands right in the fundamental analyst's foot!
The fundamental analyst yells at the technician, "Why didn't you catch the knife?"
"You know technicians don't catch falling knives!" the technician responds.
And then he asks the fundamentalist, "Why didn't you move your foot out of the way?"
"I didn't think it could go that low..."
Have a great week!

In reality, you need no other Disclaimer than the one above, but just in case:
Everything in this document is for educational purposes only (FEPO)
Nothing in this document should be considered investment advice
Investing real money can be costly; don’t do stupid shit
Leave politics at the door—markets don’t care.
Past performance is hopefully no indication of future performance
The views expressed in this document may differ from the views published by Neue Private Bank AG