What's up, Doc?
The Quotedian - Vol VII, Issue 6 | Powered by NPB Neue Privat Bank AG
“The most contrarian thing of all is not to oppose the crowd but to think for yourself.”
— Peter Thiel
A bit over a month ago, we published our CIO Office Outlook for Q1/2024, which kind of focused on the entire year ahead. You can read the short version here, and the long version here.
The subtitle of the report was “Muddle Through” and referred to in a year were growth and inflation (or disinflation) were looking for confirmation and may just muddle through as in 2023, we would see the same for global financial markets.
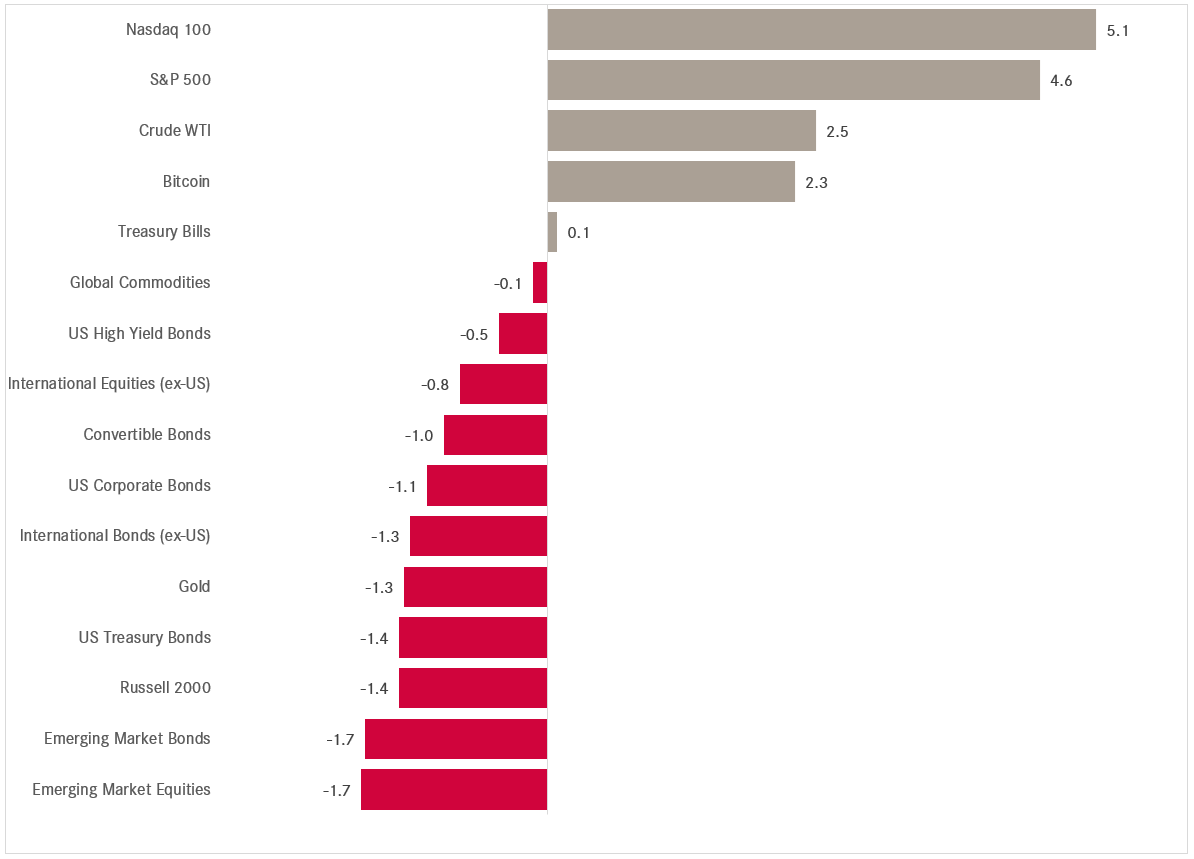
Now, over a month into the new year, we clearly have seen muddling going on is global asset classes:
Stocks and cash up a bit, bonds, commodities and real assets down a bit - so far so good.
Here’s are slightly more granular view of the above:
But we assume that under the hood, substantially more has been going on.
Overwhelmed by to much market data and economic data points? We can help you see the forest despite the trees again.
Contact us at ahuwiler@npb-bank.ch
So, let’s go on a journey by browsing through some charts for the different asset classes, simply to find out: “What’s up, Doc?”
Starting, as usual, with equities, but not as usual, with European stock markets, we observe that several regional indices have been hitting new all-time highs (ATH going forward).
Here’s the German Dax for example:
Or France’s CAC40:
One of the broadest measures of European equities, the STOXX 600 Europe index, is less than a stone-throw (read: less than 2%) from a new ATH:
The more narrow Euro STOXX 50 index, is still a bit further away from the ATH set in 2000, but it has recently taken out the pre-GFC high, which can be considered a major victory:
But, how can this be, if the European economy is seemingly going so sluggish (please note, sluggish is two notches worse than ‘muddle through’)?
This is the same question we asked ourselves last week during the NPB Anlageforum held with esteemed guests (which I hope are vivid Quotedian readers by now) at our premises.
I suggested one very obvious notion, which we also have discussed in this space on previous occasion, which is that “the economy is not the stock market and the stock market is not the economy”.
Even less so, if the companies which operate within your economy actually do most of their selling outside your economy, as is the case in Europe and which following chart neatly illustrates:
The second answer is that the stock market does not care about absolute economic data, but rather about improvements at the margin. And those, ladies and gentlemen, have been happening as the chart of the Citi Economic Surprise index for the Eurozone demonstrates:
Ok, time to hop over the pond to US markets …
Starting with the S&P 500, this one index to rule them all, has been hitting new ATHs on a regular basis since the beginning of the year, including today (7/2):
As I am typing this about half an hour before market close, the index is three points away from reaching the 5,000 milestone. That’s nearly a thousand index points higher than at the market bottom in late October! I hope we all participated in that ‘easy’ ride …
And then there’s the Nasdaq 100 …
… up 65% or over 7,000 index points since January ‘23.
One US market segment that is still 25% away from new all-time highs are small cap stocks as measured by the Russell 2000. The valuation gap between those small cap stocks to the large cap segment (S&P 5000) has become extreme:
However, for now, their fortune (grey line, rhs) are clearly a function of interest rates (10y US treasury yield, red line, lhs, inverted):
The correlation is not always as perfect as now, but for the last 9 months or so it has been holding up well.
Over in Asia, Japan’s Nikkei continues to close in on the ATHs marked in December 1989, with only about 7% to go:
And as last mention in the equity section, we of course have to talk about Chinese equities.
As the Chinese New Year celebration is quickly closing in (starting this Friday), the year of the wood dragon is supposed to bring evolution, improvement and abundance. The Chinese government for sure has tried hard to make that come true for the stock market over the past few weeks, with limited success so far, as we highlighted in our QuiCQ note yesterday morning:
Nevertheless, I would not go short into the long holiday period, just in case Xi has a surprise up his sleeve…
Over to the rates section!
In the equity section above, we discussed how small cap stocks, need lower rates to start seeing a sustainable rally. However, this decrease in rates has become less likely over the past few weeks, as economic data has been coming in strong, whilst inflation, at least on the surface, seems contained.
As just mentioned, (US) Economic strength surprised to the upside for example in the form of a very strong labour market. The NFP reading was the strongest in a year,
beating even the most optimistic estimate by a wide margin:
Leading, but soft indicators such as the ISM survey, have been improving. The ISM manufacturing (grey) reading beat estimates clearly when reported last Friday, but remained below the 50 level, which means economic contraction. However, the more volatile but usually leading ISM Manufacturing Price Paid indicator (red) shot well into economic expansion territory:
All this, whilst inflation measured by the high frequency Truflation indicator continues to suggest further disinflation:
All this would hint, that JP (as in Jerome Powell) may be indeed avoiding to land the economic airplane at all.
For definition purposes:
Hard Landing - Economy growth falls below potential
Soft Landing - Economy grows at potential
No Landing - Economy grows above potential
Or in other words, as I asked in a QuiCQ note on Tuesday, are we indeed moving into a disinflationary boom environment, aka Goldilocks?
All of this has taken a March rate cut pretty completely off the table and reading between the line the first cut, if all all, may not be upon us until June:
No wonder, the conflicting message of growth and benign inflation is confusing the sh.t out of the bond market. The US 10-year US Treasury yield has been a bit all over the place over the past few sessions:
Zooming out a bit on the same chart, the “undirectionality” becomes even clearer and maybe assuming a wide 3.70% to 4.40% trading range is one of the better assumptions to work on for now:
Similar unambigiouty can be found in European rates/yields (here proxied via the Bund):
A push towards 2.50% seems the most likely scenario for now.
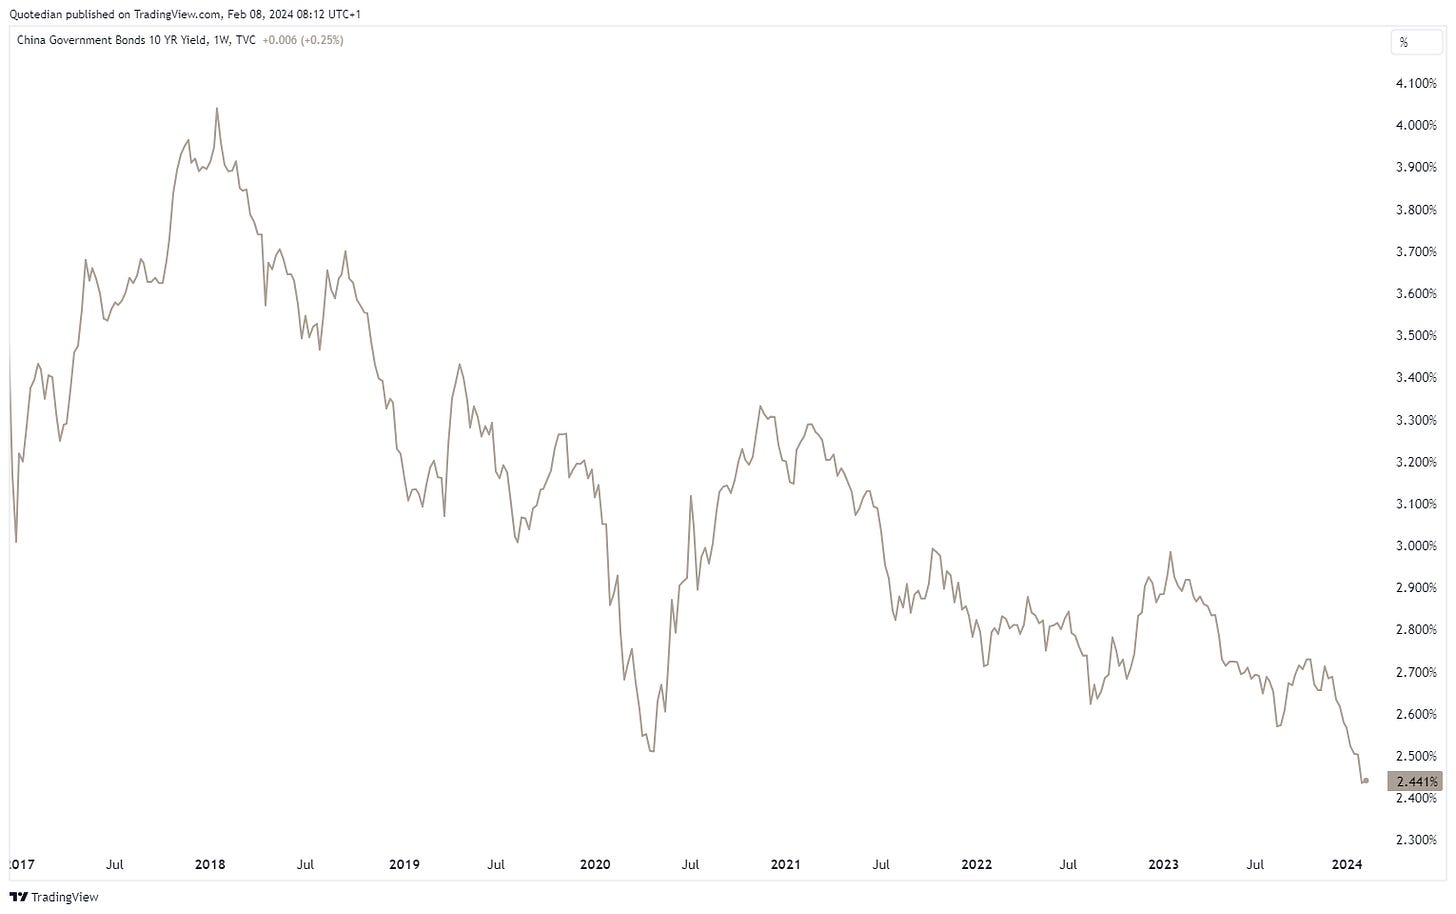
To finish off the rate section, let’s talk China again. We all have come to loath the Chinese equity markets, simultaneously completely ignoring one of the only and with a difference the best bond market rally to be had right now. Yes, Chinese Government bonds! Here’s the 10-year Chinese Govie bond yield chart:
Here’s how a Chinese Bond ETF (red) has fared over the past three years or so against a US (grey) and German (blue) ‘equivalent’:
On the back of strong economic data, the US Dollar continues to show strength against most other major currencies, as the following table of 5-day % changes would suggest:
Especially versus the Swissie the Greenback has been able to show gains this year:
But putting this into a longer-term context …
For the EUR/USD cross, as mentioned on previous instances, until we decisively move out on either side of this major apex, it is not worth taking a major punt:
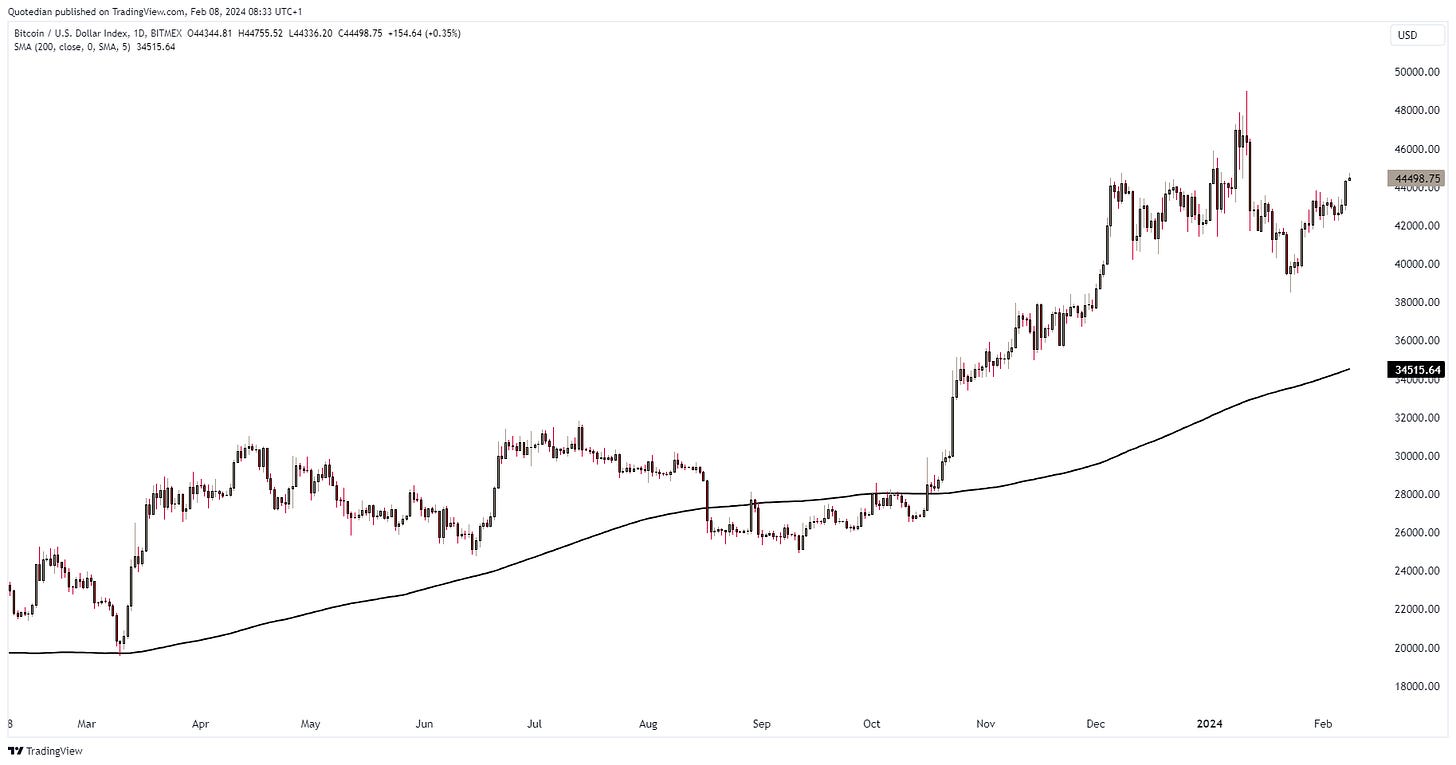
And finally, to round wrap up the FX section, Bitcoin seems to have worked off the “buy the rumour, sell the fact” constellation surrounding the Bitcoin ETF approval process and is ready to head higher, probably not least in expectation of the upcoming halving (April):
Do not be short that chart …
As usual, the commodity section is falling victim to me babbling too long in the other sections, as the time to hit the send button has come upon us. Probably doesn’t matter anyway, as you probably stopped paying attention one third into the fixed income section…
Nevertheless, allow me for one more interesting observation in the energy space…
Amid freezing conditions in parts of the country, US natural gas consumption reached a new daily record in January:
At the same time, the nearest contracts (March 24) of Natural Gas Futures, have fallen below the $2 handle:
Anyhows, enough for today, enjoy the rest of your week and especially enjoy the upcoming weekend.
André
The ever more probable soft- or even no-landing scenario of the US economy is injection new life blood into the AI ‘bubble’. But, is it really a bubble, looking at the chart below? Perhaps. Will it already trickle out as have the housing and Asia bubble at similar levels? Perhaps. Or will it resemble anything between the internet and the bitcoin bubbles? Of course, also perhaps.
Stay tuned …
Everything in this document is for educational purposes only (FEPO)
Nothing in this document should be considered investment advice
The views expressed in this document may differ from the views published by Neue Private Bank AG
Past performance is hopefully no indication of future performance


