When you can, not when you have to
The Quotedian - Vol V, Issue 107
“It was the best of times, it was the worst of times, …”
— Charles Dickens
DASHBOARD
AGENDA
CROSS-ASSET DELIBERATIONS
I think I have written about investors’ frustration regarding the current market conditions enough over the past few issues, but let me once again just summarize the setup of this Dickensian situation:
Worst of Times → Macro Picture (slowing growth, still rampant inflation), for example:
Monday’s slump in the NY Fed’s Empire manufacturing index foreboding lower national ISM readings ahead:Or yesterday’s ZEW Economic Expectations survey in Germany, now showing a lower reading than during the European sovereign debt crisis and only lower during the GFC:
And then there was of course last week’s CPI reading, which was lower than expected at ‘only’ 8.5%. This meme explains nicely how that number should be interpreted:
Best of Times → Technical pictures, with stocks having retraced >50% of the recent drawdown (see Sunday’s Quotedian), breadth trust via more than 90% of stocks in the S&P trading above 50-day MA (see yesterday’s issue) and the cumulative advance-decline for the S&P hitting new all-time highs (lower clip):
In this very conflicting picture, the investment advice is very clear:
Buy protection when you can, not when you have to
Ok, not everyone can buy protection, so let’s be a bit more specific:
If you are a trader, be tactical and large in cash
If you are benchmarked, be neutral
If you are an absolute return investor, overweight cash/short-dated bonds
If you can hedge, hedge (partially)
If you can hold options, seek upside exposure via such optionality
Did I miss any? Comment here:
To be sure, I am not advocating for an imminent drop (or raise for that matter) in risky assets, but IMHO in a very confusing environment such as now, staying put/nimble/humble/low profile is not the worst you can do.
It is like one of these situations where your wife partner asks you a question with two possible answers but both are wrong. Best say nothing!
Anyway, on with yesterday’s market observations …
Global stocks moved higher over Tuesday sections, though some divergence was observed in the US, with the Nasdaq ending lower on the day. Sector performance was also less one-sided than during the previous session:
The strength in consumer staples came mostly from decent results by Walmart and Home Depot (unofficially closing Q2 earnings season) which showed encouraging signs that the recent inflationary price pressure on the companies may be on the verge of being overcome.
Further of interest was that stocks ended the day off the session’s intraday highs, having turned down right at the very last combined, key resistance of the 200-day moving average and the downward sloping trendline:
Making a comparison for movie-goers, this is like Indiana Jones having lost his grip on the last branch as he thinks into the quicksand (breaking 4,275 last week), but now suddenly has pulled out his bullwhip (or should we say bearwhip?), clinging on onto this very last resistance.
As we were talking further up about buying protection when you can, not when you have to and given the previous S&P chart and the fact that the VIX trades at its lowest since April …
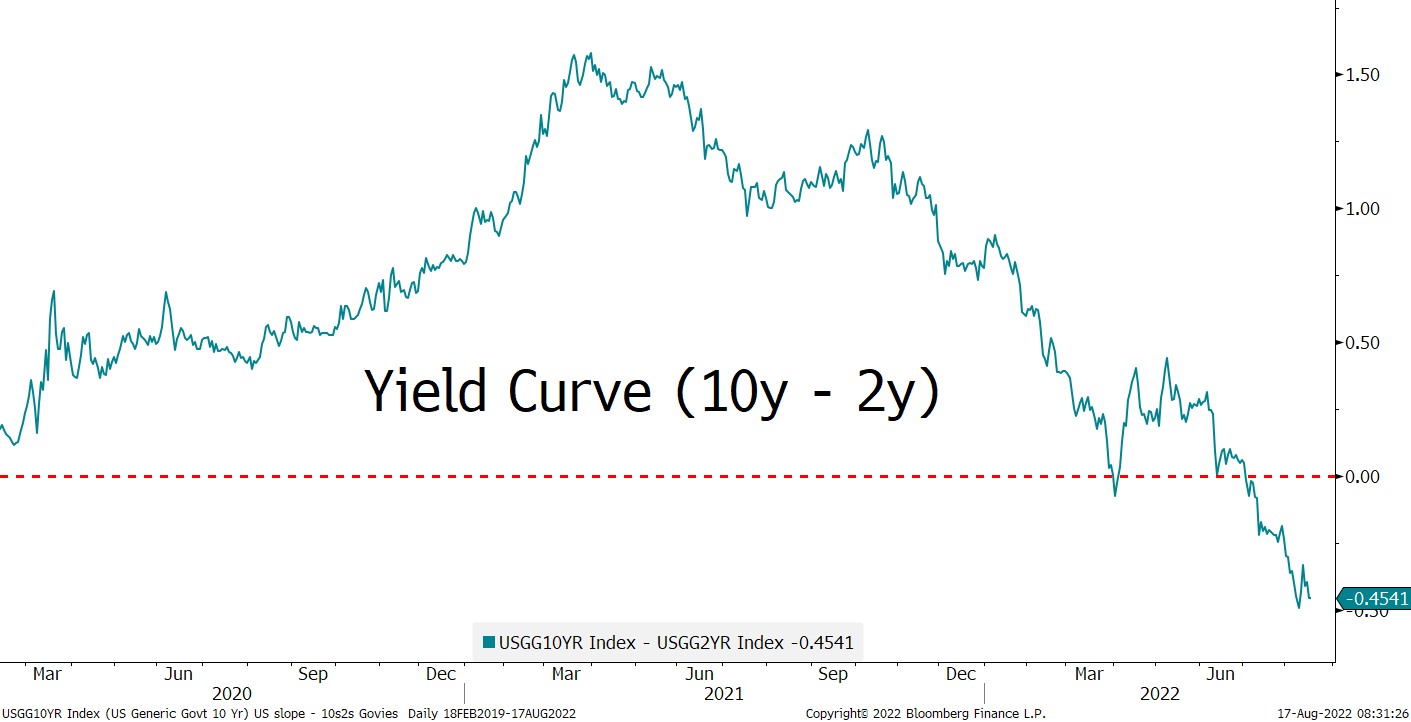
Anyway, back to markets and let’s move into fixed income, where the most important observation in yesterday’s session is probably a further inversion of the yield curve. Here’s the 10y-2y spread for example, close to making a new record of negative reading:
Or here is the 10y-3M, which is about to go negative too:
There are no better charts than these to show just how much bond traders remain concerned about the stagflationary picture.
Little be concluded from credit spreads in Tuesday’s session, so let’s move into currencies, where the EUR/USD slumped after the German ZEW report, though in the meantime has recovered all losses again. Here’s the intraday-chart for the past session and today:
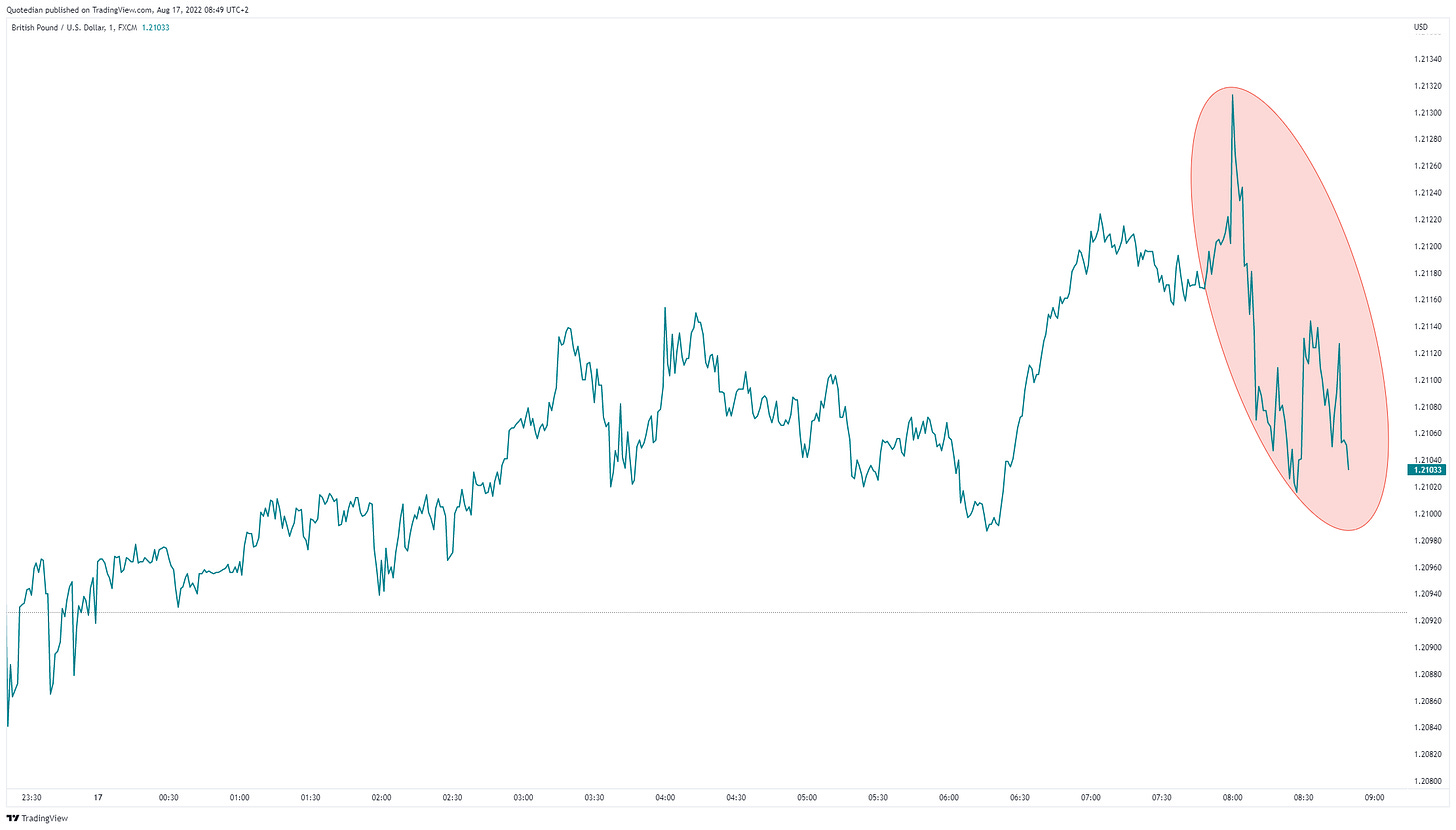
Another currency exhibiting volatility this morning the British Pound, after release of CPI data for that small island showed a 40-year record high reading of 10.1% y-o-y:
The currency saw a quick up-down sequence versus the USD, and is now about where it closed yesterday:
Let me cut it short here today, as a small technical problem (coffee over the keyboard, had to steel the son’s gaming kb to finish…), leaving out commodities for today, as it is time to hit the send button.
Have an excellent Wednesday and remember, if you are signed up yet to the Quotedian, do so here:
And if you know somebody who would like to sign up, share it here:
CHART OF THE DAY
This interesting chart from the always fascinating Jim Bianco, eponym of Bianco Research, shows possible paths for inflation by year-end. Even assuming zero inflation for the rest of the year leaves inflation well above the Fed’s 2% inflation target. Stay tuned…
LIKES N’ DISLIKES
Back soon.
DISCLAIMER
Everything in this document is for educational purposes only (FEPO)
Nothing in this document should be considered investment advice
Past performance is hopefully no indication of future performance


