WTF
Vol VII, Issue 27 | Powered by NPB Neue Privat Bank AG
“A safe investment is an investment whose dangers are not at that moment apparent.”
— Peter Thomas Bauer
Excuse my French with the choice of today’s title, but last week’s market action had a lot “WTF just happened” elements to it. With five sessions between last week’s 12%+ drop in Japanese equities and today, it is probably a good moment to look back at some of the damage done … and undone.
A quick recap of events of two weeks ago … the Bank of Japan (BoJ) decided to hike its key policy rate by a full … drumroll … wait for it … another drumroll … 15 basis points to …. drumroll … 25 basis points. That’s 0.25% in other language. Here’s the chart of the BoJ’s key policy rate over time:
No, a 15 bp rate hike should not be enough to derail the push up the Japanese Yen and the carry trade down … but it did. Here’s the total return chart of the widely popular borrow in Yen and invest in Mexican Peso carry:
The very same day, the Federal Open Market Committee (FOMC) in the US decided NOT to cut their key policy rate, which was perceived by many as a hawkish decision and accelerated and already negative price tendency further.
And then came the first Friday of the month, where the non-farm payroll number is reported. Not only did that number for a first time in a long-time surprise to the downside, but the unemployment number also jumped from 4.1% to 4.3%, triggering the Sahm recession rule:
In the past, such bad news was good news, as equity investors would take it as a sign that the Fed (FOMC) was about to cut rates, but that trick didn’t work this time around. Equity markets, as measured by the S&P 500 in the chart below, gapped lower and stayed down:
And then came Monday, 5. August… and the Japanese stock market imploded:
Not only did the Nikkei for example drop 12% on the day, but it also meant a wipeout of one quarter of the Japanese’ stock market since the new all-time high only two weeks earlier!
The reason for the sell-off? (The first person to say “more sellers than buyers” gets immediately executed!)
A week onwards since that “crash” and the real reason for that tipping point is still not quite clear and/or official but I stand to my first suspicion which was forced liquidation of a or several overleveraged market participants. The stock market usually does not decide that Japanese stock should be suddenly worth twelve percent less and the next day eight percent more worth again … usually …
That very same day the (calculated) VIX shot above 60, which triggered us to produce the following chart:
VIX levels similar to the ones seen during the GFC and at the height of the COVID panic??!! On the back of a stronger Yen and a (finally) weaker US economy??
We obviously have to tread, as always, with caution and act within the constraints of our personal risk appetite capability, but for now it seems that we were just offered an excellent opportunity to add risk (aka equity) to our respective portfolios. New recovery highs will be the final confirmation, but the most tasty part of the move will be over by the time we get sort of confirmation.
Let’s have a look at a couple of charts of benchmark equity indices before we turn more stock specific. Here’s the S&P 500 for starters:
The index was down ~10% from the July 16th top and up about 5% from the August 5th panic bottom. So, was August the 5th THE bottom? Chances are not bad, but we clearly need to watch the level for a relapse. Taking out that reaction low could decisively turn the risk appetite of market participants off.
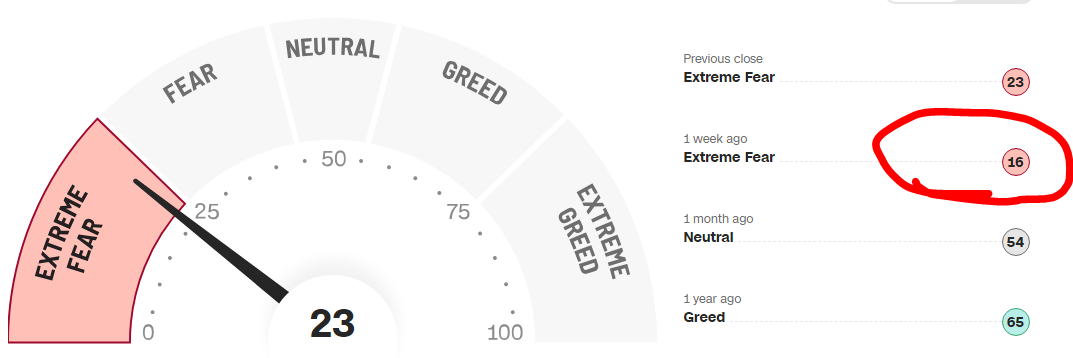
Though according to CNN’s Fear and Greed index, that risk appetite was already bombed out last week, making another argument for the bottom already being in:
The Nasdaq 100, down >15% from its most recent ATH, briefly traded below its 200-day moving average (MA) last Monday, but closing above it again on the same day has also a bullish tone to it:
We also raised the question last week if this was it for technology stocks’ outperformance, i.e. if we should brace for sector rotation and look for alpha somewhere else. The following charts suggest that this could be a very valid assumption to be made:
Over in Europe, the broad STOXX 600 index traded below the 200-day MA for two days, but has recovered above it again about mid-week last week:
The narrower Euro STOXX 50 however still trades below the 200-day threshold:
Switzerland’s SMI looks very intriguing, having held exactly were it was supposed to:
Ok, time for an updated look at those Japanese stocks. Here’ s the Topix index:
That Monday gap open was filled already on Wednesday - more upside is needed now to maintain/regain a more bullish outlook.
Chinese mainland stocks, as measured via the CSI300 index, continue to offer a desolate picture:
While Indian equities (BSE500) continue to be pretty much the mirror picture of their Chinese cousins:
Time now to look at the top performing stocks in the US and Europe on a year-to-date basis and how they have performed during the past five session:
So, all in all the following Meme probably describe last week best:
Ok, let’s check in on fixed income markets now.
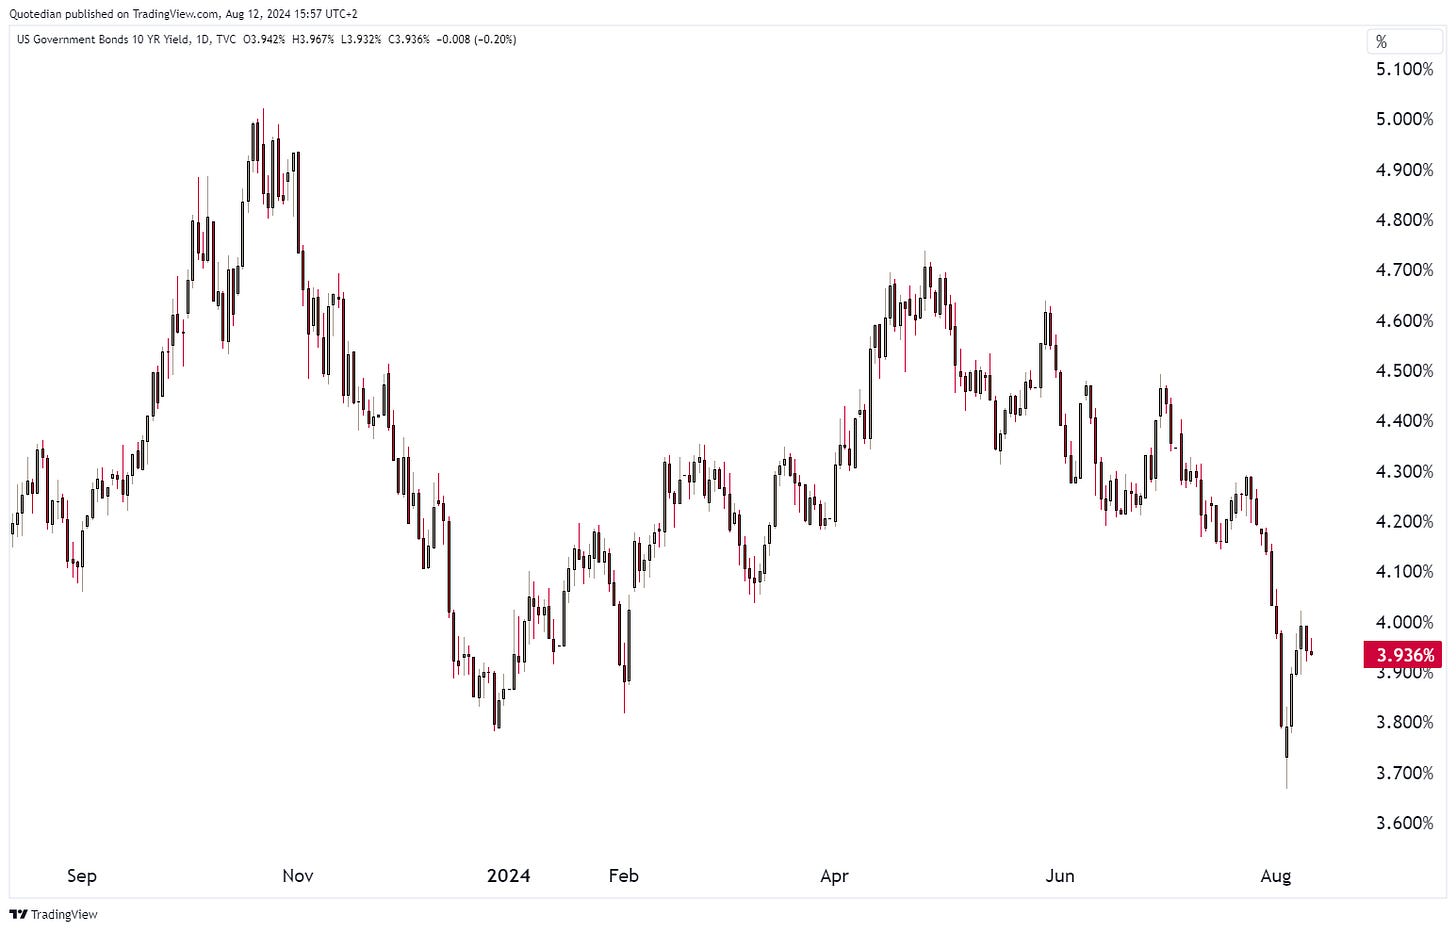
The US 10-year treasury yield was pushed as low as 3.67% during last Monday’s panic moment - its lowest level in well over a year:
But of course was the yield sell-off (bond rally) not only based on the panic going on in equity markets, but rather it was already a function of weaker economic growth as discussed further up.
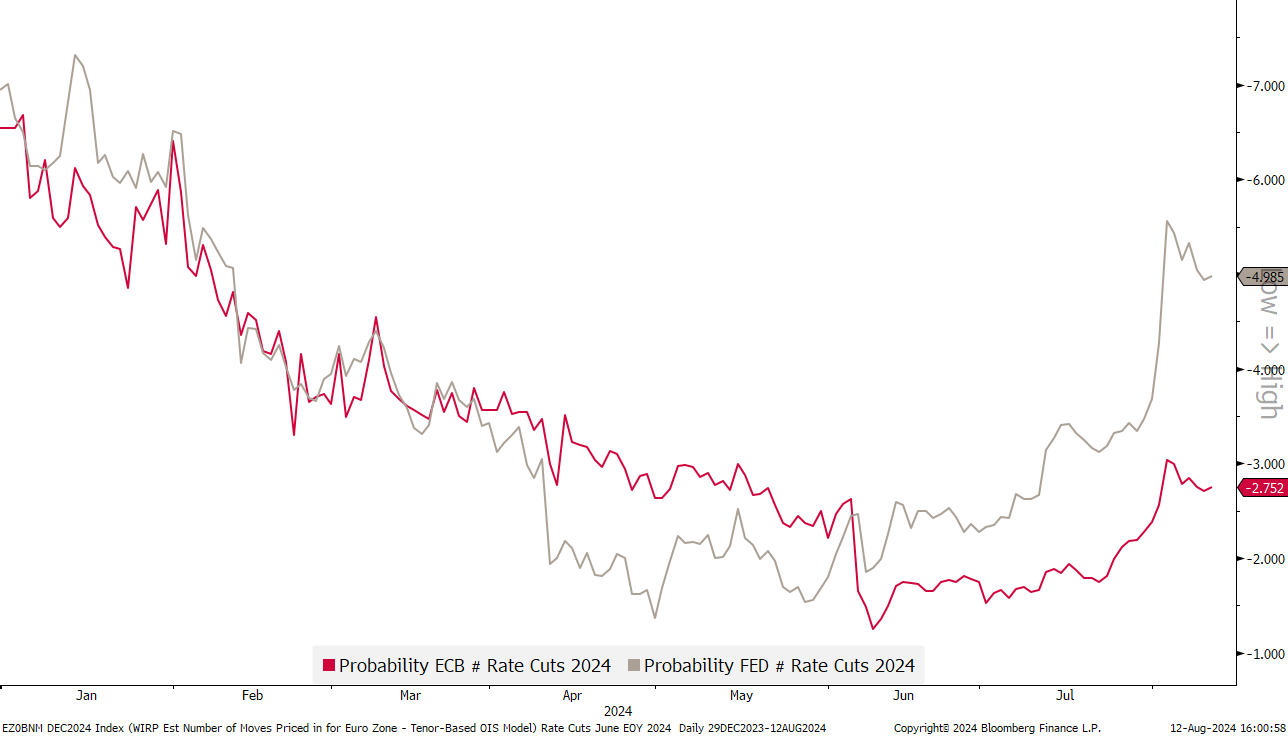
Especially after Friday’s NFP and unemployment number did the markets implied expecation for Fed rate cuts (grey line) increase dramatically,
leading also for the (still) inverted yield curve to continue with its “unwind” process:
German yields, as a proxy for the European rates market, dropped as low as nearly two percent last Monday:
And also here is the multi-year (10y-2y) inversion about to end:
In currency markets, the Japanese Yen has obviously been the main topic, with the currency have strengthened in excess of 12% versus the US Dollar during one stage of the rally:
Versus the Mexican Peso, the other side of that famous notorious carry trade, the Yen even rallied 25% at one stage:
BUT …
should the entire FX move since begin of the carry trade (2020?) unwind …
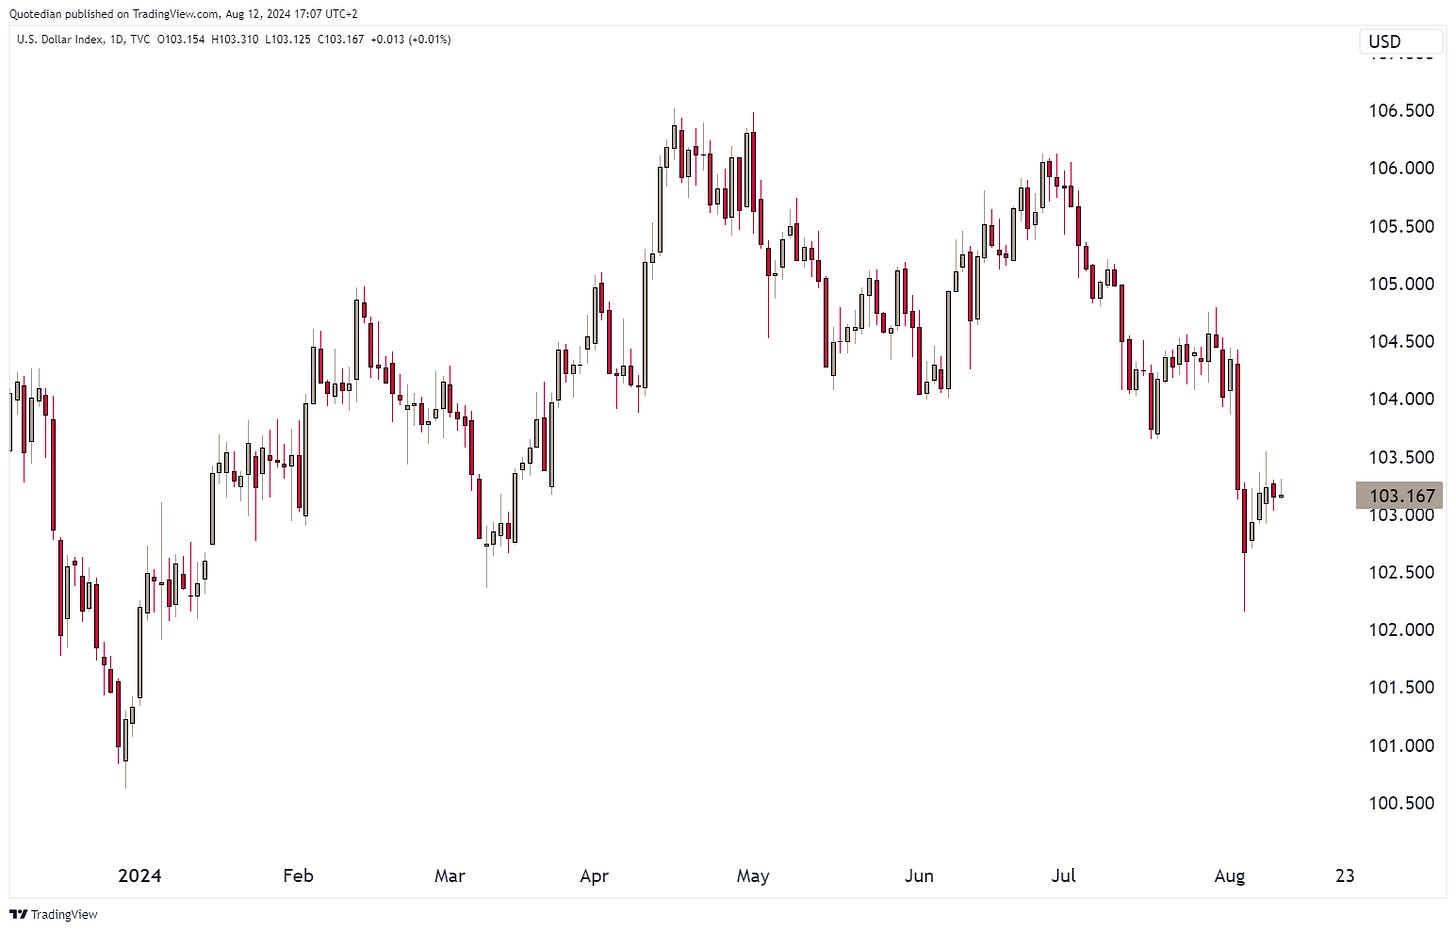
As already mentioned last week, one of the better “news” of last week was that the US Dollar did NOT jump during the risk off period, indicating that the sell off indeed may be of temporary nature only. Here’s the Dollar Index (DXY):
And here the greenback versus the glittering wonder that is the Euro:
Though the Euro seems to be on the verge of a breakout higher, we are still within a wide trading range and only a decisive move above 1.12 would change that.
Bitcoin was an extra-tough trade last week, as the cryptocurrency dropped to below 50,000 only to recover above 60,000 again the very next day:
Finally, in the commodity space, Gold is exhibiting upside momentum again, with the yellow metal potentially closing at a new all-time high still today:
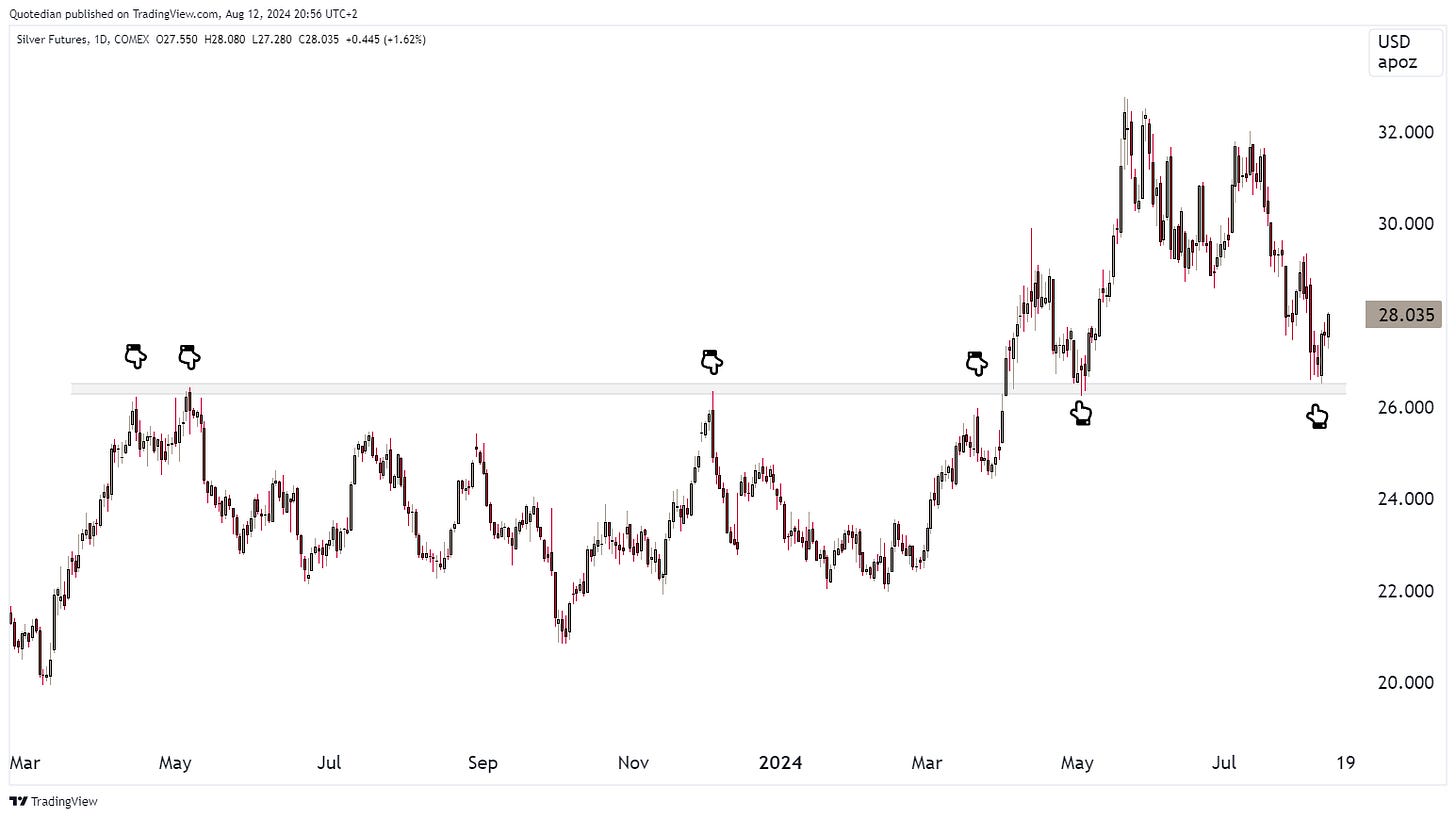
In last Friday’s QuiCQ (click here) we suggested that “make or break” time had come for Silver. For now, that trade to the upside is working out pretty decently:
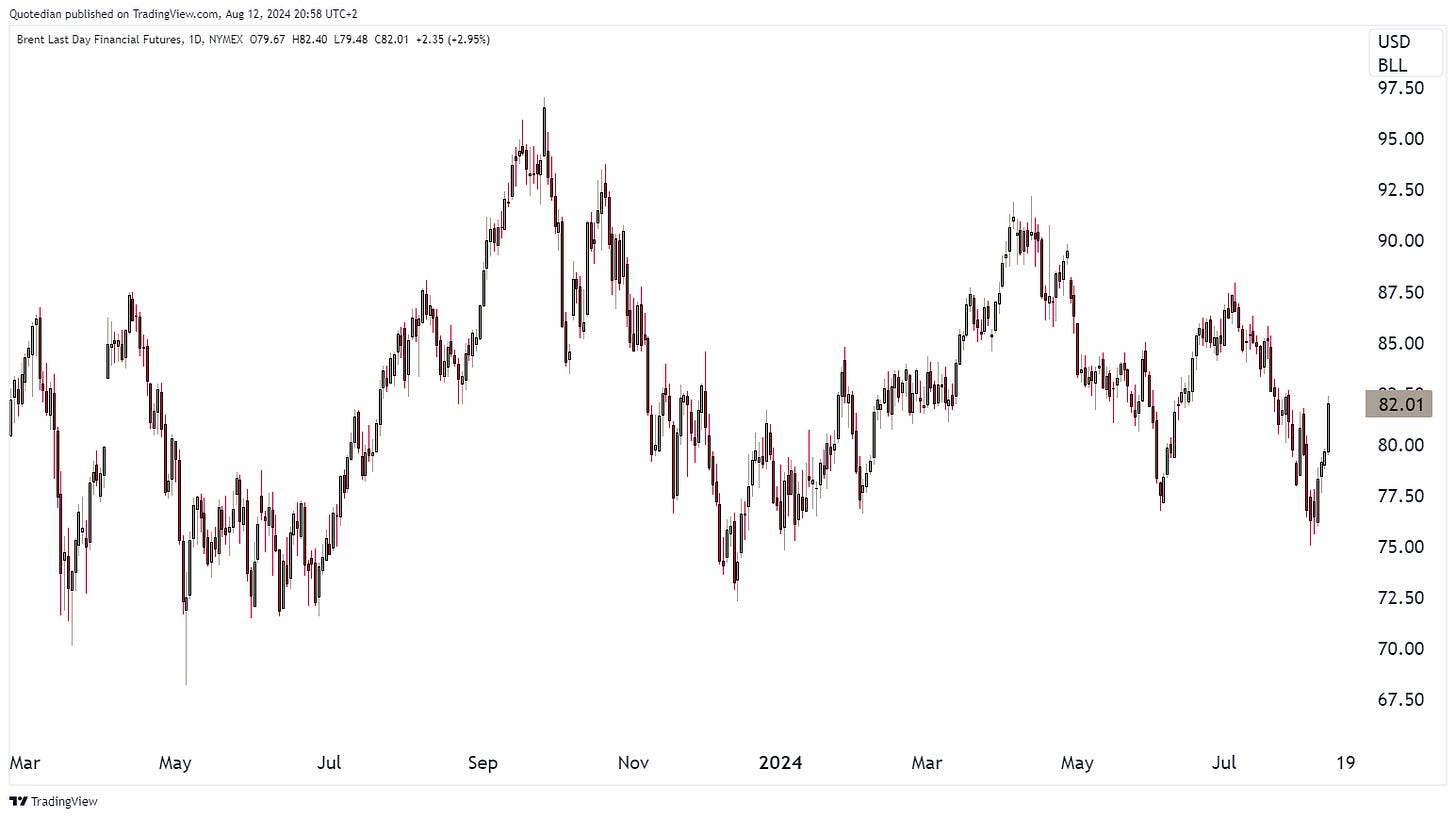
Oil is trading higher too, probably as geopolitical worries (Iran retaliation, Ukranian incursion) outweighs economic growth concerns:
In the context of the Ukranian “invasion” of Russia, watch European gas prices, which have been sneaking higher into the offensive starting over the past weekend:
This week we will get US PPI and Eurozone plus Germany’s ZEW survey all released tomorrow, but the main fun will be on Wednesday when we get inflation numbers out of the UK and the US.
And that is about all for this week’s Quotedian. As announced, our short-term newsletter, The QuiCQ (www.quicq.ch) will be hitting your inbox on a nearly daily basis going forward, with a slightly larger dashboard, a short market comment and the usual chart of the day. Make sure to subscribe should you net yet have done so:
Chart 1:
Now that the S&P 500 companies are more than 90% through the Q2 earnings reporting season, let's do a quick check up on how Corporate America is faring. In short, there's no sign of an imminent recession as S&P 500 earnings rose to a record high during Q2.
“Chart” 2:
Quite clever (and very sarcastic)
Everything in this document is for educational purposes only (FEPO)
Nothing in this document should be considered investment advice
Investing real money can be costly; don’t do stupid shit
The views expressed in this document may differ from the views published by Neue Private Bank AG
Past performance is hopefully no indication of future performance


