3 Trillion Apples a Day ...
The Quotedian - Vol VI, Issue 48 | Powered by NPB Neue Privat Bank AG
“Three trillion Apple(s) a day, keep the underperformance away”
— The Quotedian
DASHBOARD
AGENDA
CROSS-ASSET DELIBERATIONS
Not a very original title and quote today, but a) unless you live in a cave without WiFi, you must already know that Apple on Friday became the first company to reach a $3,000,000,000,000 market cap and b) today’s focus is on the month-, quarter- and half-year end for financial markets.
As usual, at the end of every month, we review the stats on one month (ticker, bold bars) and year-to-date performances (finer, semi-transparent bars). This month with the added advantage that it is also the quarter- and half-year end. What could financial market buffs like us wish for?
Charts, you should reply.
And yes, we’ve got charts. A lot of them. Monthly candle charts (nearly all of them), in order to keep the big picture overview.
So, without further ado, let’s dive right in …
The good old Quotedian, now powered by NPB Neue Privat Bank AG
Looking for the big picture overview? Then don’t miss our Quartely CIO Outlook. Next issue out in the next few day. Interested? Contact us at info@npb-bank.ch to receive your copy.
Starting with the most popular global equity benchmarks, no doubt is starting to turn out to be an excellent year for equity risk, despite all the headwinds apparent:
The Nasdaq 100 for example, up nearly 40% YTD for example, makes it the best first half year for this index … EVER. And this during a year where the Fed has continued to raise rates on three more occasions.
Now, remember this graph we discussed at the beginning of the year:
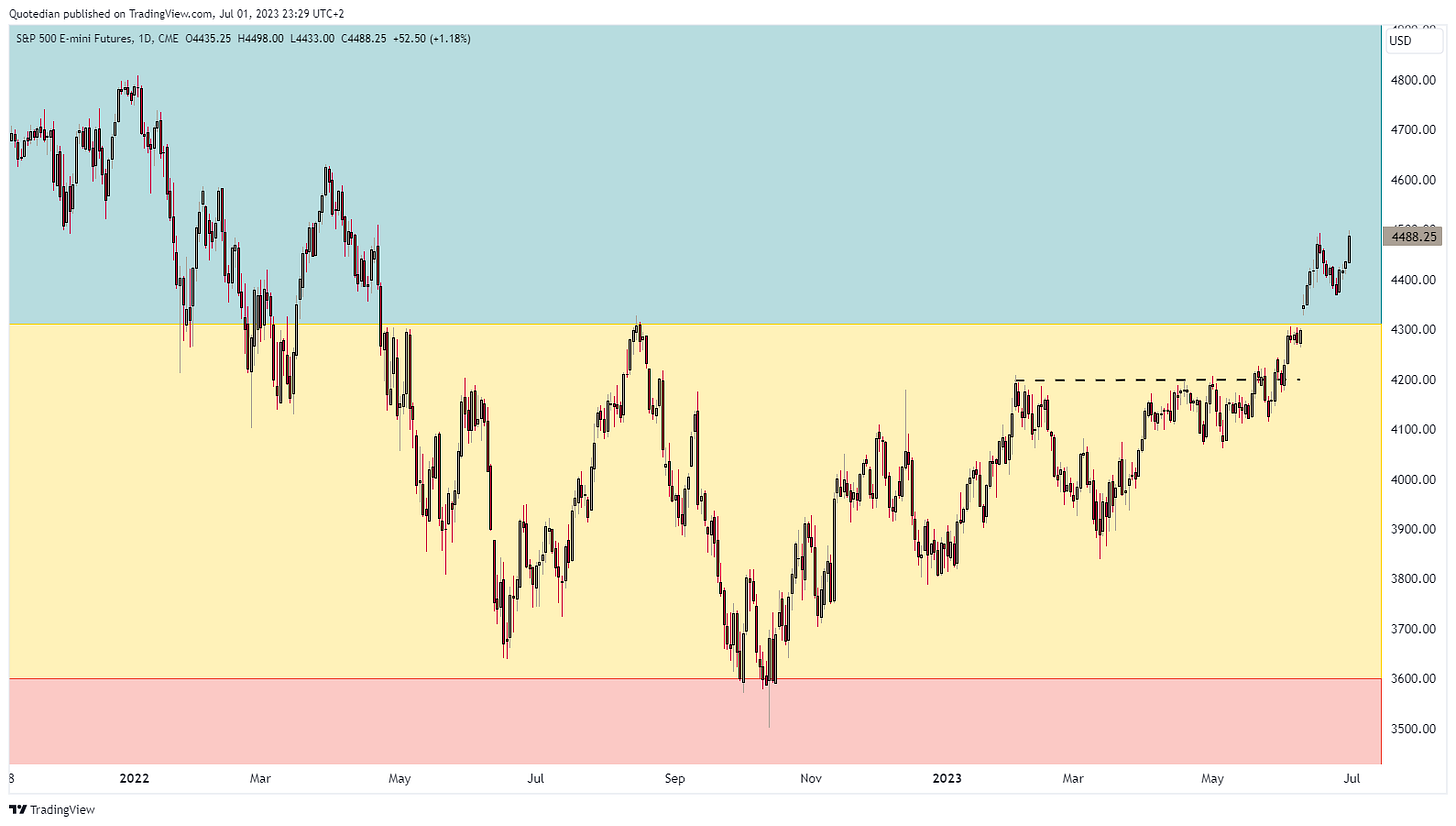
Wall Street strategist for a first time in decades, predicted a small down-year for equity markets. The truth is, for a time I thought they may be too optimistic and the downside may be much larger. But that’s what we have Technical Analysis (TA), aka risk management for:
As the very latest indication of trend change, our secular traffic light jumped to green at the beginning of June. But already two weeks earlier, the cyclical trend turned to “UP” as the January highs were taken out to form a pattern of higher highs and higher lows.
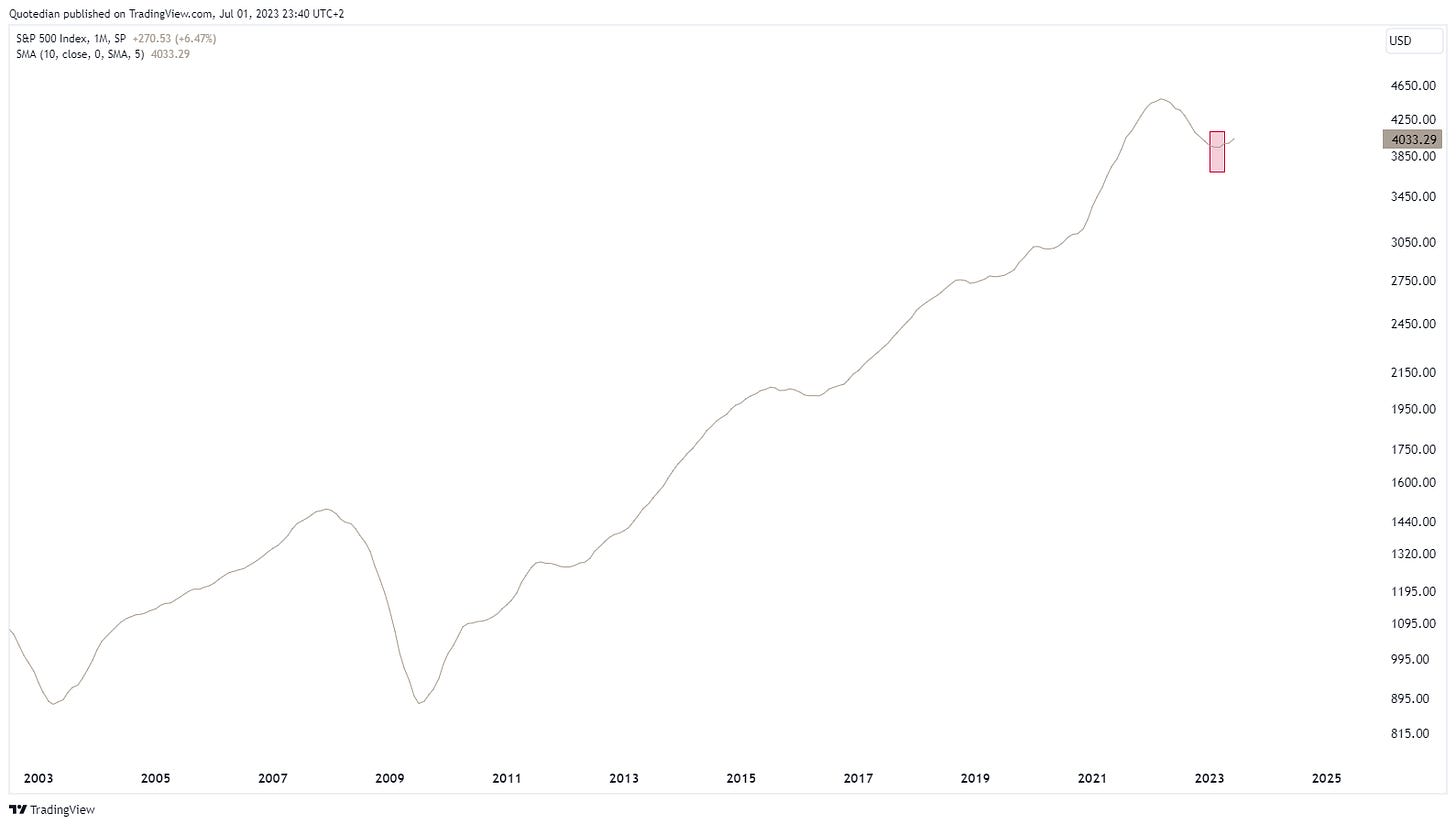
And of course, the earliest confirmation of trend change came as our long-term trend arrow jumped to “UP” at the end of March, followed shortly after by the 10-month moving average (MA) turning up:
Turning to our series of monthly charts, and starting with the S&P 500, that’s a mighty large candle there representing the month just gone by:
The rally continues to be dominated by the usual few suspects (point in case: Apple), but participation is broadening, as the equal-weight S&P 500 shows:
Still, the dominance of the ‘Glorious Seven’ (we count the two share classes of Google as one) is important and not seen anywhere better than in the NASDAQ 100, where those seven stocks make up more than 50% (!!!) of the index weight:
Volatility (VIX) in the meantime has fallen two its lowest since January 2020, i.e. pre-pandemic levels:
Jumping to the other side of the pond, we note the narrow EuroSTOXX 50 index has closed above the December 2021 highs and is closing in on the all-time highs set in 2007:
Here is what has been driving the index higher:
The broader STOXX Europe 600 index (which includes stocks from island countries such as the UK or Switzerland), is lagging somewhat, but also leaves a constructive picture:
In the Far East, the Nikkei is hitting new multi-year highs month after month,
and is closing in on the all-time highs reached in 1989:
Even when measuring the Nikkei in USD, the index is still up over 15% (27% in Yen terms):
Staying in Asia, in India the “Adani-Dip” is barely visible on the chart anymore. Did you buy it?
And finally, the Chinese equity complex (Mainland, HK) are the only major markets which exhibits a negative year-to-date performance. Here’s the CSI300:
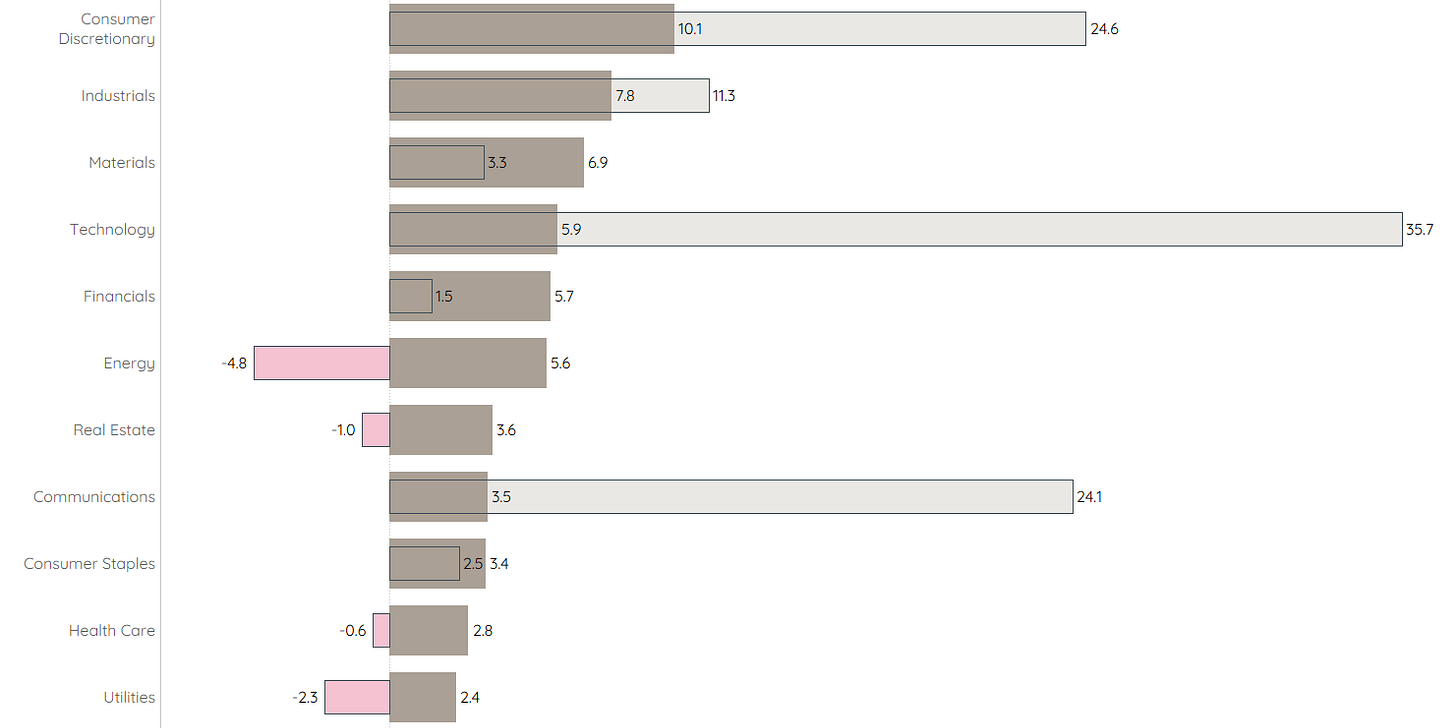
Time to turn to equity sector performance, where the global sector performance looks as follows:
Consumer discretionaries had a double-digit home run during this month just gone by, putting them firmly into second place only behind tech stocks on a year-to-date basis.
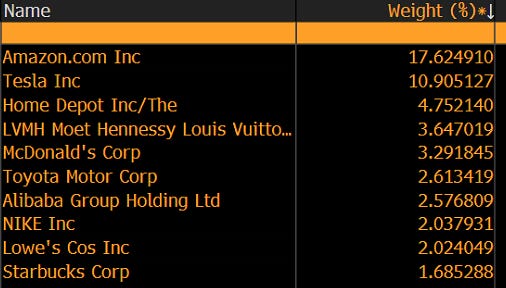
So, what are consumer discretionary stocks? According to the Bloomberg World Consumer Discretionary Index the top 10 constitute the following members:
Indeed, Amazon is recovering from its 50% slump:
And Tesla has been flying high since January:
On the other side of the performance gamma this year are energy stocks, despite a decent June performance. The oil price has been trading in recession mode (about the only asset to do so) for months now, acting as a black hole to energy-related stocks.
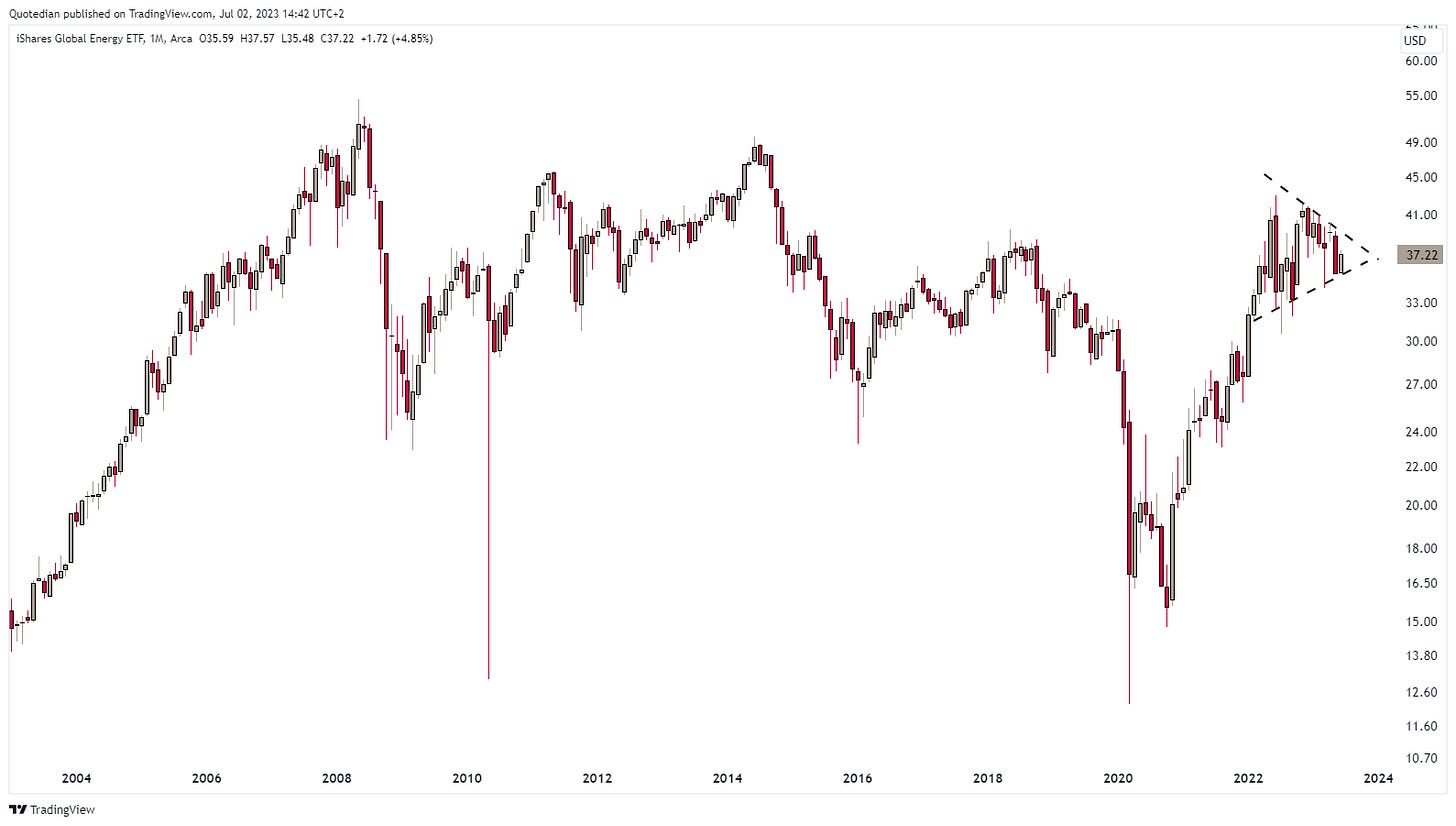
My tree-hugging ESG friends will have to forgive me (or unsubscribe), but buying fossil fuel companies at these levels, seems the closest thing to free lunch you can get. First, here’s the chart of the iShares Global Energy ETF as proxy for the sector:
To me, this looks more like a ‘pause’ rather than a ‘reversal’. And now, let me explain “these levels” to you:
Dividend Yield 5%
P/E 6.7x
Price/Sales <1
I rest my case.
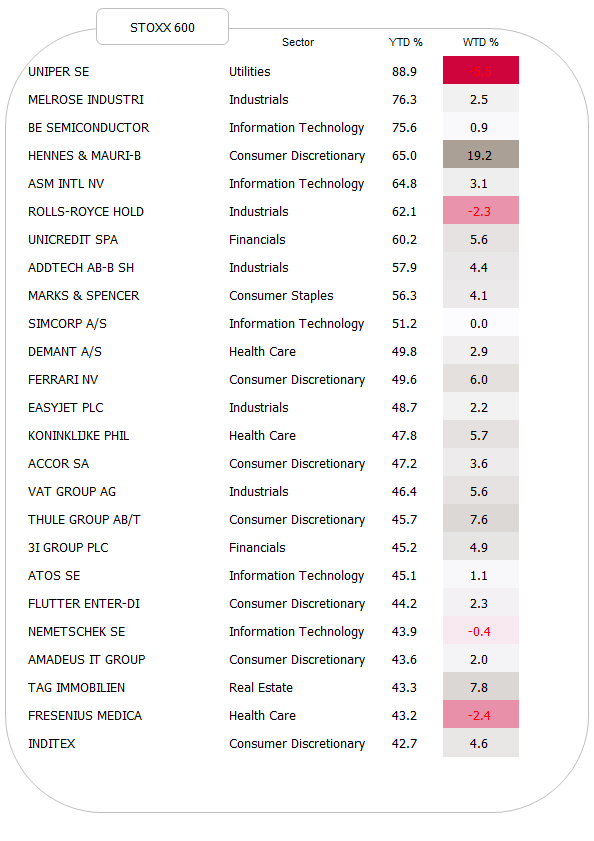
Now to finish the equity section, here are the stats on the best-performing stocks (YTD) on either side of the Atlantic and how they have fared over the five days just gone by.
Starting with European stocks, we note that semiconductor-related companies are dominating:
And in the US, AI stocks NVDA and META are now being joined by travel (cruise) companies Carnival, Royal Caribbean and Norwegian Cruiselines:
Finally finished with the boring equity section, let’s have a look at the exciting fixed-income universe:
A very mixed month for fixed-income investors, with generally speaking, duration underperforming and credit outperforming. Still, not a bad result for all observed benchmark indices to be up on year-to-date total return basis, given that central banks around the world are still in hawkish hiking mode and mood.
Let’s grind some charts.
Here’s the US 10-year Treasury yield as a global benchmark for interest rates:
Indeed, longer-term rates topped out in October of last year. However, unfortunately for bond (price) bulls, this looks rather like a consolidation than a trend reversal. Even more so, if we zoom further out in time:
Two-year yields, the ones closest to the Fed’s monetary policy, are getting the message of additional hikes from Jerome Powell:
This in turn is leading to a further, record inversion of the yield curve:
Let me repeat here once more: As investor, don’t fear the inversion, fear the unwinding of the inversion…
Over in Europe, using the German 10-year Bund as proxy for the economic area, we get a similar ‘consolidation’ impression as in the US:
And again, the longer-term view, confirms this consolidation view:
And here too, it the inversion taking on gargantuan dimensions:
As mentioned at the outset of the fixed-income section and shown in the performance table, have credit spread being contracting lately, pushing total returns on credit-related indices higher:
Last but not least, bond volatility (MOVE) also moving lower. Whilst still far away from the 3-year lows observed in the VIX, the pattern is not dissimilar, albeit on a smaller scale, than during the GFC and could give a signal of yet less bond volatility going forward:
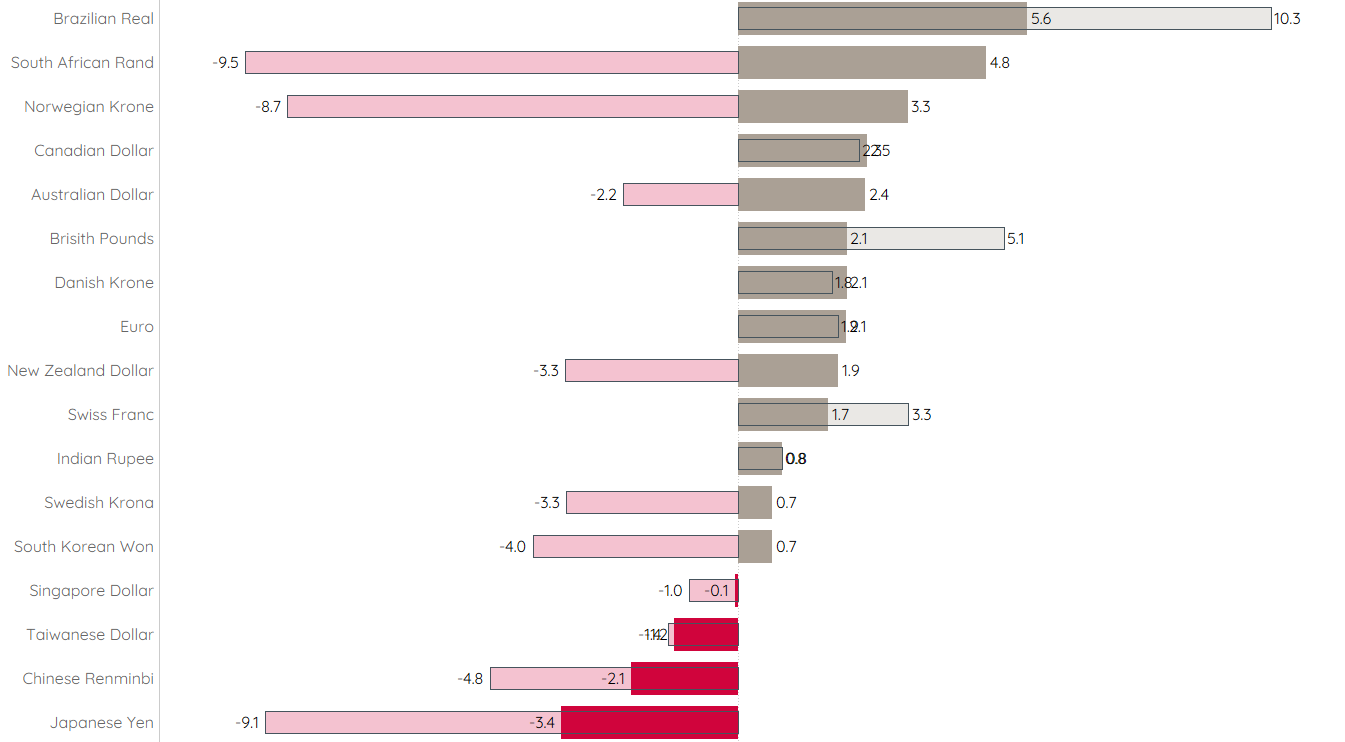
Making good progress, time has come now to look at the currency complex. As usual, first the performance table of global currencies as compare to the US Dollar on a 1-month and year-to-date basis:
Hence, overall, the Greenback has lost some ground versus major other currencies, with the Brazilian Real being the best performer. This particular currency pair remains in minimum 2-year old trading range, but support is currently under BRL-attack:
On the other side of the performance table, the Japanese Yen continues to shed blood, with a breach of the 150 level in plain sight:
However, in the greater scheme of things, maybe we are just looking at a gigantic 30+ year base, with the downtrend for the Yen (uptrend for the USD/JPY cross rate) just beginning…
The EUR/USD is anything but clear for me:
The best I could give here is that the risk levels are above 1.15 and below 1.05.
In the nirvana of hyper-inflation currencies, the Argentina Peso (grey) and the Turkish Lira (red) are racing each other to the bottom:
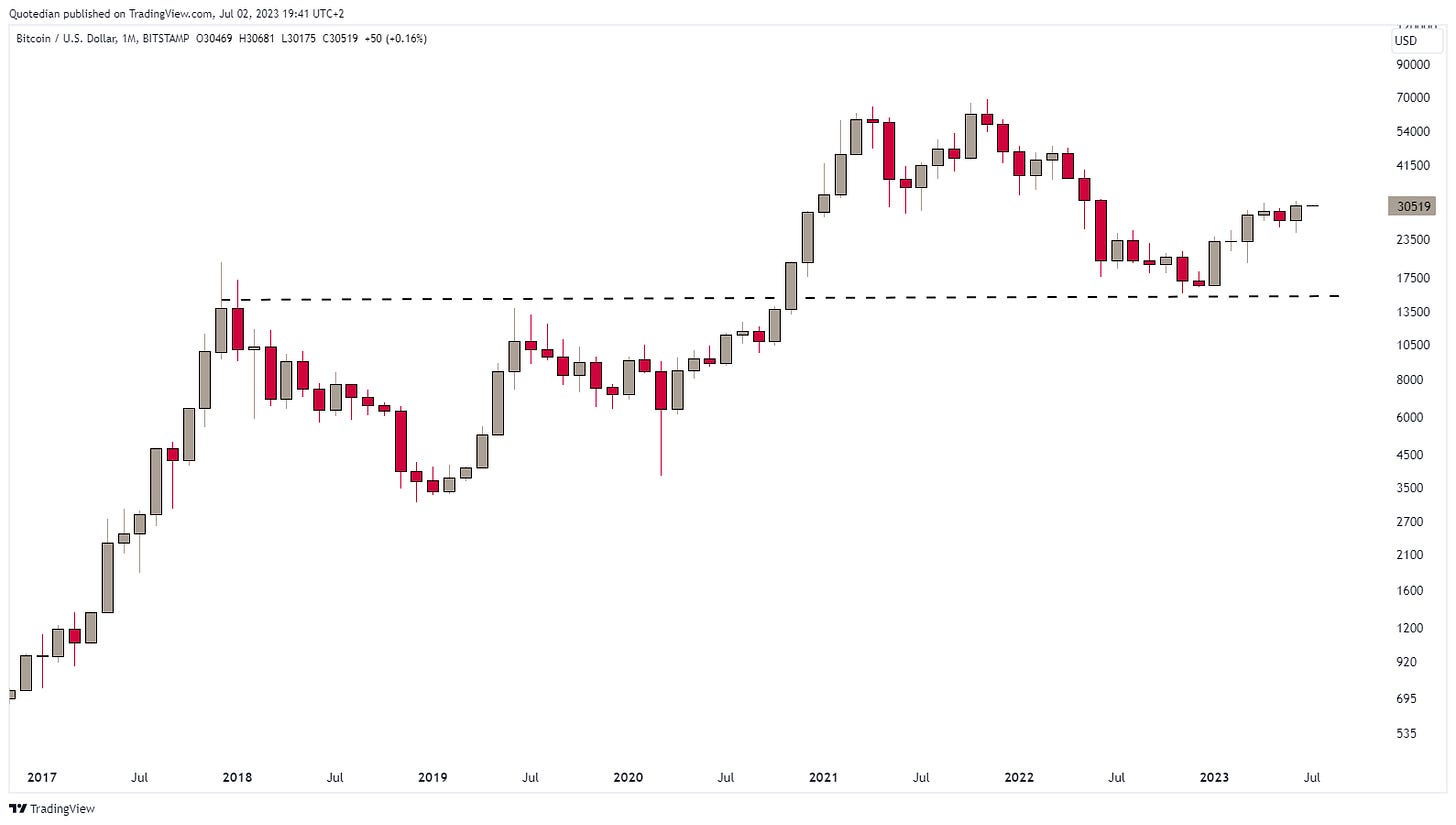
Let’s throw cryptocurrencies also into this section, where most of them are having a very decent year:
Especially Bitcoin had a very good June, closing above the April and May highs, producing a chart that suggests this cryptocurrency still has upside:
So, finally, we have arrived in the commodity space, where the major ‘sectors’ have performed as follows:
Livestock reversed negative performance in one month to such an extent that it boosted itself right to the top of the performance table. Energy commodities have reduced the pain of this year somewhat. Softs and precious metals are the month’s losers.
Going one step more granular, here is how some of the more popular commodity futures have performed over the month and since the beginning of the year:
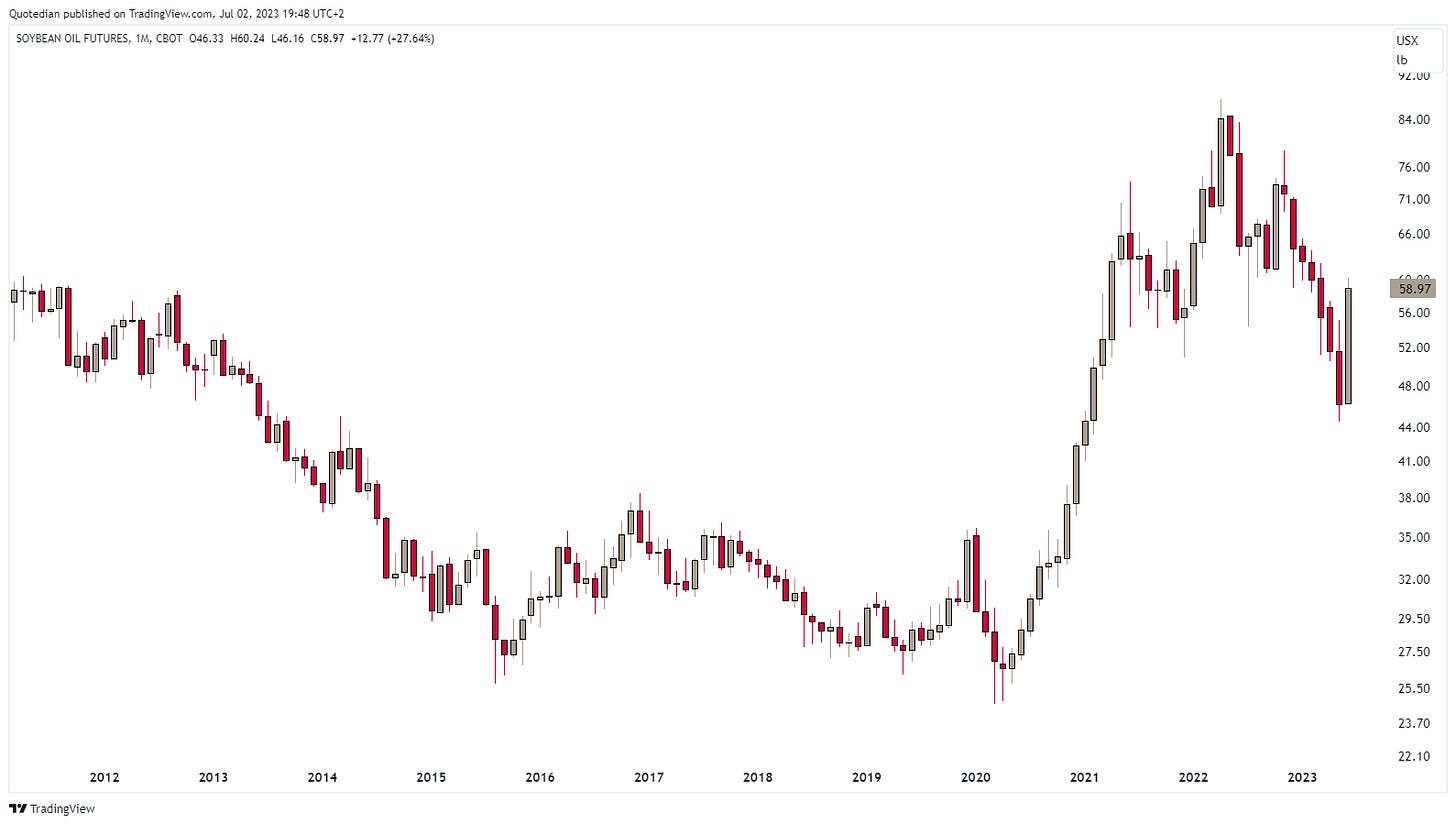
What the heck happened in Soybeans and Soybean oil???? Here’s a monthly chart of the latter:
But turning to some more important commodities, gold continues its consolidation pattern since having reached an all-time high for about 5 seconds in May:
Cleary, rapidly rising real yield (green line, rhs inverted), provoked through rising interest rates AND falling inflation simultaneously, are a major headwind to an advance in the price of gold (blue line, lhs):
Oil had a small positive print this month, but continues to trade dangerously close to key support:
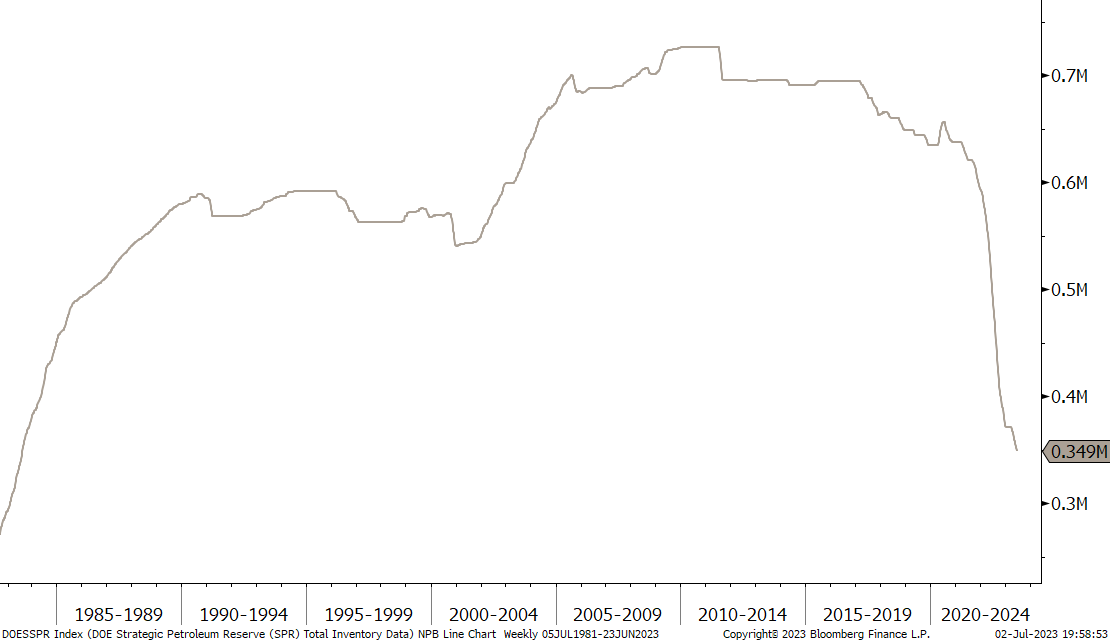
The whole world and its mother is waiting for the US strategic petroleoum reserve to be rebuilt and put a bid under the oil price, but it just ain’t happening (yet):
Well, that’s all folks (as if you wished for more).
Hopefully you found some use to the charts and performance tables, and as usual, do not be shy to leave your market comments or general feedback here:
Have a great start into the week, month, quarter and half year.
André
Thanks for reading The Quotedian! Subscribe for free to receive new posts the moment they are published.
DISCLAIMER
Everything in this document is for educational purposes only (FEPO)
Nothing in this document should be considered investment advice
The views expressed in this document may differ from the views published by Neue Private Bank AG
Past performance is hopefully no indication of future performance


