

Below the Surface
The Quotedian - Vol VI, Issue 39 | Powered by NPB Neue Privat Bank AG


“Many fires burn below the surface.”
— Empedocles
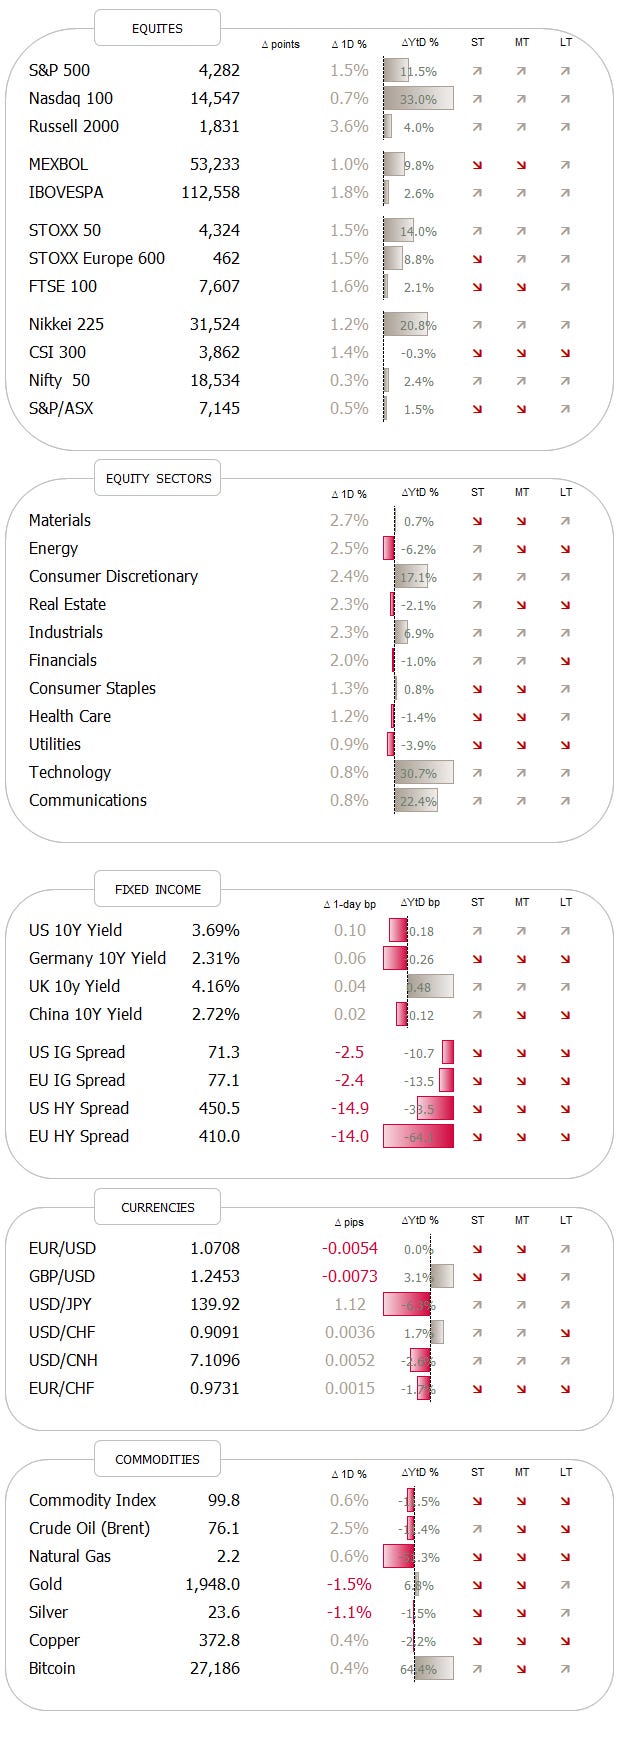
DASHBOARD
CROSS-ASSET DELIBERATIONS
Well, now, that’s arkward! Didn’t we all agree that a global recession is imminent and therefore stocks would correct at least 20% lower?
So, what the heck is the S&P 500 doing breaking above the resistance line at 4,170 in all seriousness last week?

The only ‘hope’ for the few remaining bears is the resistance at 4,300 (dotted line) now - a break above that and all clear for new all-time highs (ATH).
But is really all just up, up and away?

Having just reviewed the month of May in The Quotedian two days ago we will stray away from the usual format of statistical reviewing the week just gone by, but will rather try and have a look at what’s going on below the surface and what’s working and what not.
In that process we will also look at a bunch of individual stocks, but remember, we are not giving any investment advice whatsoever here. In that context, scroll down to the end of this document and re-read our simple, but effective disclaimer (and hit the like button as you are down there already anyway).
HOWEVER, if you happen to look for some solid investment advice, consider these guys here:
The good old Quotedian, now powered by Neue Privat Bank AG

NPB Neue Privat Bank AG provides its clients with solid, top-notch and especially applicable investment advice, be it in overall asset allocation or stock-, bond- and fund-picking.
Contact them today to find out more: info@npb-bank.ch
So, we already established that the S&P 500 is breaking higher and as pure trend-followers we should be happpy about that.
However, even a only a quick glance at the year-to-date performance heatmap reveals how narrow this rally really is, or in other words, how few stocks participate to the 12% year-to-date gain for the index:

Hence, the year-to-date performance spread between the ‘normal’ S&P 500 (grey line) and its equal-weight version (red line) continues to be in excess of one thousand basis points:

So, we already established that the market is pulled higher by a few, select heavy-weight lifters:

Those can largely be defined as the 10 members of the NYSE FANG+ index (right column are YTD returns):

But let’s have a look at some of those stocks which have not worked over the past few months (and therefore maybe offer opportunity if you remain in the bullish camp).
A good place to start looking for those is probably the graph of (global) sector year-to-date performances:

Real estate is probably save to ignore for now, or at least as long as central banks remain in tightening mode and mood. But energy, health care, financials and materials for sure should give us some interesting names.
Starting with Energy stocks and using the iShares Global Energy ETF (IXC) as our universe (P/E 9x; Div yield 4.6%), the overall performance actually does not look too bad, with the ETF about flat over the past twelve months:

But looking at the performances of the individual members of this ETF, we find some big losers.
One of my all-time favourite enregy stocks, refiner Valero (VLO), seems to be at ‘buyable’ levels:

Another favourite of mine from portfolios gone by is Norwegian oil and gas exploration company Aker BP:

Down some 40% since its top exactly a year ago it offers a 9% dividend yield at an PE of 6.2x (FY23). What’s not to like?
But not all energy stocks have been losers over the recent past. Petrobras (PBR) for example is up over 30% in its US ADR version since the beginning of the year and is about to break above the $12.50 resistance zone:

Even if it does not break higher, you are still paid a handsome 12% pa yield every quarter!
And finally, another long-time energ favourite of mine, is nuclear powerplant builder Cameco:

Admittedly no dividend to be had hear and valuation is not exactly cheap, but given its monopole positioning in an energy sector (nuclear) that to me is the solution to many issues treehuggers highlight regarding fossil fuels, I think there should be plenty more upside.
And, of course, there was also this last week:

That can only help.
Ok, enough energy, let’s have a look at healthcare stocks, which have not been the investors’ top focus either recently.
Again, we’ll use one of those useful iShares Global Sector ETFs (IXJ in this case), as base of our observable universe. And again, the ETF as a whole is roughtly flat over the past 12 months:

Let’s go and look for some gems below the surface once again.

One stock that is actually up a lot already, but continues to look promosing is Eli Lilly. I agree it is a bit difficult to buy on the long-term chart,

but the truth is that on a shorter, daily chart it seems poised to break to new ATH over the coming sessions:

But let’s look who’s lurking at the bottom of the pond… Pharma behemot Pfizer (PFE) for example has fallen from COVID-grace and is to be had at a PE below 7 with a dividend yield above 4%:

Not too shabby.
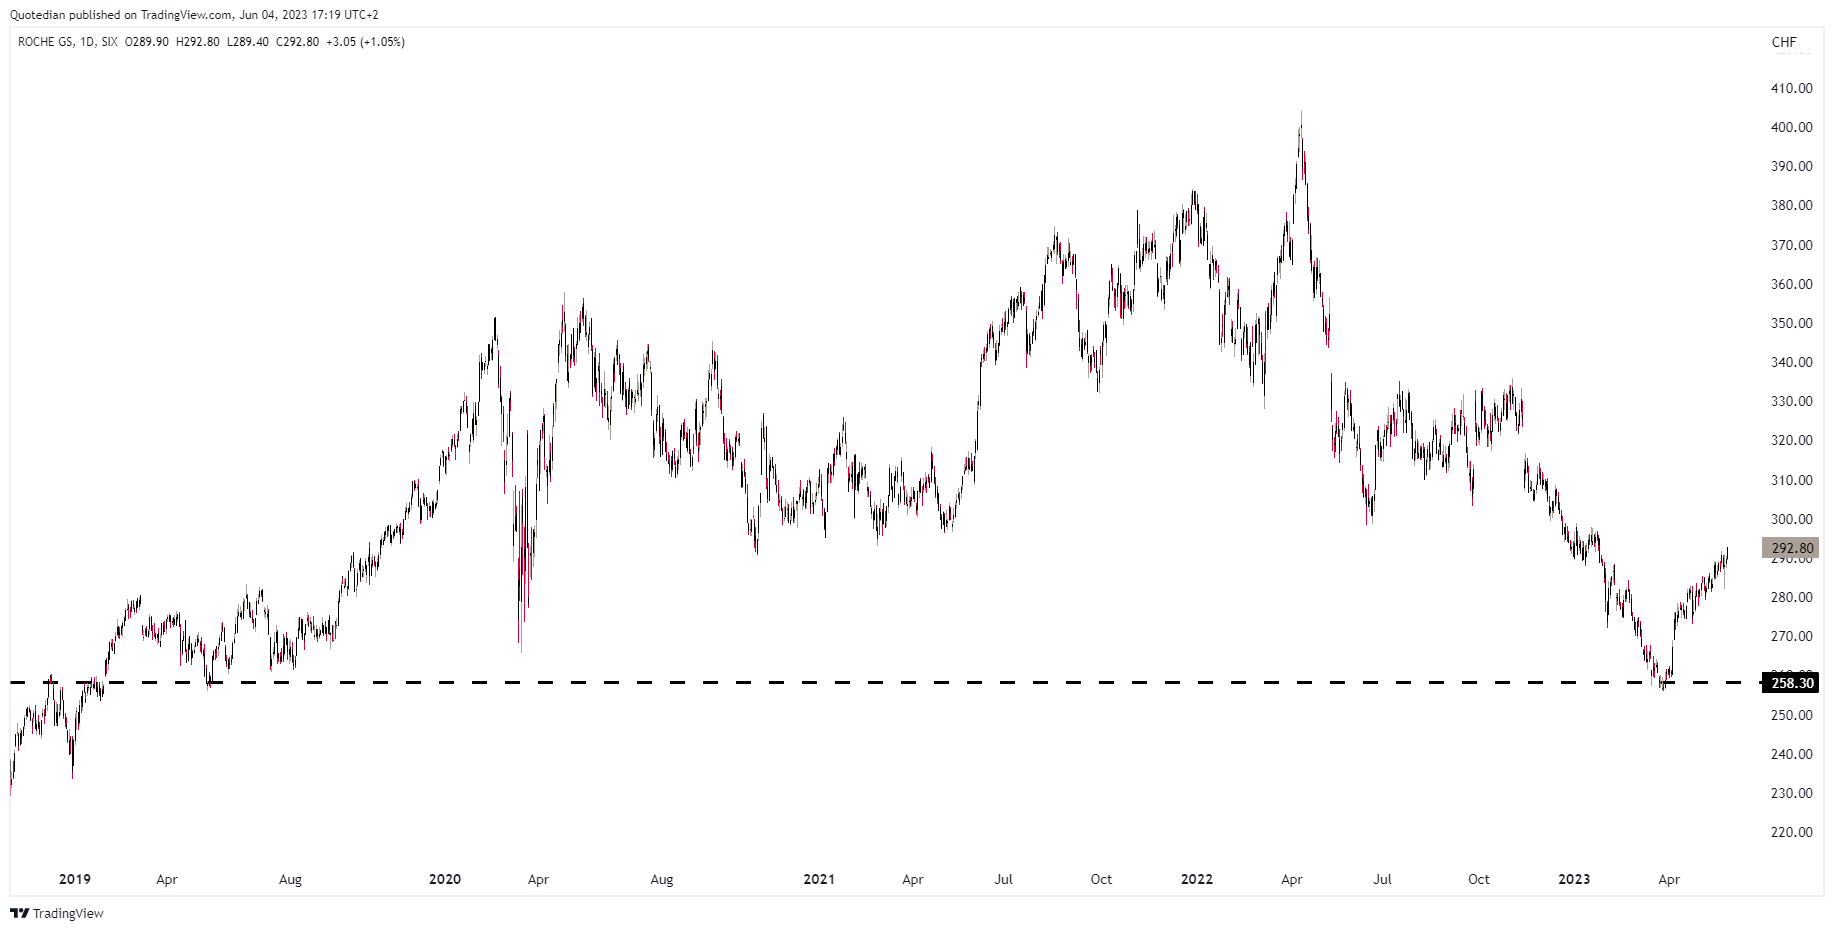
Or consider Swiss Pharma giant Roche, which finally is rebounding from long-term support:
Or Danahar (DHR), which in the past could not do anything wrong to upset investors, is suddently to be had at a 30% discount to recent highs:

The short-term chart looks intriguing, but conservative investors should maybe wait for $245 to break to the upside before committing:

Here is a potpurri of some random charts which caught my attention over the past few days.
Swiss watchmaker Swatch for example is for no apparent reason (at least to me) down over 20% from its recent top, putting in offically into a bear market:

Or booze-maker Remy-Cointreau got dizzy, down over 35% from the 2022 highs:

Which is not the experience its two closest competitors, LVMH (red) and Pernod Ricard (blue) had over the same time frame:

BTW, why are all alcohol producers French?

Anyway, I got a bit carried away in this Quotedian, so let’s stop the stocks side and just have a look at some charts in the other key asset classes before hitting the send button.
Yields jumped on Friday, on yet another solid NFP number. Here’s the US 10-year yield chart:

This is of course at odds with the equity rally also seen on Friday, but hey, correlations apparently come and go.
The US Dollar agreed with bonds on Friday and headed higher, but 104.30 needs to be cleared on the Dollar Index chart (DXY) for the uptrend to officially resume:

And finally, in the commodity space the probably most important thing did not occur last week, but rather over the weekend, as OPEC+ agreed to extend output cuts. I expect two things from this: 1) some upside pressure on oil prices as futures trading opens in a few hours and 2) the OPEC to continue to weaponize the oil price over the months and years to come - especially as we get closer to the US presidential elections next year. Be long and have a look at some of those oil names further up again.
Here’s the price of oil (WTI) as per Friday:

Dragged down by (apparently) recession fears, which in my book makes no sense with equities breaking higher, I would be buyer of oil and oil stocks (see above) on any pullback over the coming weeks to months. Triple digit oil price are likely to become the norm over the coming decade.
Ok, definetily it is now quarter-past-chablis and high-time to hit the send button.
As said at the outset of this letter, today’s format was slightly different as we just did a major cross-asset review two days ago. Did this work for you today?
And finally, PLEASE DO HIT THE LIKE BUTTON BELOW.
It helps a lot to grow our community and as you know, the more, the merrier!!
CHART OF THE DAY
This tweet from Clocktower Group’s Macro Papic are four lines of brutal truth.

Thanks for reading The Quotedian! Subscribe for free to receive new posts the moment they are published.
DISCLAIMER
Everything in this document is for educational purposes only (FEPO)
Nothing in this document should be considered investment advice
The views expressed in this document may differ from the views published by Neue Private Bank AG
Past performance is hopefully no indication of future performance