Broadening
Vol VII, Issue 33 | Powered by NPB Neue Privat Bank AG
"Opportunities come infrequently. When it rains gold, put out the bucket, not the thimble."
— Warren Buffet
This week’s letter will be shorter than usual, as it absolutely has to be finished today Sunday (22/9) as tomorrow Monday I am attending an Alternative Investments Colloquium most of the day. So, we have about one football game in the background (Villareal-Barcelona) to look at the most important charts. This means we have to take out a big censorship scissor to cut out a lot of content, as a lot of things have been going on in financial markets over the past few sessions.
Let’s hope right down the rabbit hole then …
Of course, the massive (yes, tongue in cheek) fifty basis point cut by the FOMC was the main topic of the week and likely also the excuse to push the S&P 500 to a new all-time high and hence above our upper line in the sand highlighted in last week’s Q (click here):
But, also as discussed in the previous edition of this fine newsletter, we of course already had a suspicion this would happen, as a) the Papa Dow (DJ Industrial index) had already achieved that feat,
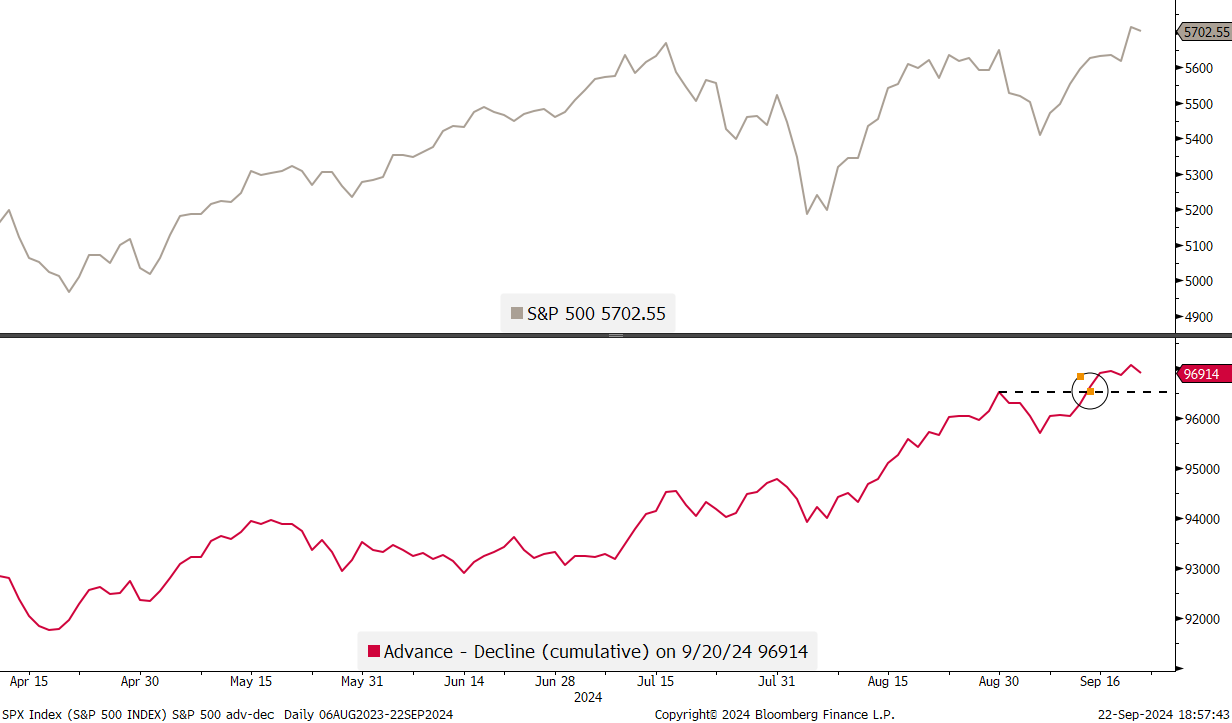
and b) the S&P 500’s cumulative advance-decline ratio also had, hhmm, well, advanced to new highs:
As Jason Goepfert of Sentimentrader.com noted on Twitter X, the 1.7% opening gap on the SPY (SPDR S&P 500 ETF Trust) on Friday was the 2nd-largest in the ETF’s history. The only larger gap was on November 9, 2020 after the release of data showing the Covid vaccine was effective. FWIW, that day highlighted by the pointing hand below:
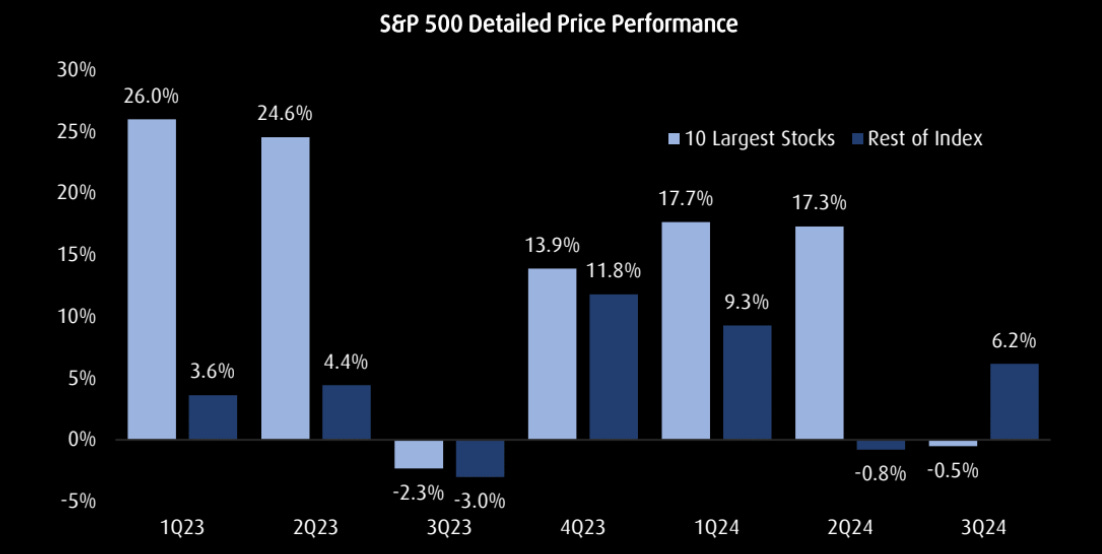
But maybe more importantly, and as we discussed in our Q3 outlook, the broadening out of the stock market rally is a reality. Last week mid-cap sized stocks (S&P 400, middle clip) joined the large caps (S&P 500, top clip) by reaching a new ATH, and small-cap stocks (S&P 600, bottom clip) are less than two percent away from achieving the same:
And here’s yet another way to show that broadening, with the S&P 500 ex-ten largest stocks on pace for first quarterly outperformance in nearly two years:
Over in Europe, the STOXX 600 is still not quite ready to breach that upper line in the sand:
The two largest stock markets in the Eurozone continue to tick at different velocities. Here is Germany’s DAX first, which closed at a new ATH on Thursday before correcting on Friday:
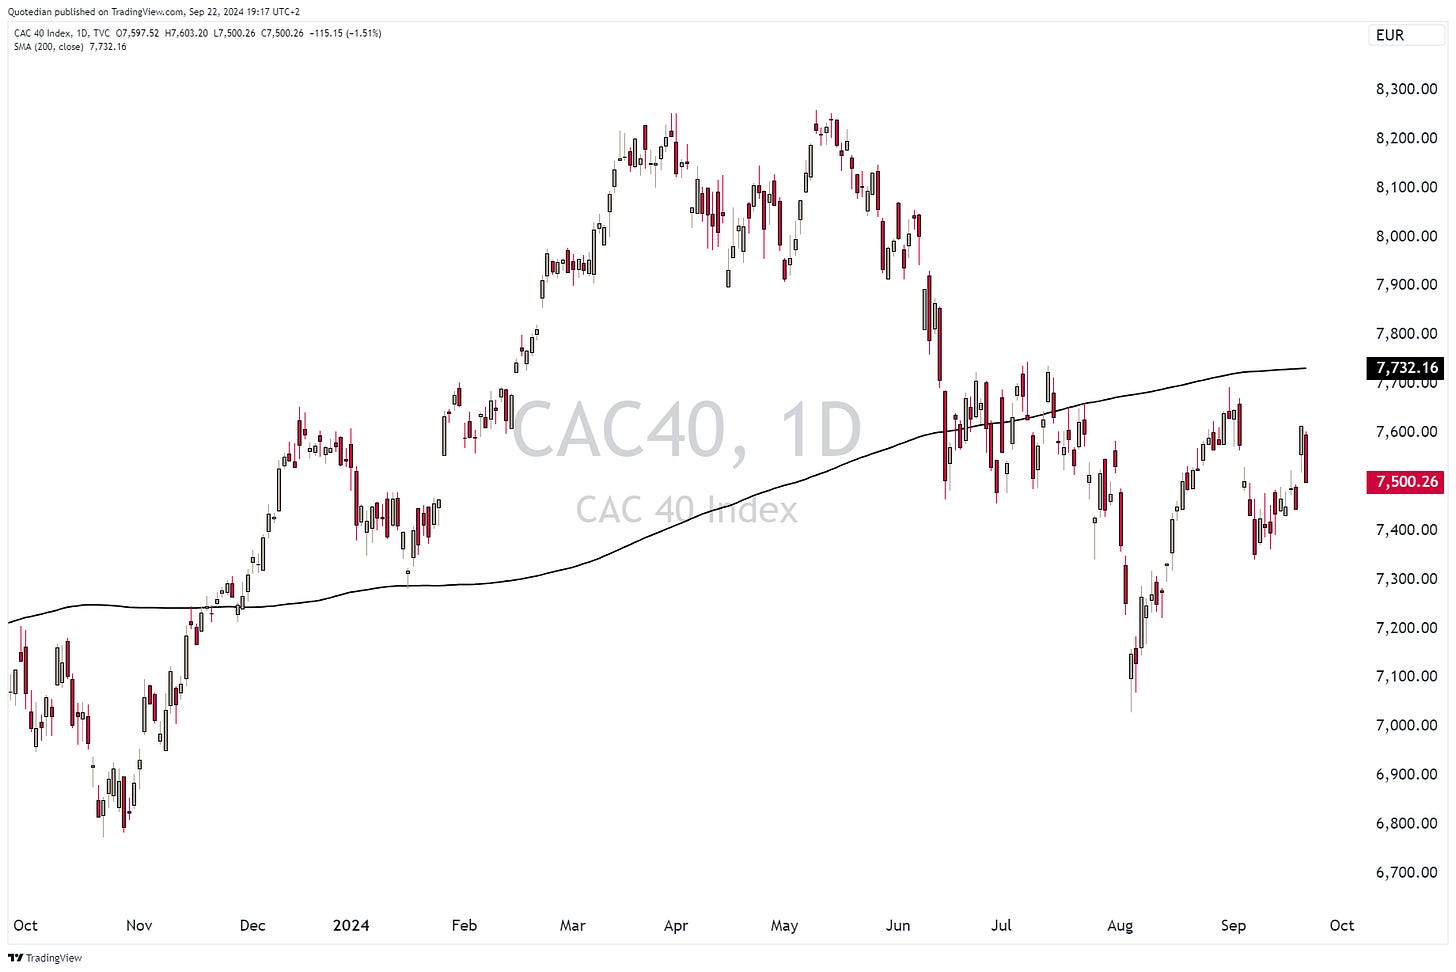
At the same time, France’s CAC-40 seems unable to lift its head out of the post-election slump:
Outside the EZ, Switzerland’s SMI has also been a relative underperformer:
And the UK’s Footsie has been treading water for over four months now:
However, it is noteworthy that when running our proprietary stock picking model based on valuation and price momentum on the STOXX 600 the top is ‘plagued’ by UK companies:
Over in Asia, the Nikkei managed on Friday just about to close above its 200-day moving average for the first time since the August “carry trade unwind” slump:
Hong Kong’s Hang Seng Index is finally showing some life again. Tradable rally?
For some strange reason, I actually think the answer may be yes to the previous question.
Maybe ditto for Chinese Mainland stocks, where the “Japanification” of China, an argument we also believe, has become a bit too main stream over the past few days, which in good old contrarian manner could lead to a tradable rally:
Don’t trade that market without a hard stop loss in place!
And then there is the Indian stock market:
Why bother with anything else, really?
And last but not least, going forward we will also have a look at selected MENA (Middle East North Africa) markets, as this region has become strategically important to NPB Neue Privat Bank - especially since opening our office in Dubai (DIFC) earlier this year (click here). And let’s start this new region by reviewing the UAE market itself via the Dubai Financial Market General Index (DFMGI), which is made up of 35 stocks in 9 groups and was launched in January 2004 with a value index of 1000. Here’s the daily chart:
Clearly in an uptrend, the DFMGI (grey) is outperforming European stocks (SXXP, blue) for example, but underperforming the S&P 500 (red) - all in local currency terms:
Zooming out on the DFMGI, we note that the index may still be in the early innings of a secular bull market:
Here are the 35 index members with their respective weightings:
Ok, it is time to rush along as the football game is seemingly coming to an (happy) end …
Here is our usual weekly look at the best-performing stocks on a year-to-date basis in Europe and the US and how they have behaved over the past five sessions.
Let’s start with Europe:
Most stocks have continued to do well during last week’s rally and that is what we would expect. Exceptions are Zealand and three defence stocks (Kongsberg, Rheinmetall and Dark Trace), which are in retreat for a second consecutive week. Does not really fit the latest geopolitical newsflow, does it?
Now over the top US performers:
Most attention calling here are the massive weekly moves in stocks ranked #1 and #3 … two utility stocks. Nearly all of these gains came on Friday, after this headline hit the newswire:
Here’s a quick explanation:
Constellation Energy (CEG), the owner of the shuttered Three Mile Island nuclear plant in Pennsylvania will invest $1.6 billion to revive it, agreeing to sell all the output to Microsoft Corp. as the tech titan seeks carbon-free electricity for data centers to power the artificial intelligence boom.
Given the USD15 billion increase in market cap on Friday, that $1.6 billion seems financed already …
We normally do not talk a lot of individual stocks and corporate news here, but here’s another headline that caught my attention late Friday evening:
Definitely there have been more expensive times do consider such a deal, as Intel (INTC) trades at the post internet bubble burst levels:
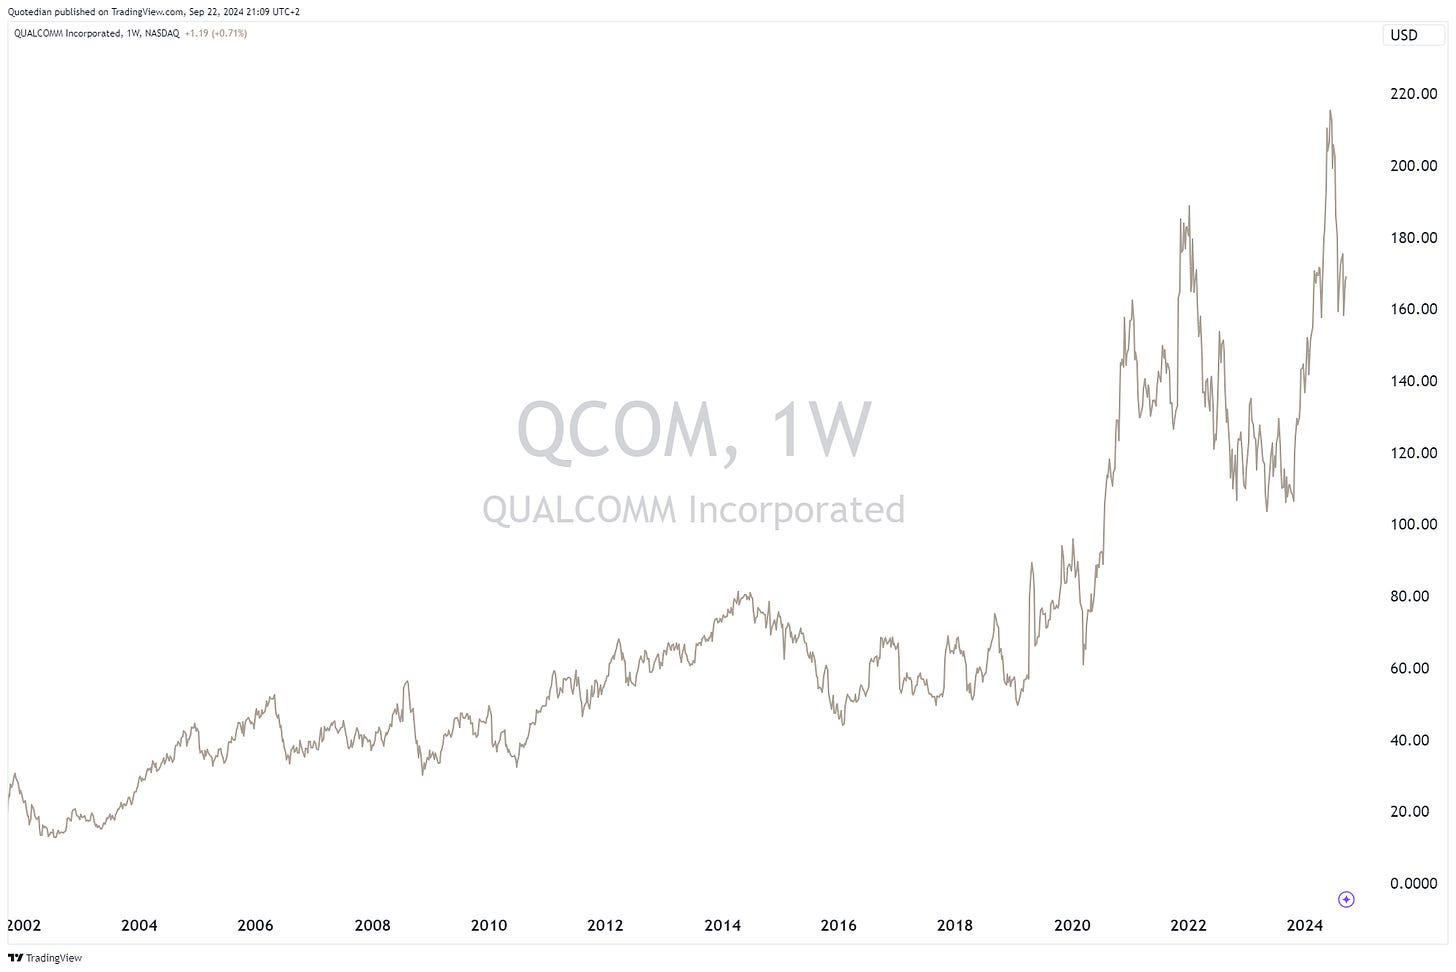
Over the same time frame, the fortunes for Qualcomm (QCOM) have been quite different:
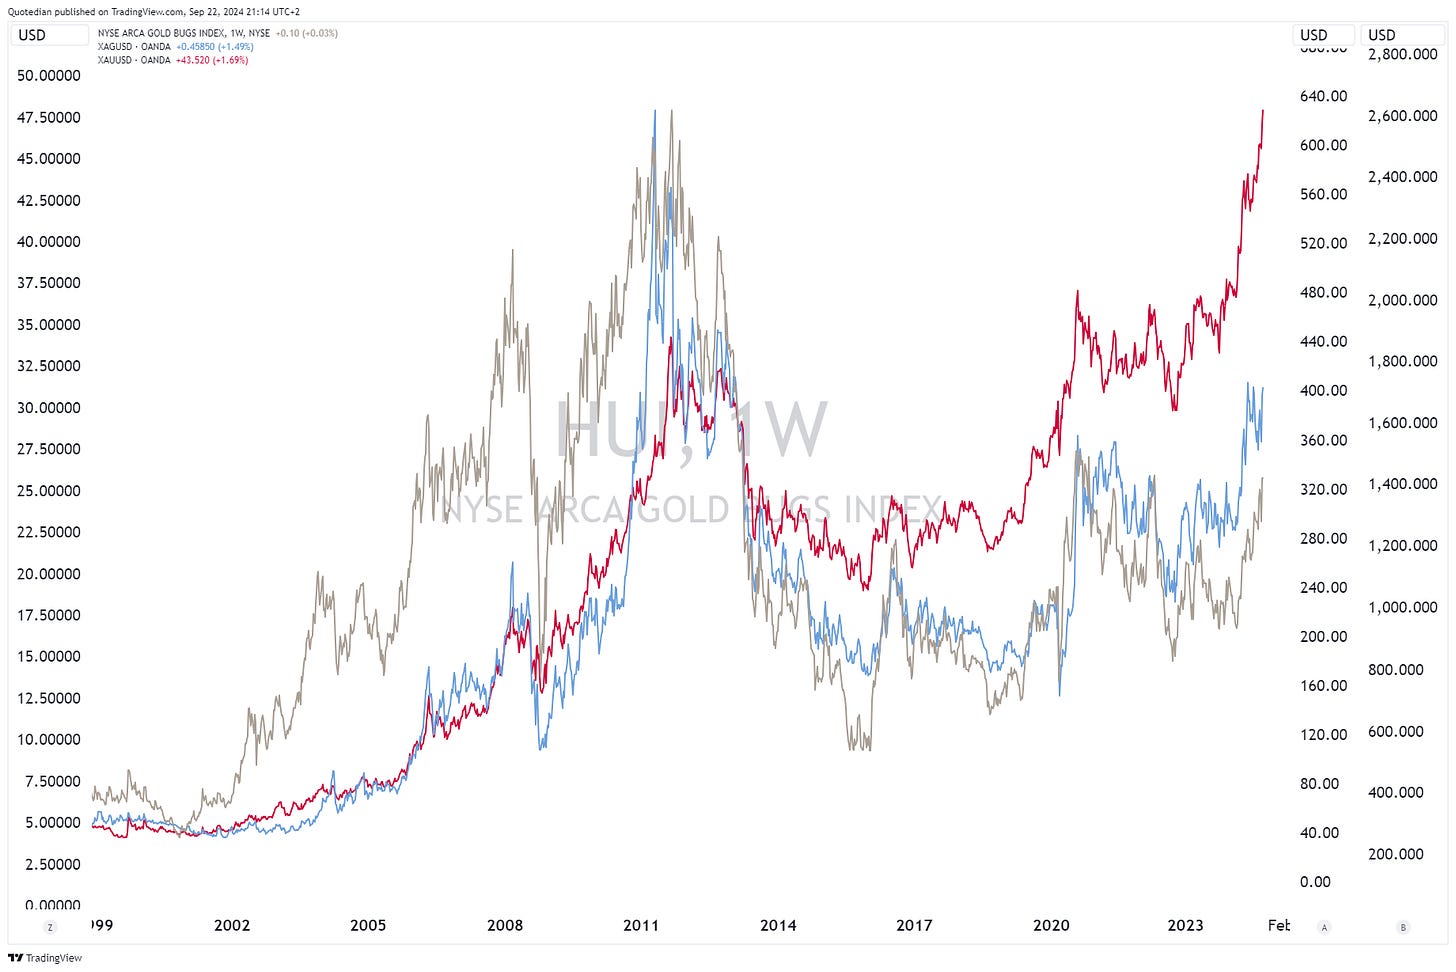
Now, before we rush quickly through the other asset classes, let me commits some chart crime first. Here’s the comparison chart (using different y-axis) of Gold (red), Silver (blue) and the NYSE Gold BUGS index (grey):
I think there is still enough upside in grey to participate …
Ok, now we need to really accelerate, as the game is already in overtime …
US yields did a “weaker on rumour, strong on fact” and started to rise from multi-months lows after the Fed confirmed the 50 bp cut. Here’s the US 10-year treasury yield:
However, and as could be expected, this move did not happen at the short-end (2y) of the curve:
This has subsequently led to a further steepening of the curve (10y-2y):
In the UK, the Bank of England (BoE) decided not to start the cutting cycle quite yet. As a result, the whole yield curve shifted higher (green is now, brown a week ago):
On Friday, the Bank of Japan (BoJ) also decided to leave their current monetary stance unchanged, with no immediate impact on yields.
Last but not least, the Swiss National Bank (SNB) is due to announce their key interest rate next Thursday, in what is the current’s President of the SNB last meeting. The market is currently expecting a 25 bp cut,
but rumours have it that a 50 bp cut could be announced in order to soften the too strong CHF … which we use as a perfect segue into the currency section!
As we were talking Swiss Francs, let’s start there. Here’s the very long-term chart of the USD/CHF, showing that the Swissy is too strong again:
Zooming in we see that battle going on just above the 0.8400 level:
The EUR/USD seems to have started its next leg upwards:
And against all odds, the British pound is propelling higher (leading the way for the Euro?):
So, all-in-all, it seems that the all important support at 100.50 on the Dollar Index will give:
Dollar weakness ahead.
Gold shot higher again after the FOMC cut. The yellow metal has the (positive) perfect storm, with high demand coupled with an anyway weaker USD:
What if gold, after a 13 years consolidation period (sometimes aka bear market), has just now started its next secular up trend?
Ok, enough for today.
Time to hit the send button, but just in case you were wondering:
Have a great start to the week!
André
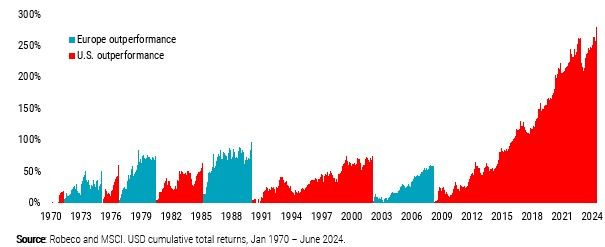
Massive important chart here from the fine Quant folks at Robeco. It shows periods of European and US outperformances to each others, with the massive run US stocks had since the GFC in comparison to their European cousins.
Consider this: the US has 4% of the global population and accounts for 24% of global GDP. Now, put that into comparison to the 74% (!) weight the US equity market has in the MSCI World. Then, think of the European valuation (PE 16x) versus US valuation (PE 27x). Finally, think back to the FX section where we noted the US Dollar is on the verge of losing key support.
Makes you think, eh?
This will be one of our major themes in the next quarterly investment outlook, due in about two weeks.
Stay tuned, as they say …
Everything in this document is for educational purposes only (FEPO)
Nothing in this document should be considered investment advice
Investing real money can be costly; don’t do stupid shit
The views expressed in this document may differ from the views published by Neue Private Bank AG
Past performance is hopefully no indication of future performance


