What, Me Worry?
Vol VII, Issue 32 | Powered by NPB Neue Privat Bank AG
“Fool me once, shame on you. Fool me twice, prepare to die”
— Klingon Proverb
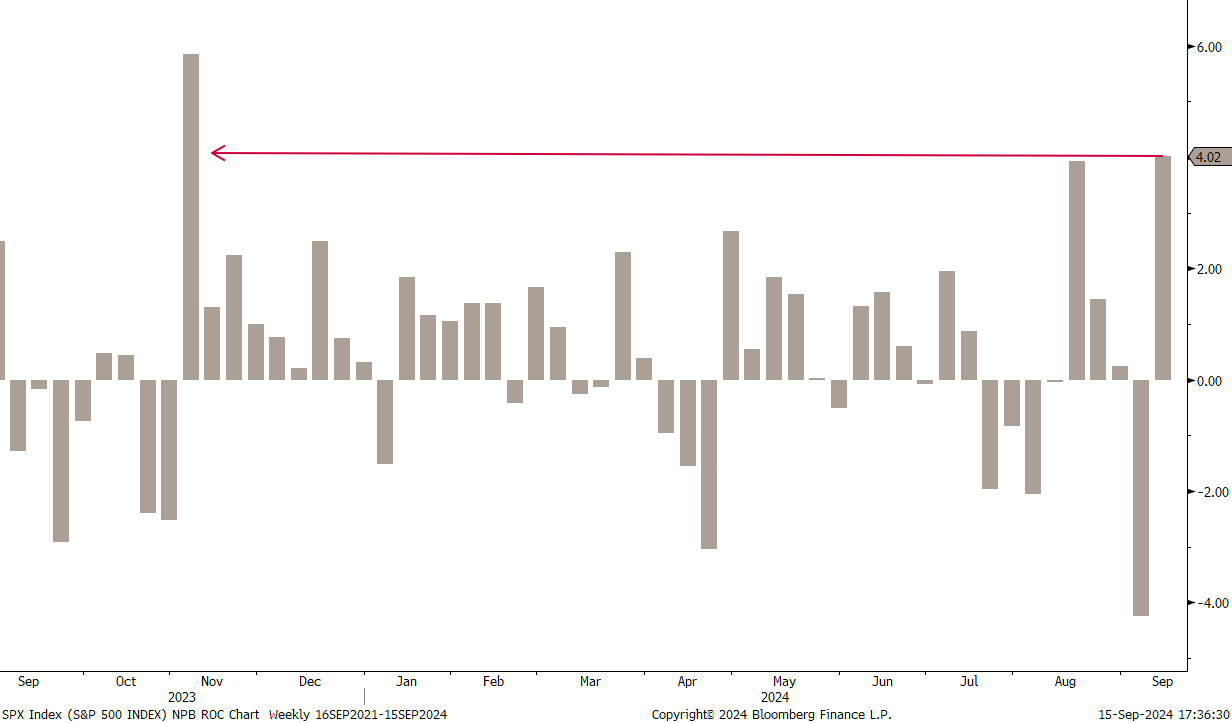
Well, well. After that lousy start to August, with Japanese stocks giving back more than 12% in a single session pulling down along world equity markets, only to put in one of the fastest recoveries ever, we got a repeat of that over the past two weeks. The S&P 500, as a popular example, dropped over four percent in the first week of September, only to recover all of it in the best week yet for the index since November of last year:
Hence, if you decided to panic during the first September week or simply forgot to buy into the dip, I guess it is quite ok if you feel the anger of a Klingon today…
So, what’s in store now? Should we worry? Or should we be like Alfred E. Neumann?
Continue to read and then contact us (ahuwiler@npb-bank.ch) to find out!
Let’s dive right in to find out what could be in store for the coming weeks …
As (equity) markets tanked in the first week of August, many market observers, including us, were quick to highlight a possible double top on the S&P 500, coupled with a negative divergence to the Nasdaq 100, which had failed to reach the previous highs post the August sell-off. However, with the super-fast recovery of stock prices, the new question is now whether the market is in for a triple top:
On one hand side, stock market seasonality would dictate that a triple top and a retest of the lower line in the sand at 5,150 (lower dashed line in chart above) is very likely. As a reminder, we should the following graph last week (click here), highlighting that after the sell-off in week 36 (check), we should get a rebound in week 37 just gone by (check):
Hence, according to this, we are now in for the worst four-week period (weeks 38 through 41) of the year for stocks.
On the other hand, sentiment is surprisingly benign already, normally a fertile ground for further equity gains.
For example, the University of Michigan Survey of consumers and their view on the current economic conditions is one of the bleakest on record, outside the pandemic glut and the 1980 recession, considered the most severe since WWII:
Or the CNN Greed & Fear indicator, which is ‘only’ in Neutral territory, despite last week being the best in equity returns for nearly a year:
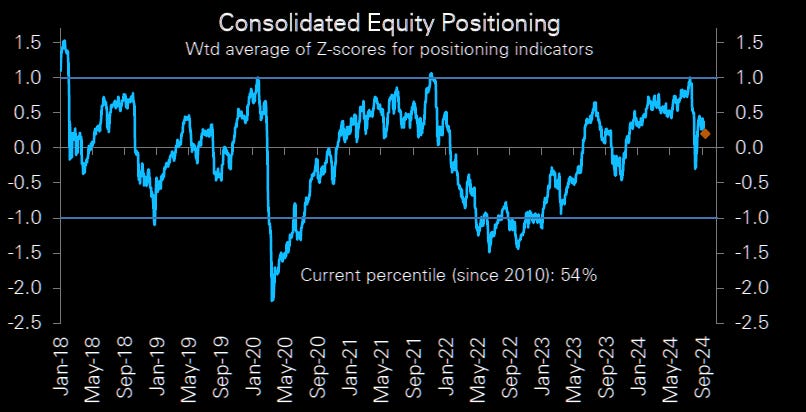
Or take Deutsche Bank’s positioning model, which shows that equity positioning is close to neutral and has been declining:
But, let’s not speculate or front-run, but rather listen to trees in the forest (aka charts). After all, most of the time, WYSIWYG (big hint on a future project here) …
Quickly back to the S&P 500, which has pretty clear lines (dashed) in the sand at 5,670 and 5,150:
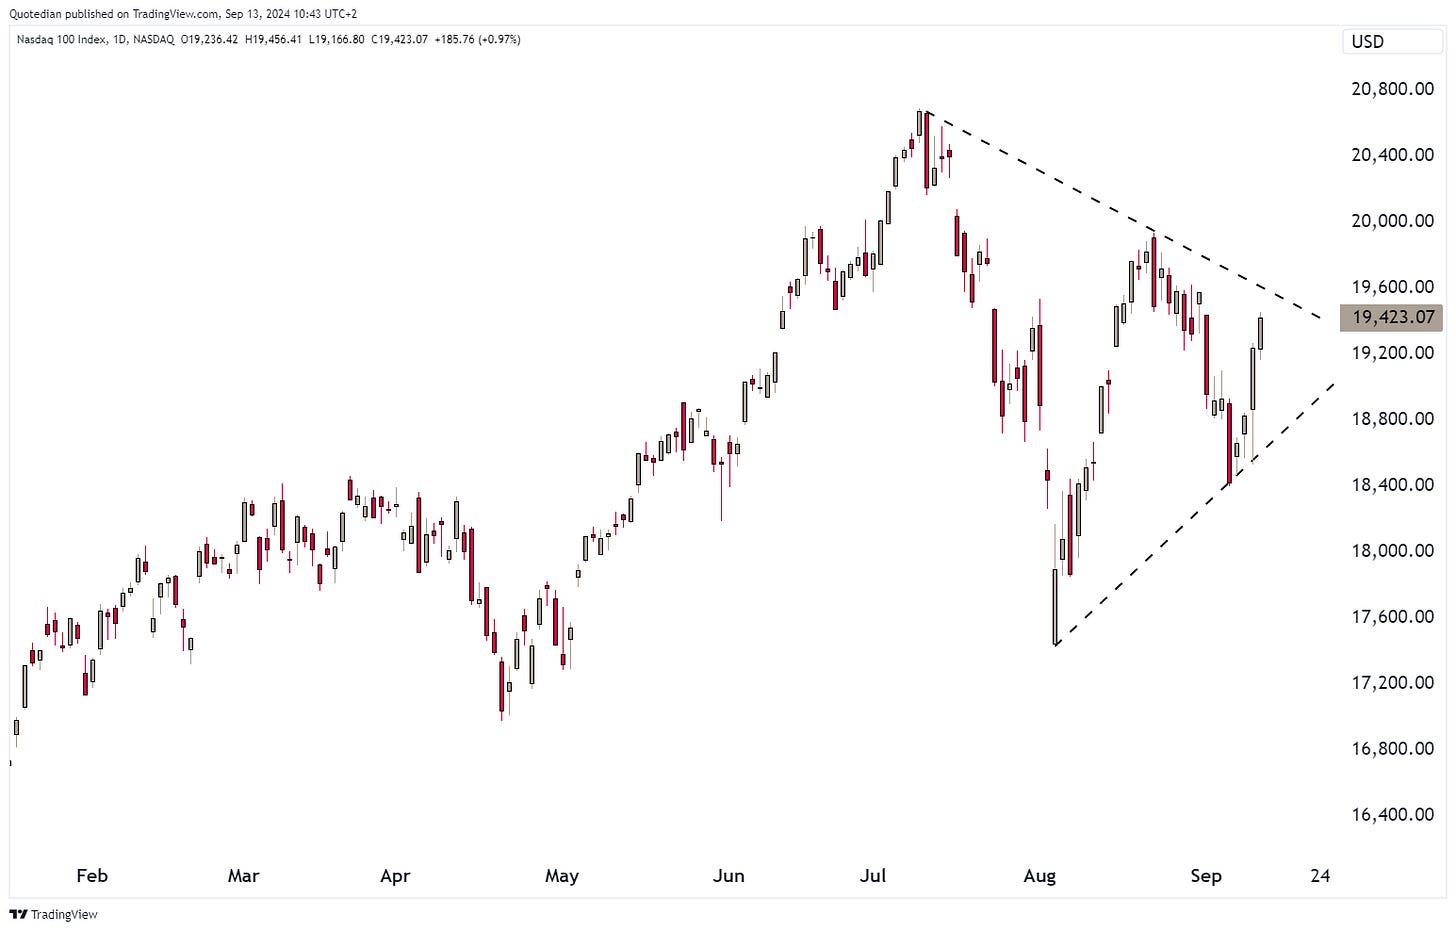
However, we may get an early hint on the direction of the next big move from the Nasdaq, which is at the apex of its consolidation triangle, normally leading to a resolution either way:
I still assign 70/30 odds to an upside resolution, but would not be surprised to see a more complex path unfolding to reach that objective.
So, why 70/30 odds? Well, first of all, breadth of the market, which we speak about nearly daily in our QuiCQ publication
is overwhelmingly positive. As postulated many times since our Q3 outlook (click here) in early July, what we are witnessing is (most likely) not a market top, but a change in leadership (aka rotation).
Perfect example, the advance-decline ratio of the S&P 500 has already broken out higher again,
meaning that more stock are rising than falling.
Time to look at some European markets, starting with the broad STOXX 600 Europe index:
The upper line in the sand is pretty clear hear, with major resistance on four occasions at 525. The lower risk line is a bit more ambiguous, but setting it just below 500 is probably a good idea.
Here also, the advance-decline ratio (red line, lower clip) could give an early risk-on signal when crossing above the black dashed line:
In Japan, the Nikkei (and Topix, not shown) continues to trade below the 200-day moving average:
However, zooming out on the same chart it becomes obvious that we are likely just in a small consolidation period before the next upmove:
We remain bullish here.
As we do on the Indian stock market:
Yes, it ain’t cheap at a current PE of 28x, but given the opportunities about in this flourishing economy, it should be considered a market of stocks and not a stock market.
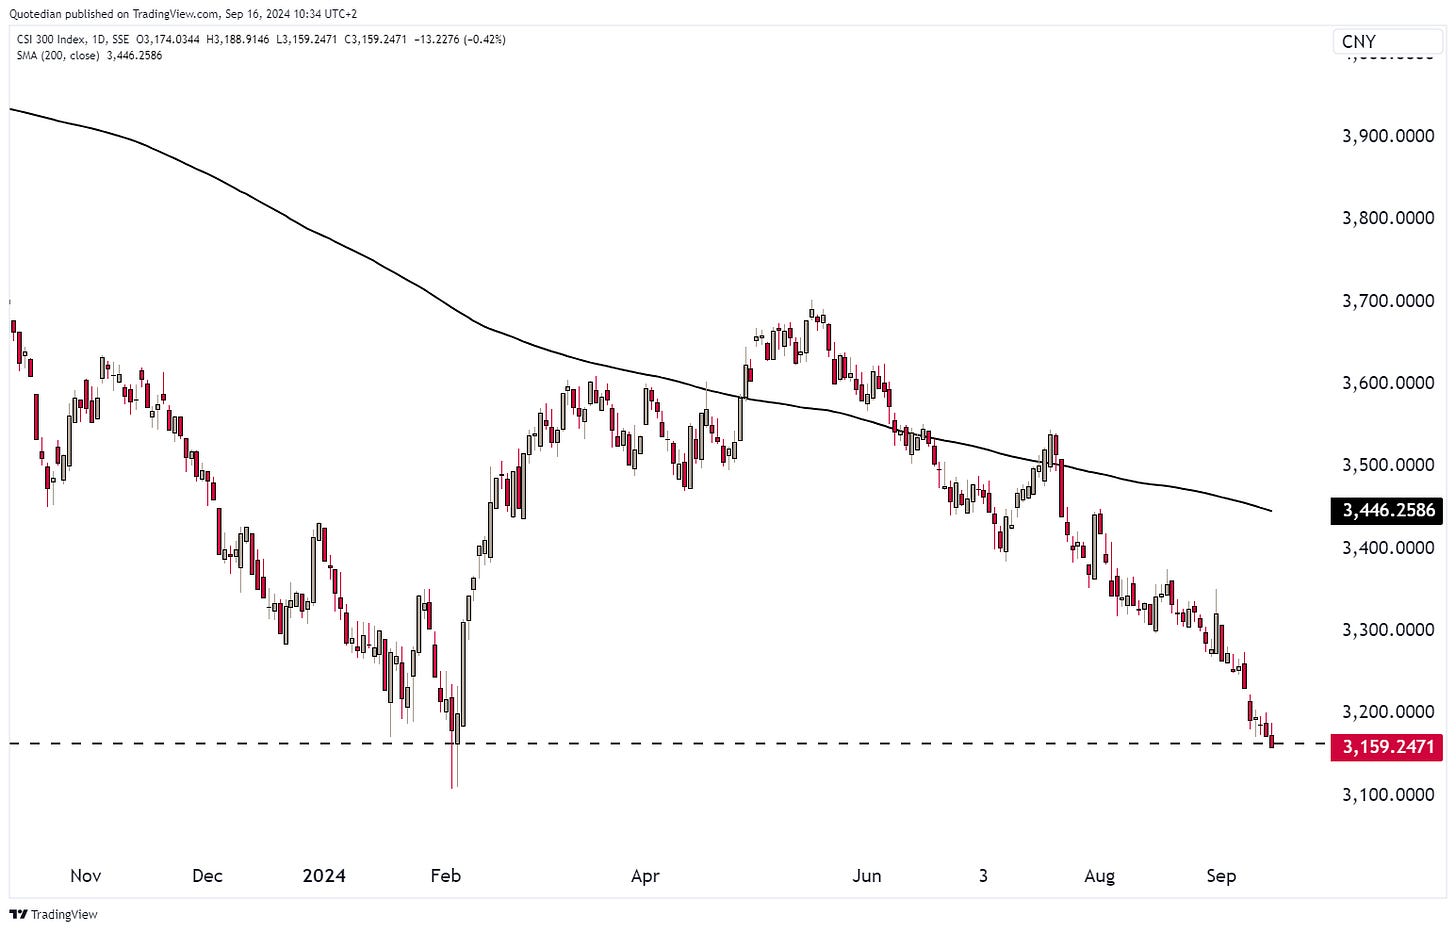
And then we continue to have the opposite situation in China, where the CSI 300 (Shanghai Shenzhen CSI 300 Index) is dirt cheap,
but apparently cheap for a reason, as the index continues to head south and is just challenging its February lows as I am typing this grey Monday morning:
Worth a tactical dabble on the long side here? Only for the least faint at heart, as it seems increasingly likely that China is repeating the Japanese pattern of 1989, after their real estate bubble burst. Referring back to the Nikkei chart above, that index dropped for at least 15 years, with tradable rallies in between, but only made an absolute bottom 20 years after the market top. At the same time, interest rates dropped to zero and beyond, which also seems to be the path for Chinese government bond yields:
Now, before we have our usual look at the top performing stocks, here’s an interesting factor observation.
Did you know that from a technical analysis point of view, value stocks possibly have started outperforming growth three years ago? Check for yourself on the following chart, where the S&P 500 Value to Growth ratio possibly put in a higher low this year than in 2021:
Of course, to complete this pattern we now also need a higher high (than the early 2023 high).
Not convinced?
Let me show you the same for the MSCI EAFE (basically developed markets ex North America) value and growth indices:
Arguably, value put in a low here already four years ago and has been providing a series of higher lows and higher highs, the outright definition of an uptrend… Maybe there is value (pun intended) in not paying 30-40x earnings for growth stocks?
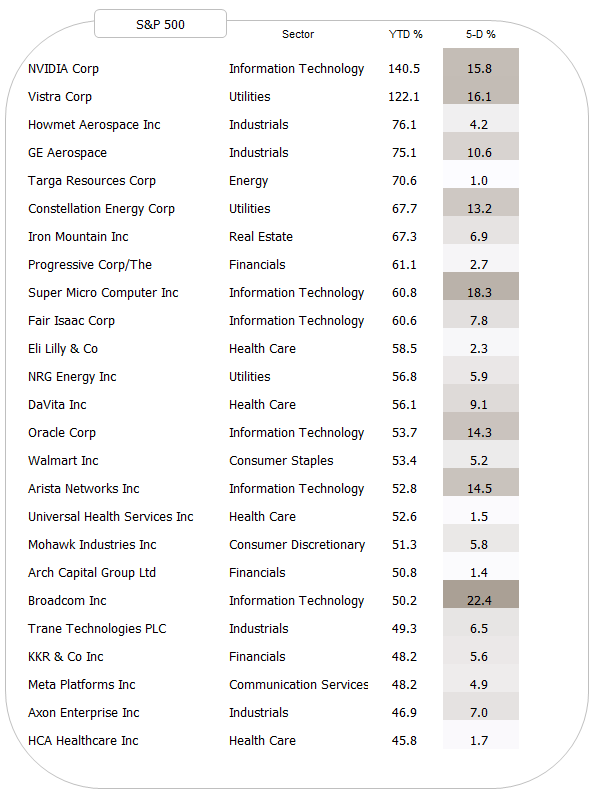
Having said that, and turning to our weekly look at the best peforming stocks on a year-to-date basis and how they have faired over the past five session, we note that the US list is still full of growth names though some value is also sneaking into the list:
And here’s the European list:
On both lists, buying the YTD-winners has continued to work. Strength begets strength.
This week is a big week for central banks, as not only the Fed’s FOMC, but also the Bank of England (BoE), Bank of Japan (BoE), and the Banco Central do Brasil (BCB) meet to set interest rates.
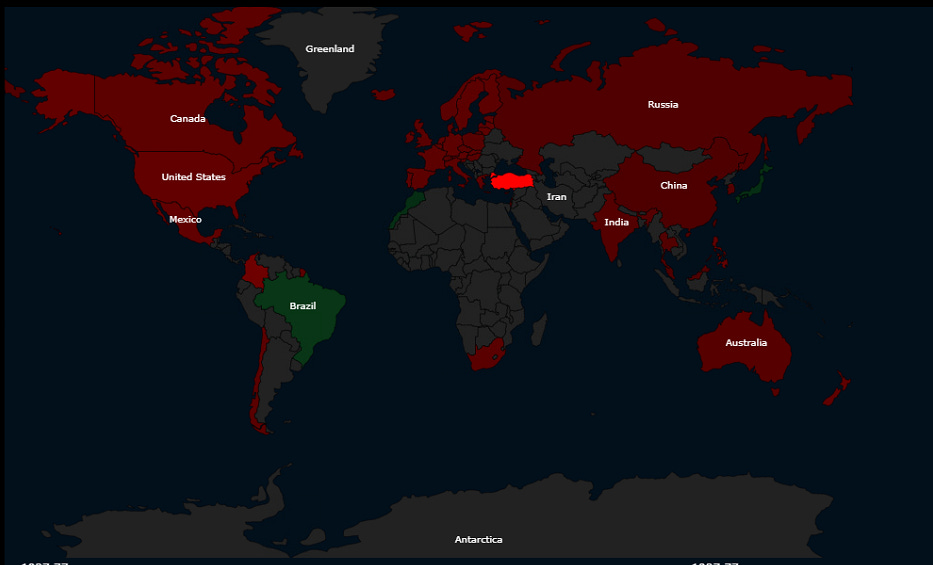
For fun purposes only, here is Bloomberg’s map of implied policy rates over the next 12 months:
Two of the central banks due to make a decision this week are actually expected to hike over the coming year: Brazil and Japan!
But back to the FOMC (Federal Open Market Committee) meeting this week. As implied by futures markets, the cut is a done deal, however, there continues to be a lot of uncertainty regarding the size of the cut. 25 bp or 50bp?
What’s your guess? Vote here:
Uncertainty over the cut size was increased last week by an article of WSJ’s Nick Timiraos who is considered to be the “Fed Whisperer”, i.e. often the Fed will communicate via Mr Timiraos whilst they themselves are in a black-out period ahead of the FOMC meeting. Over the past years, this indirect “forward guidance” has worked will to reduce uncertainty of market participants … this time it has added to uncertainty. Either we will see a “corrective” statement out of the WSJ (Wall Street Journal) today, or we may hear from Chairman Jerome Powell on the Fed’s abandoning of forward guidance.
In any case, the closest ‘freely’ traded bond yields to the central bank’s policy rate are already looking substantially further along the curve:
At the same time, and as highlighted several times over the past two weeks or so, the “uninversion” of the yield curve (10-2y) is now completed, which in the past has been a canary in the coal mine for an impending recession (uninversion black boxes and red shaded area equals US recessions):
Nevertheless, I remain in a soft to no landing camp for now, where a deep recession can largely be avoided.
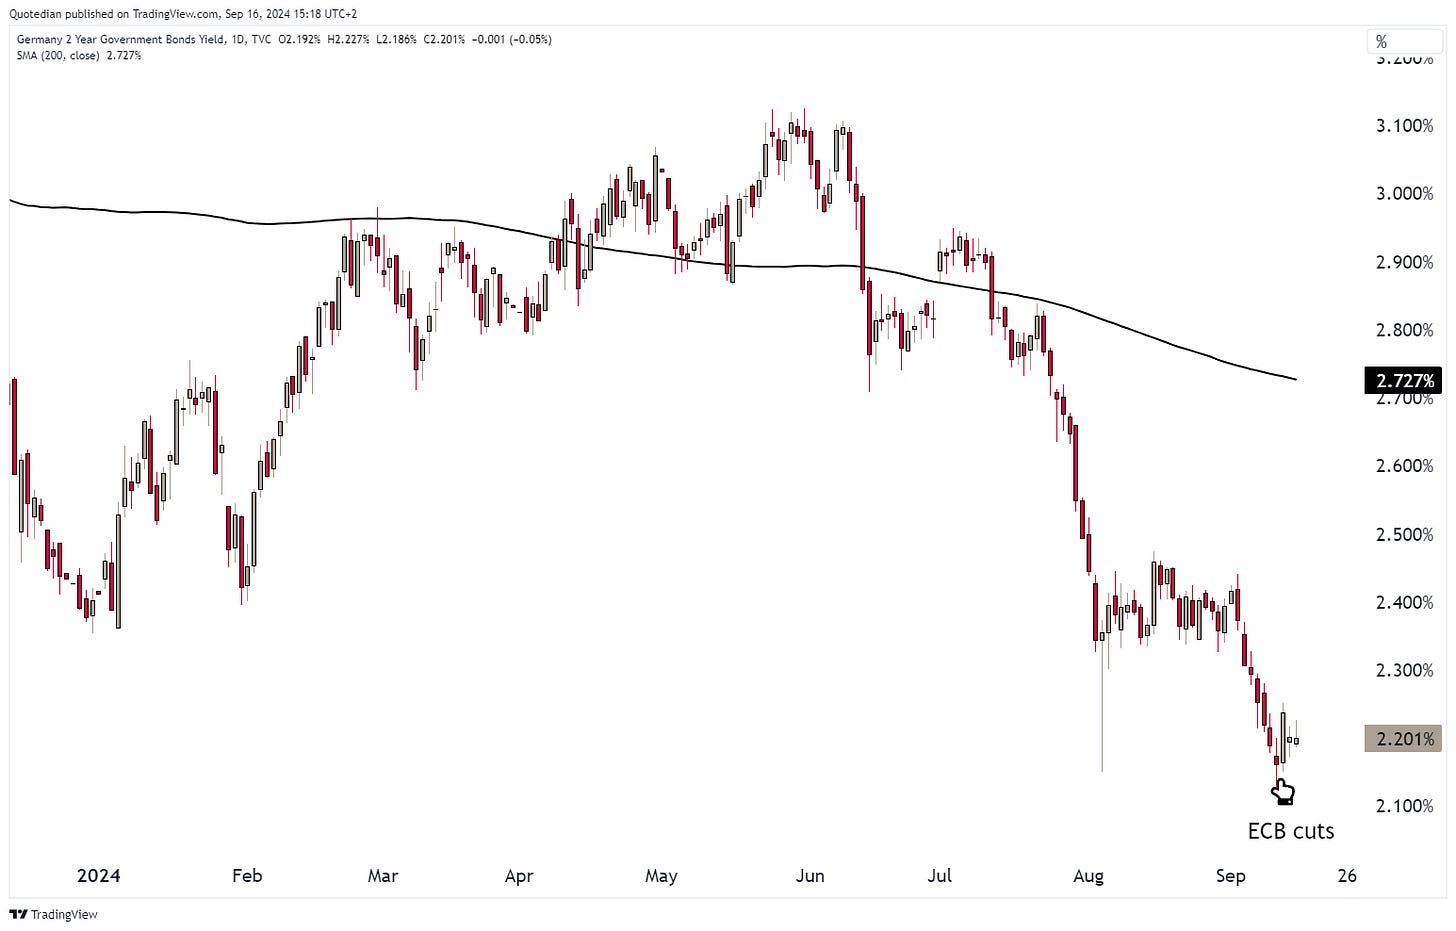
The European Central Bank (ECB) cut already last week by 25 basis points for a second time this cycle, for once front-running the Fed. The 2-year German Bund yield rallied right after the cut in good old sell the rumour buy the fact fashion, but is largely unchanged over the past week:
The Swiss National Bank is not due until next week, with futures markets ‘betting’ for a 25 basis points cut by the outgoing Chairman of the board Thomas Jordan:
Let’s use this as a segue into FX markets,
where the Swiss Franc continues to be shockingly strong, possibly justifying the fore-mentioned rate cut. Here’s a daily chart of the USD/CHF, showing that the cross is hovering just above the 2023 lows:
Which, when zooming out on the same currency pair, results of being the second lowest (highest for CHF) ever, bar the 2011 exception (and ignoring the 2015 one-day-wonder low):
Another currency pair that has been under even closer scrutiny recently is the USD/JPY, with the JPY trading at its highest since July 2023 earlier today:
I love the following chart, which shows, in this case using the JPY carry trade as an example, of how speculative positioning takes a long-time to build up and can go further than many expect (What was it again what Keynes said? Market irrational longer than you solvent…) and how quickly these positions can then unwind, probably mostly due to overuse of leverage:
The EUR/USD has been strengthening again since the ECB rate cut, which only makes sense if market participants expect a 50 bp cut from the Fed this week:
All in all this of course then means that the Dollar index has been weakening again too, sending the Dixy right back to key support at 10.50ish:
Below that there is some support at 99.50 and then for a long-tim … nothing.
Given the Dollar weakness, cryptocurrencies failure to put in a substanial rally must be frustrating to crypto worshippers. Here’s Bitcoin:
But Ethereum looks even worse weaker:
Not all disappointing however has been the performance of Gold, which has been ticking in new all-time highs for three consecutive sessions:
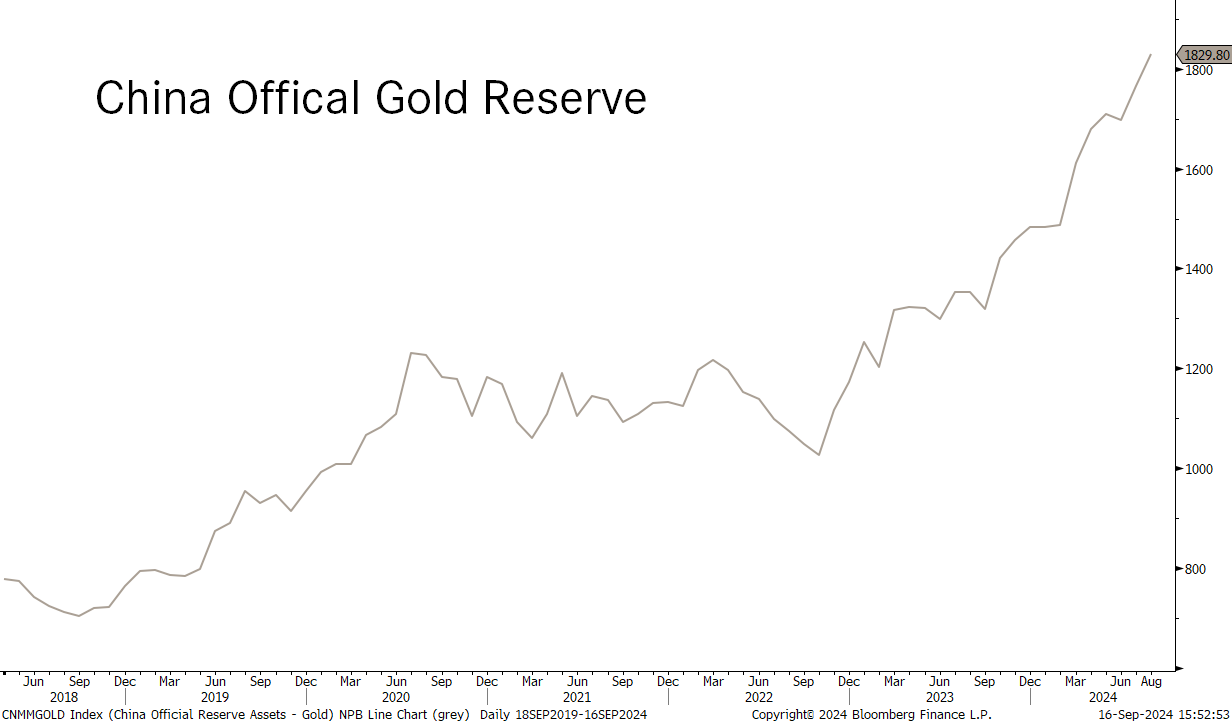
This despite that the Bank of China said that they will stop buying gold … very big tongue in cheek!
But what I find truly utterly fascinating is that retail investors, measured via total Gold ETF exposure (red line in chart below) are only now starting to accumulate the yellow metal:
The chart above is a “Chart of the Year 2024” contender, IMHO!
Oil has been under pressure as we discussed in previous installments, but has recovered from recent lows over the past few sessions:
Common explanation for a lower oil price are 1) less imminent geopolitical risks (NO!) and 2) a looming recession (probably no too).
Another explanation could lay here: How much do you think you would have to spend on natural gas to achieve the equivalent energy of one barrel of crude oil:
Exactly! The last is correct. Hence, if consumers don’t care how their house is being heated or how their goods are being transported, replacement opportunities become real.
More on this in a future Quotedian, as it is far way too late and I need to hit the send button.
Be safe,
André
Apple announced the iPhone 16 last week, with the share price showing little reaction immediately thereafter. This morning, the stock is apparently down two percent pre-market, following analyst reports that early shipping data may signal softer demand for iPhone 16 Pro models.
No wonder:
:-)
Everything in this document is for educational purposes only (FEPO)
Nothing in this document should be considered investment advice
Investing real money can be costly; don’t do stupid shit
The views expressed in this document may differ from the views published by Neue Private Bank AG
Past performance is hopefully no indication of future performance


