Coin Toss
Vol VII, Issue 40 | Powered by NPB Neue Privat Bank AG
“It is useless to try to hold a person to anything he says while he’s madly in love, drunk, or running for office.”
— Shirley MacLaine
So, here we are, a few hours away from knowing who will be elected 60th President of the United States of America and what the dominant colour of the houses (Senate and Congress) will be.
I always find it slightly surprising how emotional we non-voters outside the US get over something we have zero influence and probably sub-zero knowledge. Yeah, yeah, we are all Trump specialists and Harris Connoisseurs … about to the same level that we are the better head coaches for ________________ (insert your favourite football club here)
or even experts on any given natural disaster:
In any case, what seemingly became a “guaranteed” Trump win over the past three weeks, saw a sudden reversal over the past two or three days. Point in case, at the betting offices, Trump (red going forward) gave back nearly all of 30% advanatage over Harris (blue going forward) on Polymarkets betting, apparently the most popular betting shop since its establishement in 2020:
A similar “normalization” can be observed on the RCP (RealClearPolitics, what a oxymoron of a name!”) betting site:
Polling markets, with all their faults, have been less clear all the way long. Continuing with RCP’s polling side of business:
FWIW, a polling “competitor” to RCP, PredictIt, gives kind of the opposite picture to RCP:
All-in-all, and admitting that I am an absolute non-expert on US elections, this is going to be, as the title of today’s Quotedian indicates, a complete TOIN COSS.
As (ir)rational investors we are, the only concern to us should be then, what is the positioning of the market and what could get the market by surprise. But even that, or especially that, is not an easy task.
Here is what is largely perceived as consensus:
Trump will win
A “Red Sweep”, i.e. Senate and Congress hold a Republican majority is a likely scenario
If Harris achieves a surprise win, a “Blue Sweep” is highly unlikely, with a grid lock four years the base scenario
Pundits argue, that the market is positioned for the a Trump win to maybe even a “Red Sweep”. Perhaps.
It is tempting to position for such an outcome, but as we will see, it has already happened.
Is it tempting to take the contrary stance for a surprise Harris win? Tempting!
As usual, I will take the position of one of my three all-time favourite book titles, and will:
In other words, let’s wait for the election outcome we cannot influence, and observe the ensuing market reaction (1-3 days) we cannot influence, and finally react with our asset allocation we CAN influence.
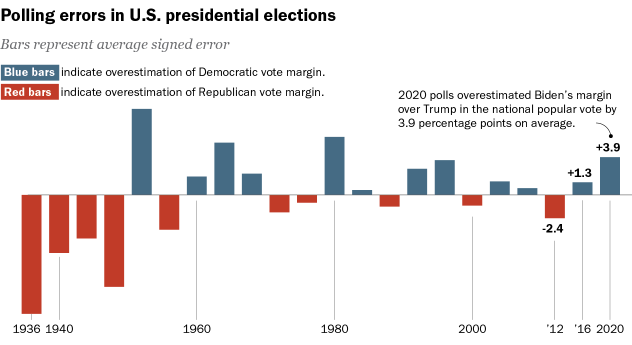
Just before we head over to our precious asset class observations, here one more chart on how futile it is to “think” you “know” who is going to win this upcoming election:
And finally, with October just ending a business day ago, today I will try and cover monthly and year-to-date statistical data tables, longer-term monthly charts and tactical issue regarding the coming week or two … all this without getting too long in the tooth (which arguably, we already are!)
Let’s jump right down the rabbit hole …
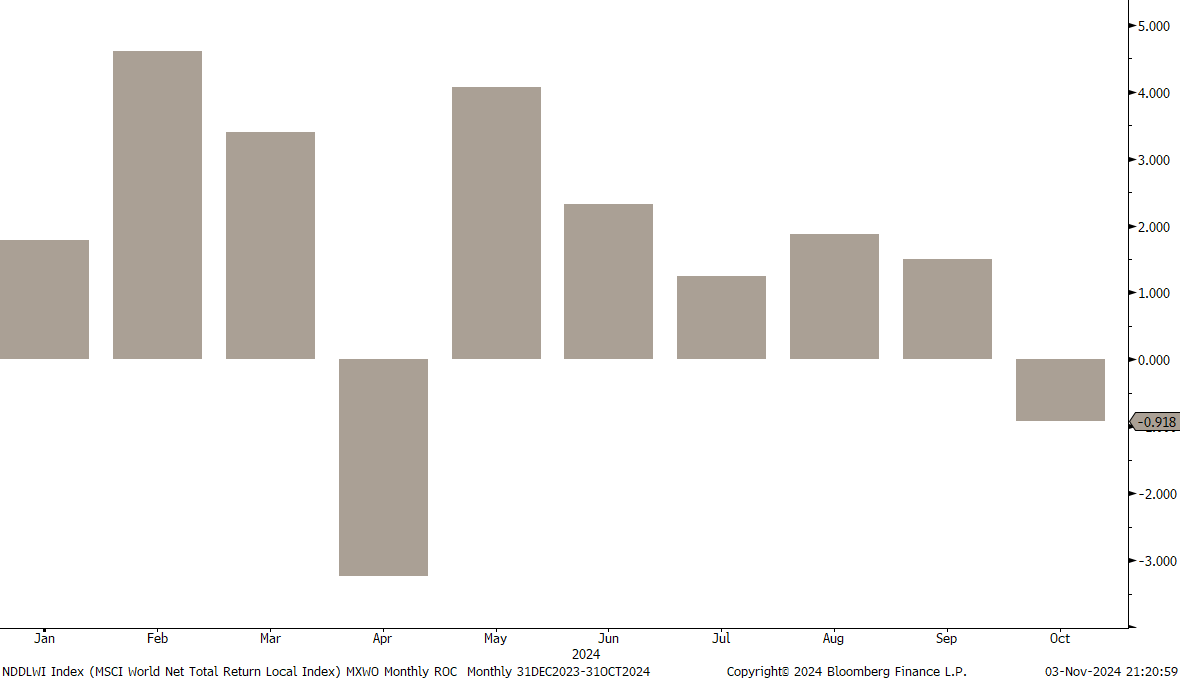
October was not a kind month to equity market investors:
Having said that, it was only the second “down” month this year:
Now again, one of the most difficult “things” in investing is to know when to bet with or against the consensus. Or worse, what is the consensus
Hence, the most “safe fail” away to approach your asset allocation, in case you are a active allocator, is to go rule-based. The monthly chart on the S&P 500 continues to be unequivocally bullish:
And the message is that the bullish trend remains valid above the 200-day moving average, which is still six percent away:
Zooming out on that, this is the long-term chart to watch:
Having said that, signs of a possible (intermediate) trend reversal are emerging:
Circling back to elections, the following charts argues, IMHO, that the market is positioned for a post-election (Trump win?) rally:
The next chart shows the Total Equity Positioning polled by the AAII (Amercian Association of Individual Investors), which confirms that Retail Investors also carry a high allocation to equities:
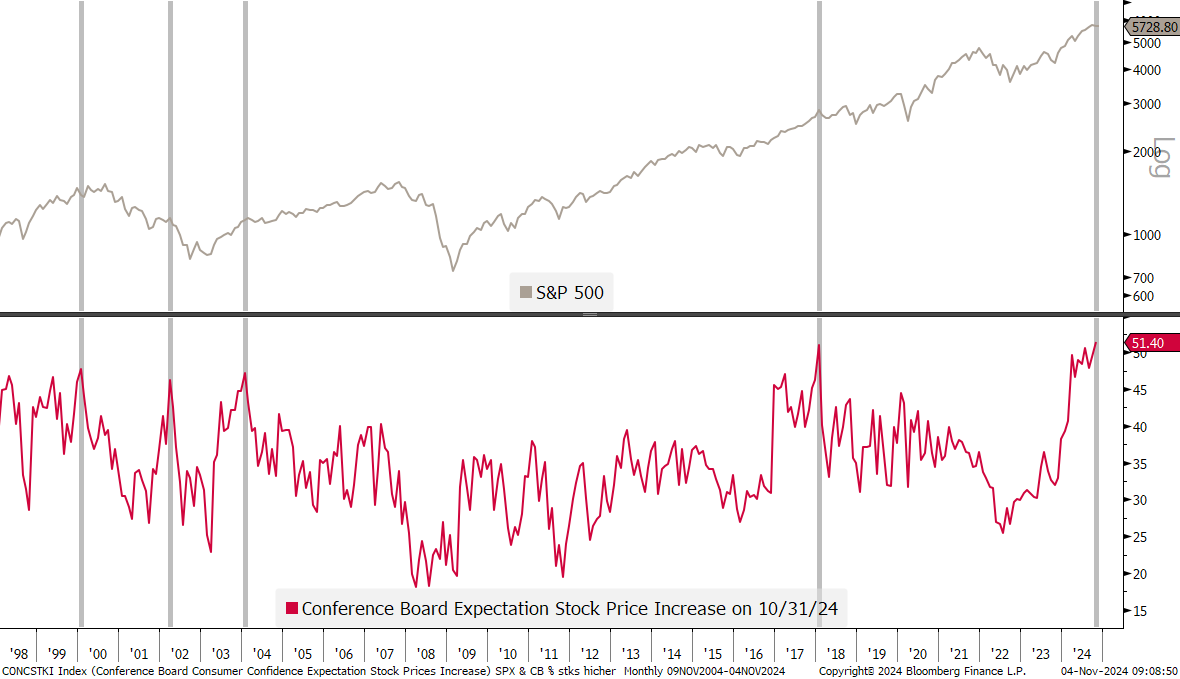
And last but definitely not least, the Conference Board Consumer Confidence survey on “Expectations of Higher Stock Prices” shows that the hope for further stock gains are at their highest ever:
As we all know, HOPE is not a sound investment strategy …
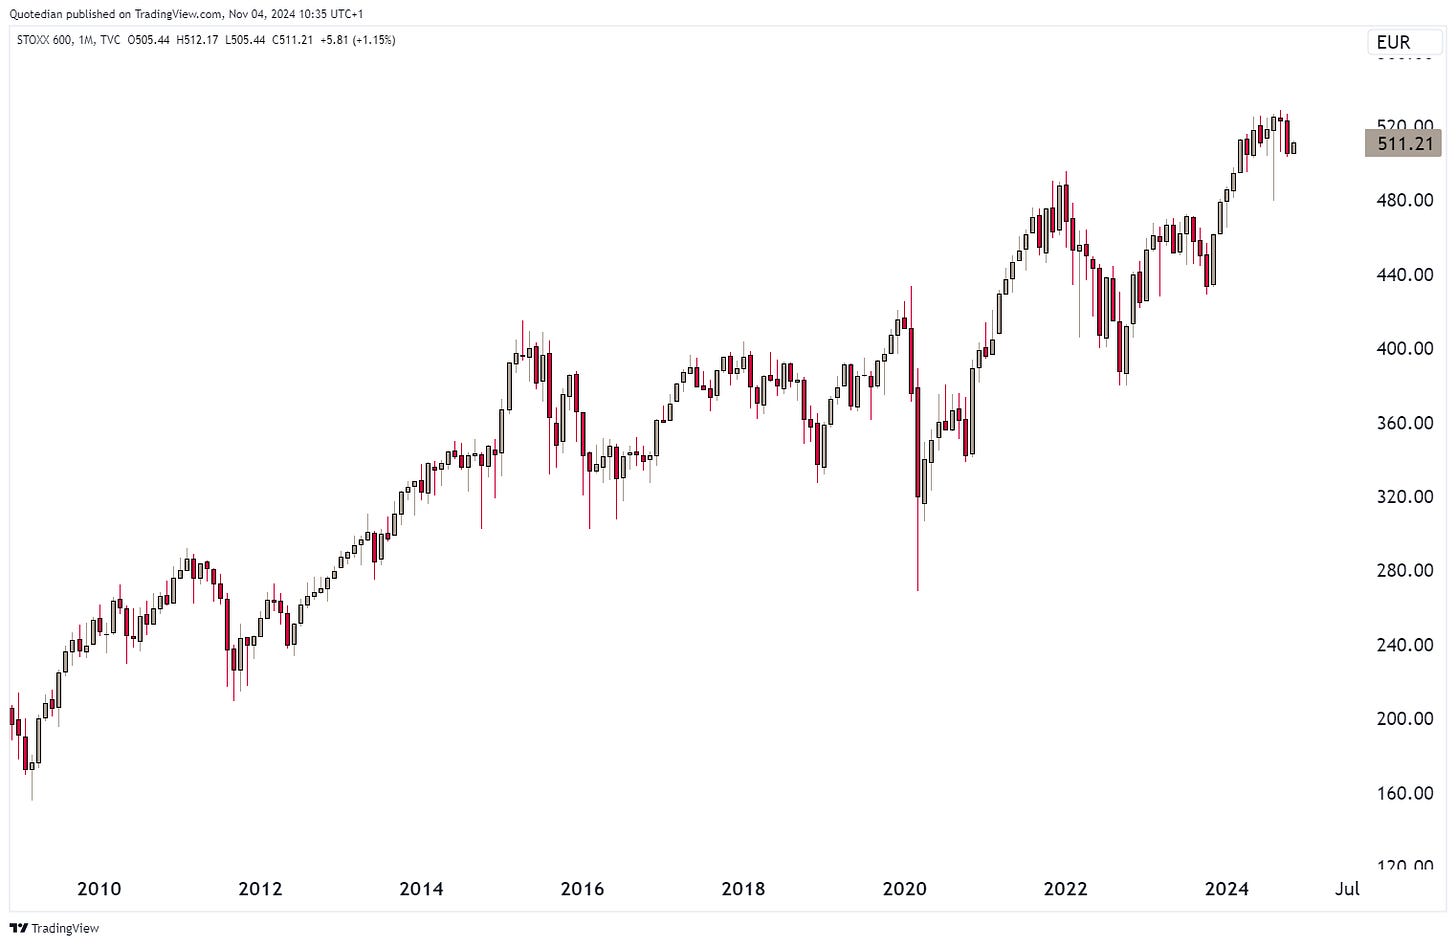
Time to have a look at some international benchmark indices around the globe, starting with the broad STOXX 600 Europe index here on the ‘old continent’:
This is starting to look a tad toppish, and adding an momentum indicator (MACD) does not improve the picture a lot:
Zooming in on the same chart, we can observe some clearly defined ‘Lines in the Sand’ at the upper (525) and lower (503) end.
The market should soon move above the upper end, otherwise the downside could become meaningful on a break of key support.
The narrower and Eurozone-focused Euro STOXX 50 index is already trading below its 200-day moving average and hence adds evidence rather to the bearish outlook:
Checking in on Switzerland’s SMI, we observe that a break of the neckline (aka key support) just below 11,800 could lead to a further swift sell-off (6%) to area just above 11,000:
The key level to observe on the FTSE-100 is 8,100. Risk off below:
Turning to Asia, we find a confusing looking monthly chart on Japan’s Nikkei 225:
In India, the sell-signal based on the Shoulder-Head-Shoulder pattern we highlighted in a previous letter has been triggered as the neckline (black dashed) broke:
Target zone for the down move is 34,500ish, where the 200-day moving average comes in.
And then there is China’s (CSI300) stock market chart …
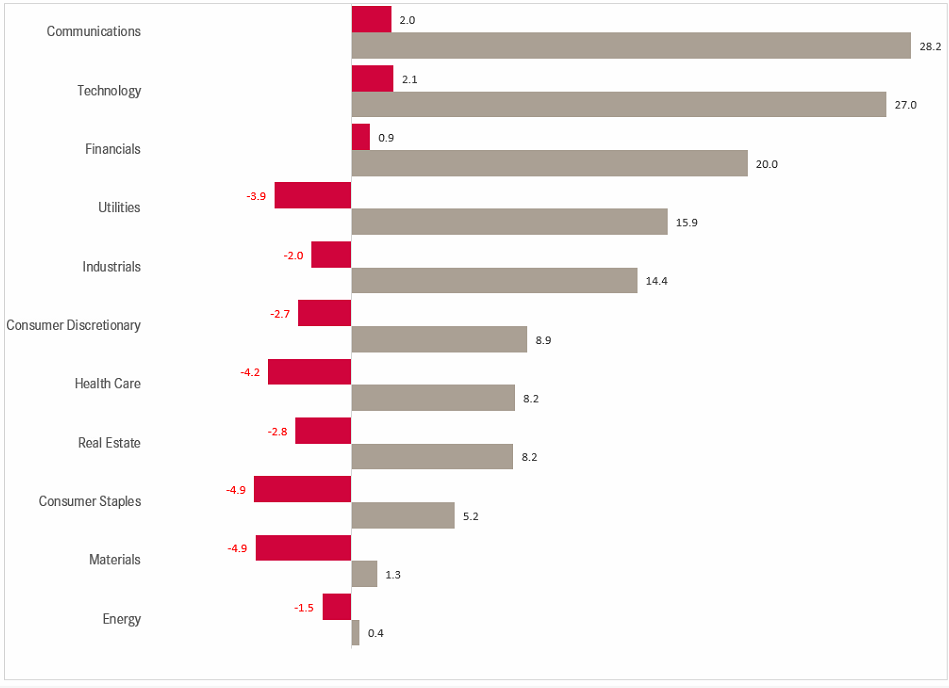
Now, let’s move a step or two more granular, to have a look at some sector and individual stock happenings, starting with year-to-date (grey) and October (red) performance data observation:
Nothing particular sticking out here other than that only the three best performing sectors year-to-date saw further gains in October, whilst all others faced quite important drawdowns.
We already covered the healthcare and the technology sector in last week’s letter (“From Russia with Gas”) and I invite you to check it out if you haven’t done yet so by clicking here.
Finally, just before we turn to fixed income market observations, here’s our list of the top performing stocks on both sides of the Atlantic and how they have done over the past month.
Starting with the US list:
Some stocks have started to correct away from their intra-year highs - make sure to check them out as possible new contenders for your portfolio, as they offer better entry now. But it is always amazing to observe how most of this stocks have continued to propel higher, ignoring the negative months just produced on the indices.
Time to have a glance at the European list then:
It stands out that nearly all stocks on the European list stem only from three sectors: Financials, Industrials and Health Care.
October was not a great month for fixed income markets, as credit spreads more or less stayed flat over the month, but yields shot higher, putting pressure on longer duration plays:
It is not often that a 50 basis points cut (mid-September) by the FOMC gets answered back by a 60 basis points increase at the long-end of the curve (Tens) by the bond market (or should we say bond vigilantes?):
Is the market concerned about the ballooning twin deficit or is the move part of the Trump trade or maybe even inflation worries? The answer is: YES.
A bit of all three probably. On the latter, inflation worries, US breakeven already picked up a week or so before the FOMC decision, reeking out the upcoming “jumbo” cut, which may have been not as necessary as “sold” by Powell & Cie.:
But as mentioned, part of the yield up move can also be attributed to the Trump Trade, i.e. the assumption that fiscal largess will be even …uhhhmm … larger. Hence, yields and Trump’s winning odds had fallen into lock-step recently, including his diminished odds over the past few sessions:
In any case, yields have been given a very different message than other parts of the macro landscape.
Point in case, the price of crude oil has widely diverged from 10-year yields, a relationship that usually holds strong, as both measure economic activity expectations in their own manner:
Expectations for rate cuts have come down quite a bit to “only” five now into from here until the end of 2025:
Though the market still expects two cuts (=50bps) for this year, i.e. a cut this Wednesday and another for the December meeting:
The ECB is also expected to cut again in December, followed by an additional cut as early as January 2025:
German yields have been on the up move too, despite the ECB cutting aggressively and the economic outlook as dire as ever:
This is in stark contrast to Swiss yields, which are just above key support:
Nearly last but not least, UK yields revolted on the labour governments budget proposal last week, which since then has been fighting hard to avoid a Liz Truss moment II:
Finally, here is good overview of expected monetary policy rate moves over the next twelve months (column to the far right) around the globe:
In currency market, the US Dollar surprised investors (or at least us) with continued strength in October.
On a year-to-date basis, only the GBP, the ZAR and the SGD have been able to hold up with the Dollars advance:
Part of this is of course a rising interest rate differential as following the FOMC cut longer-term yields rose as discussed above, further fortified by strong economic readings, which brought down FOMC interest rate cut expectations, also as discussed above.
An other part of the USD’s rise has been attributed to the Trump Trade too, as it is assumed that a Trump win would be bullish for the Greenback. I do not concur with that view. Maybe initially we could get a slightly stronger Dollar, but continued government overspending and exponentially growing federal debt should eventually weigh very heavy on the currency.
For now, let’s just stick to the charts however. Here’s the USD Index (DXY):
The three percent October rally was massive for a currency, but the monthly chart above shows that it really was still only within a range that has been in place since early 2023.
Zooming in on the daily chart, we note that the Trump Trade, as it has on the rates side, is unwinding a tad and I would even argue that the currency could be on its way back to 100 to retest that key support level again:
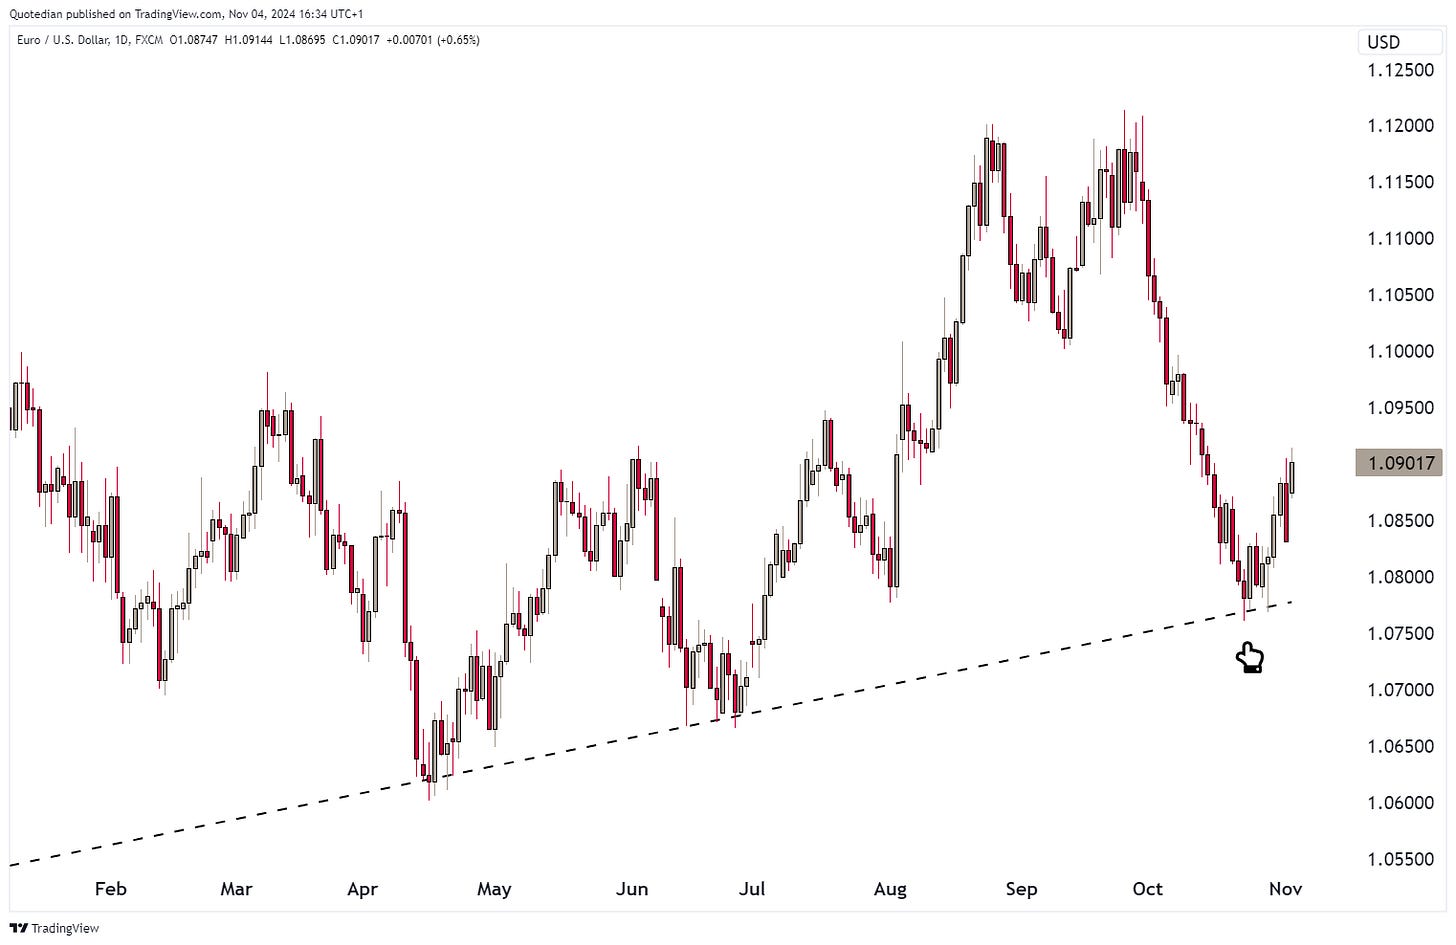
Switching to EUR/USD cross-currency pair, we note that this currency pair has turned around (pointing hand) exactly where it had too (dashed line):
To me, the USD/CHF cross has been indicating an end to the USD rally for at least two weeks, buy refusing to move higher:
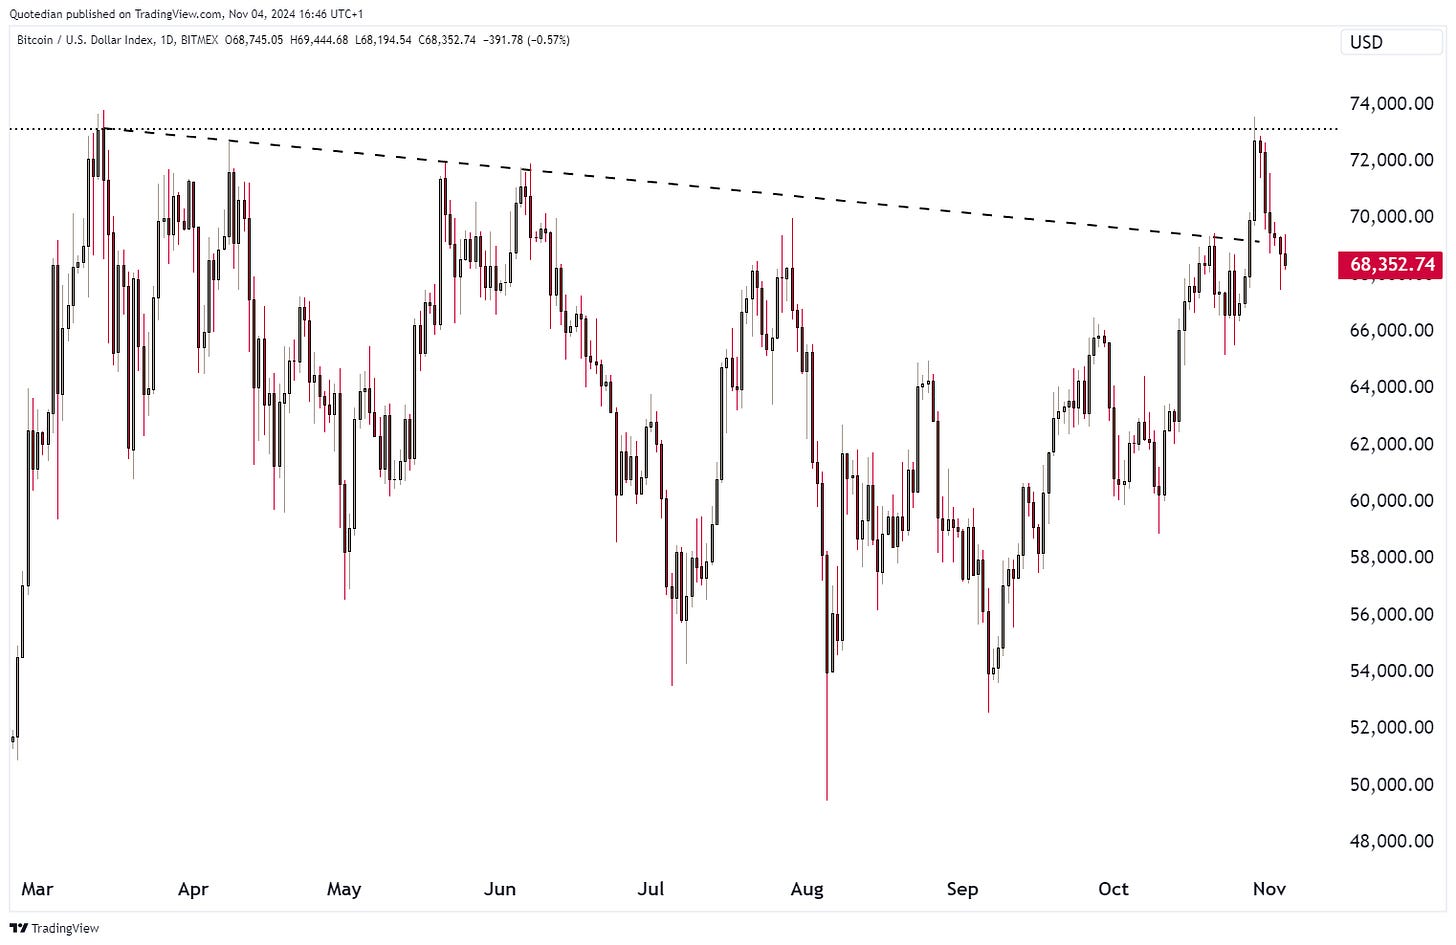
Another Trump Trade unwinding is long Bitcoin. The cryptocurrency failed to surpass key resistance at approximately 72,000 and investors are currently selling hard:
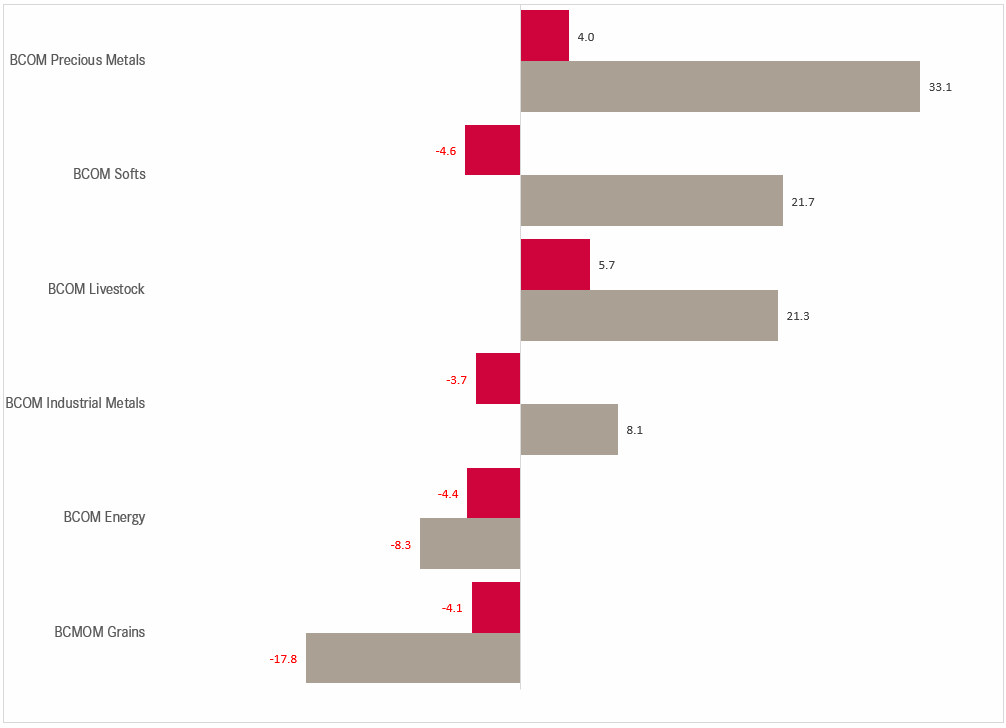
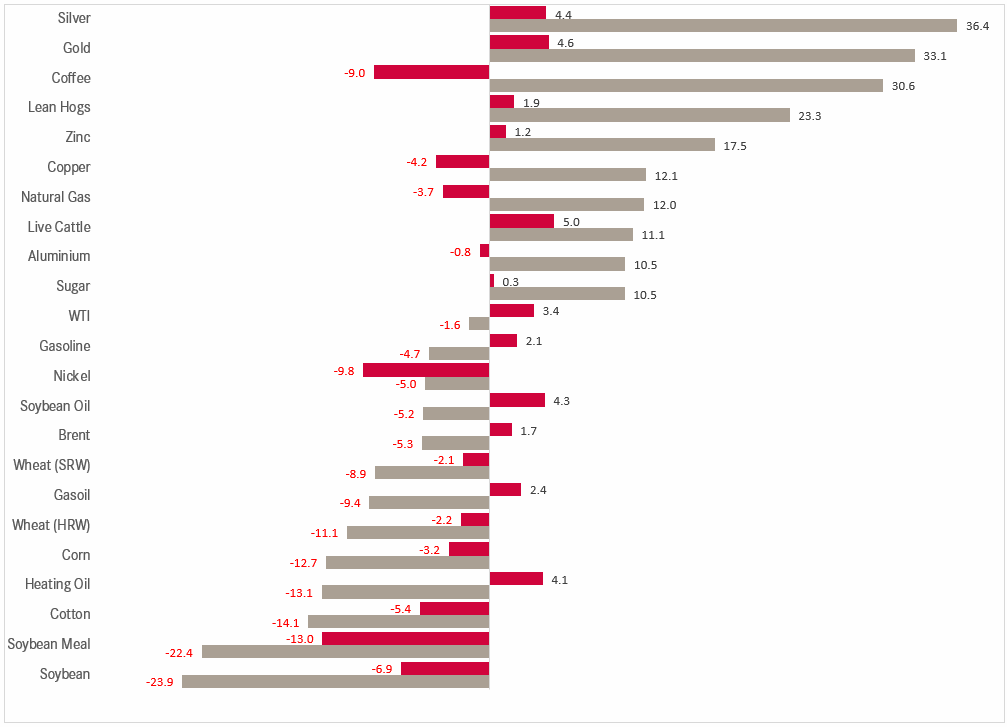
In the commodity segment, October saw further gains for precious metals and livestock, though all other ‘sectors’ gave back gains:
Moving a tad more granular, we see that of our selected commodity futures Silver and Gold are the absolute leaders now, as coffee gave back close to ten percent during the month:
Coffee surprises me, as it feels me alone could have been responsible for the 40% move higher into the end of September.
The 35% Gold move higher this year is nice for us who are long some Gold, but is probably worrisome in the greater context of things:
Or asked differently, do you have enough gold?
Good news, a short-term correction may be unfolding soon, as we got a TD Sequential 9 sell-signal and a topping out momentum indicator on the weekly chart:
Crude oil (Brent) is recovering from its lows of a few weeks ago, however, this is clearly the least clear chart (pun intended) I have seen in quite a while:
It is high time to wrap up this week’s letter and quickly glancing back at what I have jolted down today, it looks like I am the most bearish I have been in quite a while.
but actually, I continue to feel pretty constructive on the stock market for the next 12 months, hence, my (relative) bearishness must come from the feeling for a correction long, long overdue.
As usual, when getting a tad too sour on the outlook, I remind myself of my second favourite book title out of my top 3:
This makes me bullish enough to look forward to the (maybe) upcoming correction, which will allow the collective us to regain exposure to good stocks at somewhat more reasonable prices.
But above all, let’s use our charts to remain disciplined and risk-focused, remembering my thirds all-time favourite book title:
Have a entertaining week!
André
Late last week it was announced that Nvidia (and Sherwin-Williams) were to replace Intel (and Dow Chemcial):
The previous biggest change to the index dates back to August 2020, when ExxonMobil (XOM), Pfizer (PFE) and Raytheon (RTX) were replaced by Saleforce (CRM), Amgen (AMGN) and Honeywell (HON).
Spoiler Alert: No, those were not good decisions by the Dow Jones index committee. Their best call was Pfizer, which underperformed strongly until today. However, all their additions (CRM, AMGN, HON) underperformed the index itself and the removed XOM and RTX outperformed the additions n-fold.
Bad news for NDVA (and SHW) then?
Everything in this document is for educational purposes only (FEPO)
Nothing in this document should be considered investment advice
Investing real money can be costly; don’t do stupid shit
The views expressed in this document may differ from the views published by Neue Private Bank AG
Past performance is hopefully no indication of future performance


