Crude Reality
Volume V, Issue 183
“To attain knowledge, add things every day. To attain wisdom, subtract things every day.”
— Lao Tzu
DASHBOARD
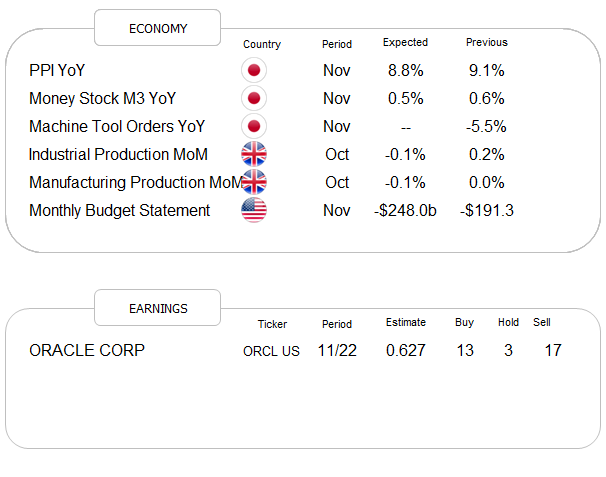
AGENDA
CROSS-ASSET DELIBERATIONS
It was an uncomfortably difficult week for global equity investors, with many major benchmarks retreating meaningfully:
As a matter of fact, for the S&P 500, it was the largest weekly loss (-3.37%) since the interim market bottom in September:
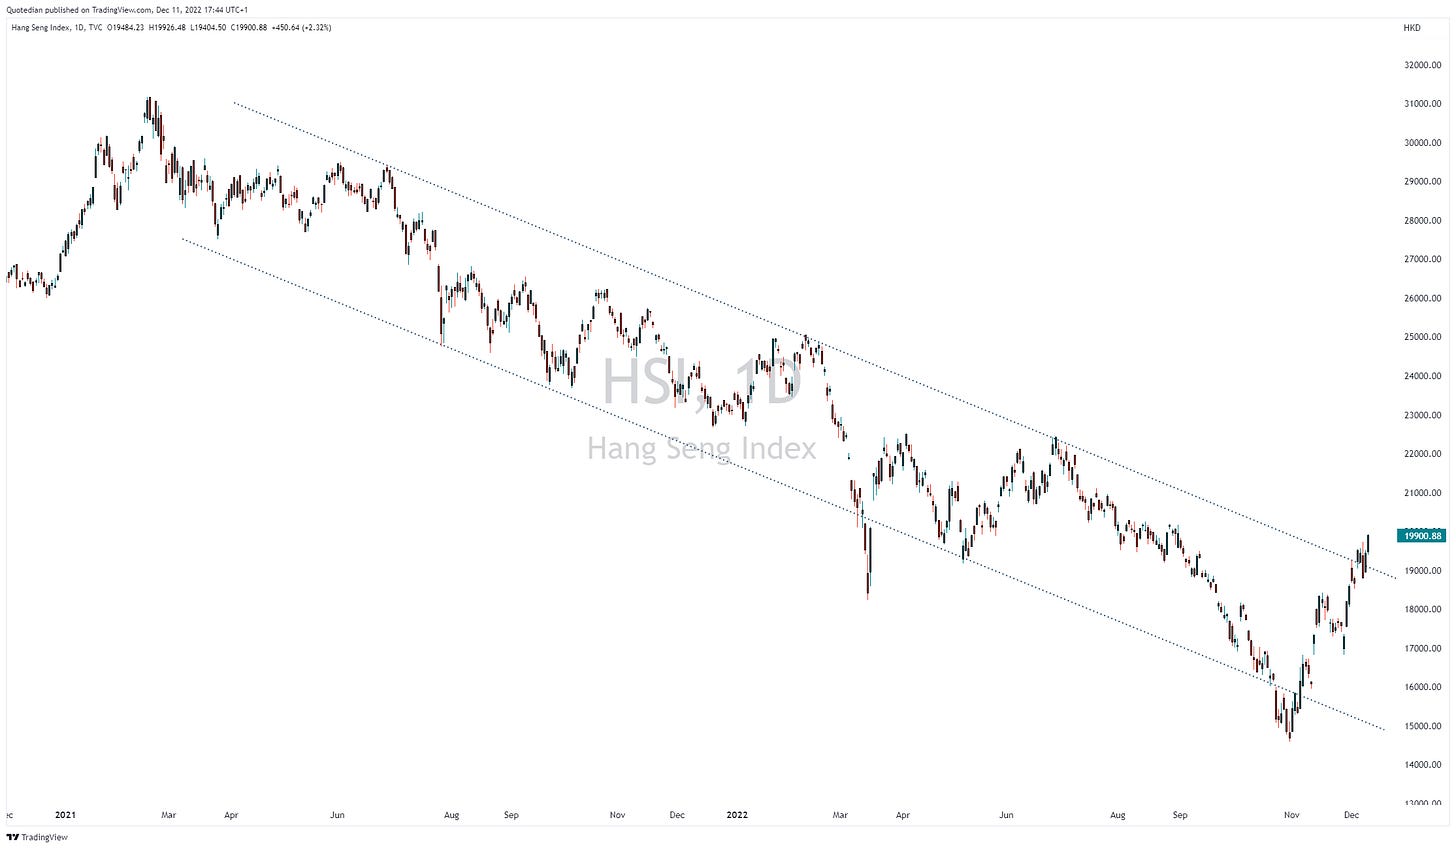
At the other end of the performance spectrum, however, were China-related markets, which continue to rebound on signs of a post-COVID reopening. Here is Hong Kong’s Hang Seng index for example:
Surprisingly enough, when measuring overbought/oversold conditions (OBOS) via the RSI, the index is not yet overbought on either the daily or the weekly timeframe.
Friday’s session itself saw stocks holding up the entire session, even after a higher-than-expected PPI print until sellers showed up in the last hour of trading:
The weekly sector performance chart shows there was really nowhere to hide, except for utilities maybe.
But the graph also indicates that investors who have done fantastically well in energy stocks this year are giving back some of their gains. This is then also reflected in your weekly statistic, which shows the top 25 performing stock in Europe and the US on a year-to-date basis and their development during the most recent week:
Some nasty mean reversion cases in that table!
The weekly performance heatmap for the s&P 500 also reveals that even the index heavyweights provided no shelter - quite to the contrary in the case of Google and Amazon:
Remember how we discussed a few months ago how the FAAANG stocks (plus Tesla) had acted as ‘saviours’ to the s&P 500 in the past and were a strong argument in the ‘passive investing’ camp? Seems that the tide could be turning, as the equal weight S&P 500 (RSP) continues to outperform the market-cap weight version (SPY):
Google’s chart is not looking healthy, and the talk of the week was that a new AI ‘app’ called ChatGPT would turn Google’s search engine obsolete:
Amazon’s share price has also seen better days and Jeff’s announcing his retirement as CEO in April seems awkwardly well-timed:
Bond markets had quite the rollercoaster week, with the US 10-year Treasury benchmark yield briefly violating key support only to turn around on a pin’s head and head higher again:
In terms of performance, that actually meant that most fixed-income investors gave back some of their recent recovery gains:
Only the Asian segment did actually very well, mainly due to contracting credit risk, also on the back of a China re-opening.
Here’s for example the iShares USD Asia High Yield Bond ETF (AHYG) traded in Singapore:
Who said you can’t make serious money in bonds?
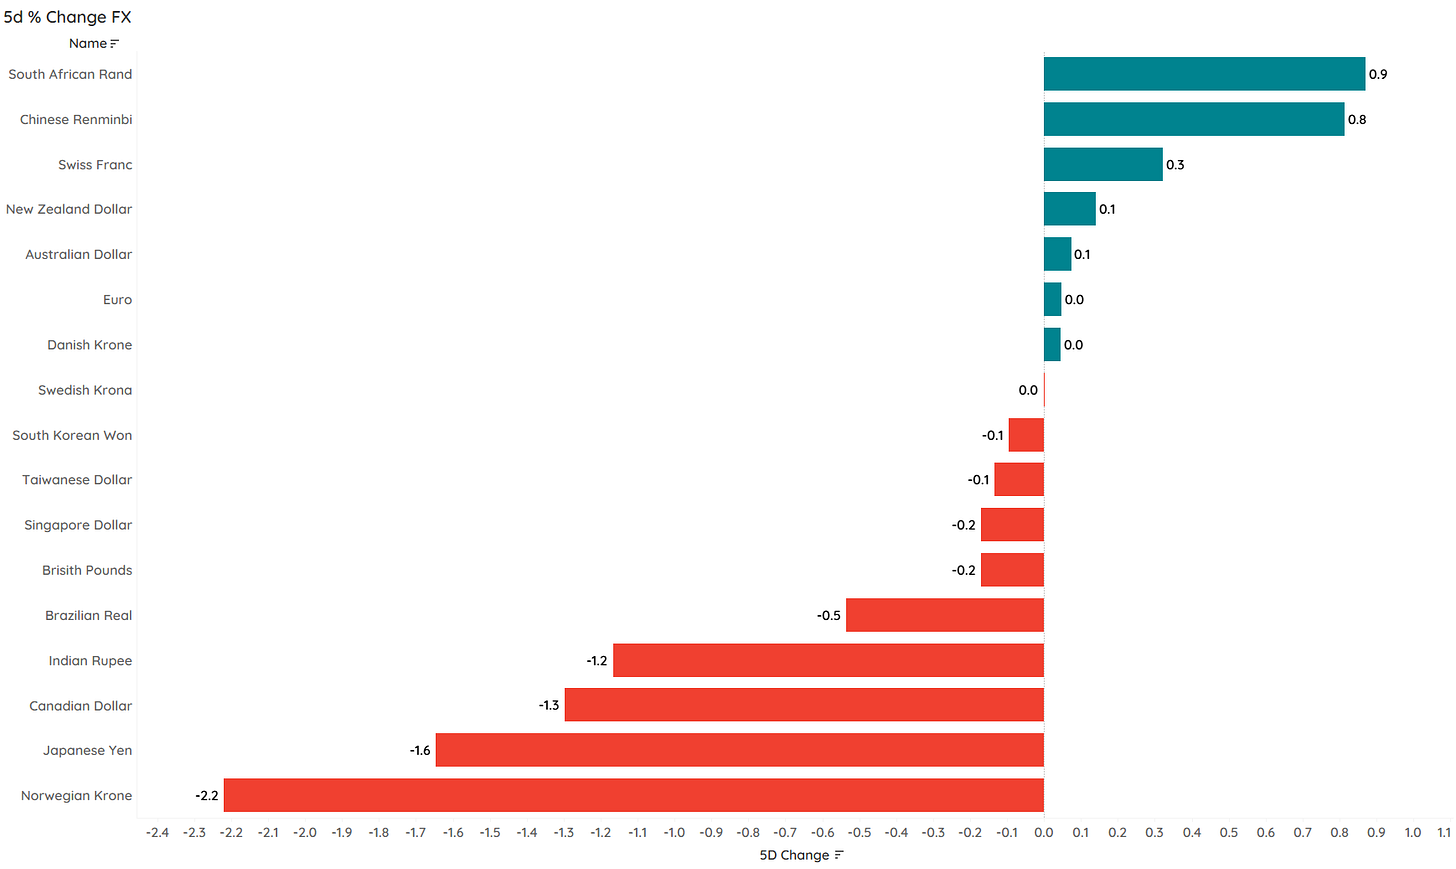
The US Dollar had a week of mixed performance versus other major currencies:
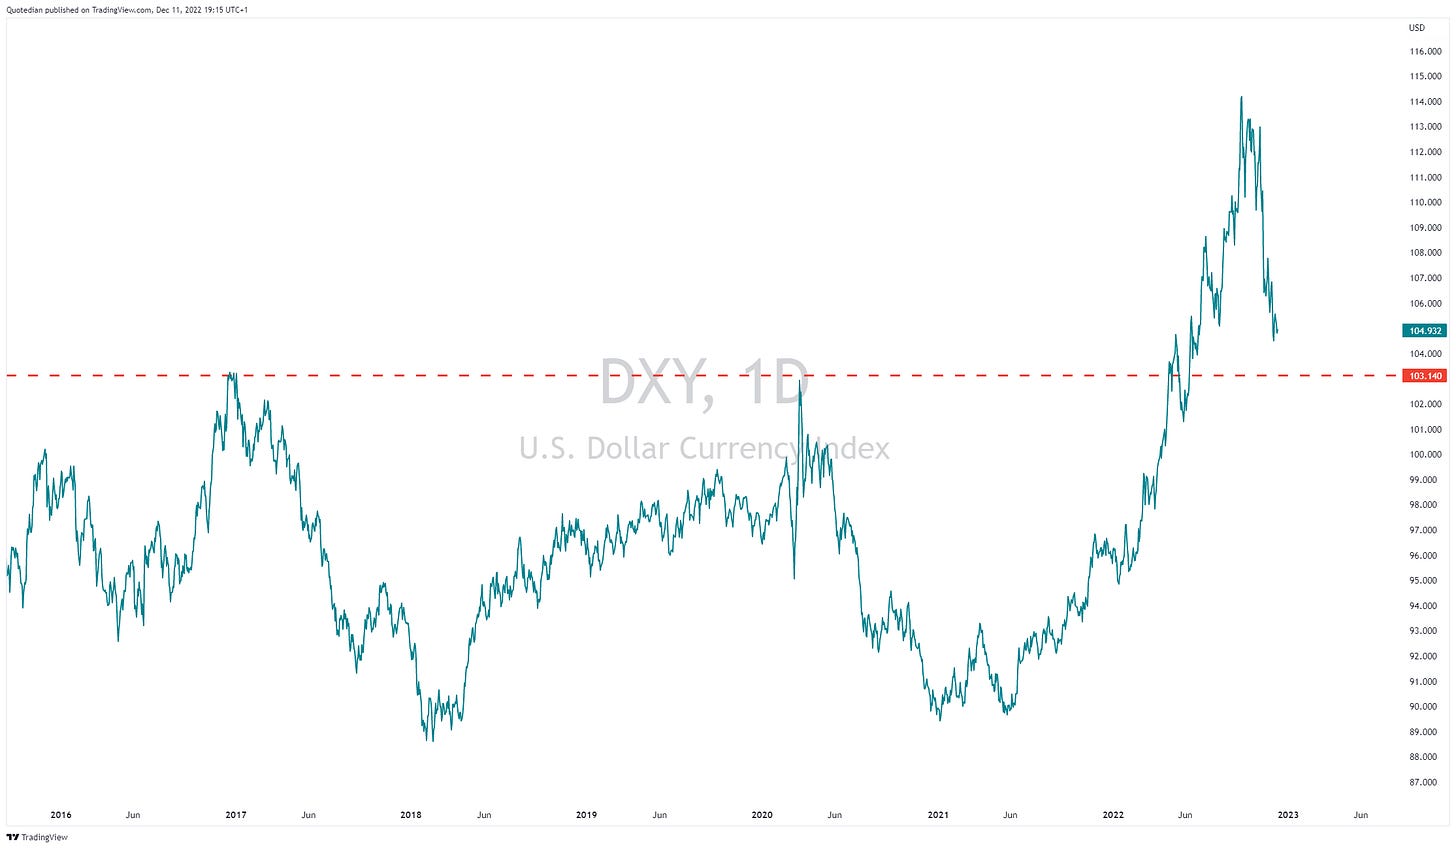
For the US Dollar index (DXY) itself, undoubtedly the 105.50-104.80 zone is of some technical importance:
But zooming out a bit, 103.00ish seems to be the all-important pivot level:
The chart of the Euro (an important component of the DXY) versus the US Dollar, remains very constructive for higher prices, which could bring the DXY to that 103.00 target over the coming weeks:
The NOK (below versus the USD) dropped this week, as the price of oil faltered, but remains in the cyclical uptrend (for now …):
This brings us to commodities, where indeed energy commos were the talk of the town this week:
Brent and WTI dropped below their respective and important support levels we had discussed over the past few weeks. Here’s the WTI example:
As usual, Mr Market is in the game of trying to kid as many investors as possible and just as oil bulls for rubbing their hands on serious signs of China reopening (which should increase oil demand by a couple of million barrels), it seems that the focus now has shifted to next year’s recession.
Time to hit the send button - enjoy the rest of your Sunday!
CHART OF THE DAY
The fine folks at Nautilius Research had the following two charts out earlier this week:
Both charts compare the current market (S&P 500) to previous market pictures, with a relatively high correlation for the analogues.
So, which will it be? Let’s poll it!
Thanks for reading The Quotedian! Subscribe for free to receive new posts and support my work.
DISCLAIMER
Everything in this document is for educational purposes only (FEPO)
Nothing in this document should be considered investment advice
Past performance is hopefully no indication of future performance


