Dovish Jumbo
Volume V, Issue 159
"Pundits forecast not because they know, but because they are asked"
— John Kenneth Galbraith
DASHBOARD
AGENDA
CROSS-ASSET DELIBERATIONS
In The Quotedian exactly a week ago (Pivot³), I dedicated the intro to an analysis on the subject of pivots. To briefly summarize, I mentioned two pivots that investors are paying the most attention to (1 and 2) and one pivot they are largely ignoring (3) but should be really the only focus:
Will the Fed pivot on its tightening monetary policy stance?
Will President Xi pivot on his self-induced zero-COVID policy?
Will investors realize that regime change is upon us and their investment strategy needs to pivot?
A week on, the answer to all three is no, even though especially 1 and 2 were under specific discussion, with first a rumour circulating that China was abandoning zero-COVID policies and later in the week, investors were hoping for signs of pivot by the Fed but got quite the contrary). Both events had direct impact on financial markets and reinforce my view that (3) is the most important pivot investors should consider. As I put it last week:
It is time to take down the sails we used for smooth sailing over the past decades and start using the oars to navigate the waters ahead.
On to yesterday’s session …
European stocks followed Wall Street’s Wednesday template of lower stock prices, albeit admittedly at a more muted pace. US stocks themselves opened again sharply lower, continued to drop in the first half hour of trading, but then got ‘saved’ by a weaker than expected ISM Services number (54.4 reported versus 55.3 expected versus 56.7 previous), and then trotted sideways from there throughout the entire session. Here’s the intraday chart:
The Nasdaq (-2%) dropped at roughly double the pace of the S&P 500, indicating that bond yields were probably higher during the session (see FI section further down). This underperformance of longer-duration stocks is then clearly visible in the sector performance table,
as well as on the more granular market heatmap for the day:
To finish with the equity section and zooming out a little bit, it seems that the dominating benchmark of recent has not been the S&P 500 and neither the Nasdaq 100, but our good old friend the Dow Jones Industrial Index. Not only did it take the lead after the recent mid-October lows
but also did it provide the best guidance to the stall at the trendline (black dashed) and the 200-day moving average (blue):
And last but not least, it is also worth observing that the market stalled right when retail investors’ bullishness was highest since August
and bearishness was at its lowest since March:
On the fixed income side, equity performance already hinted that bond yields were higher on the day and so it was. Here’s the US 10-year treasury yield:
Interestingly enough, the slope of the yield curve is now as inverted as it has been for the past 40 years or so:
The red-shaded areas are the official NBER recession periods, so go figure what the bond market is discounting in those regards …
In terms of credit risk and spreads, we will try and have a closer look in the Sunday edition of The Quotedian, but using the iShares Corporate High Yield ETF as a proxy, credit spreads look more like the Nasdaq than the DJ Industrials index, if you know what I mean:
On the currency side of investment matters, it was another decisively strong day for the greenback:
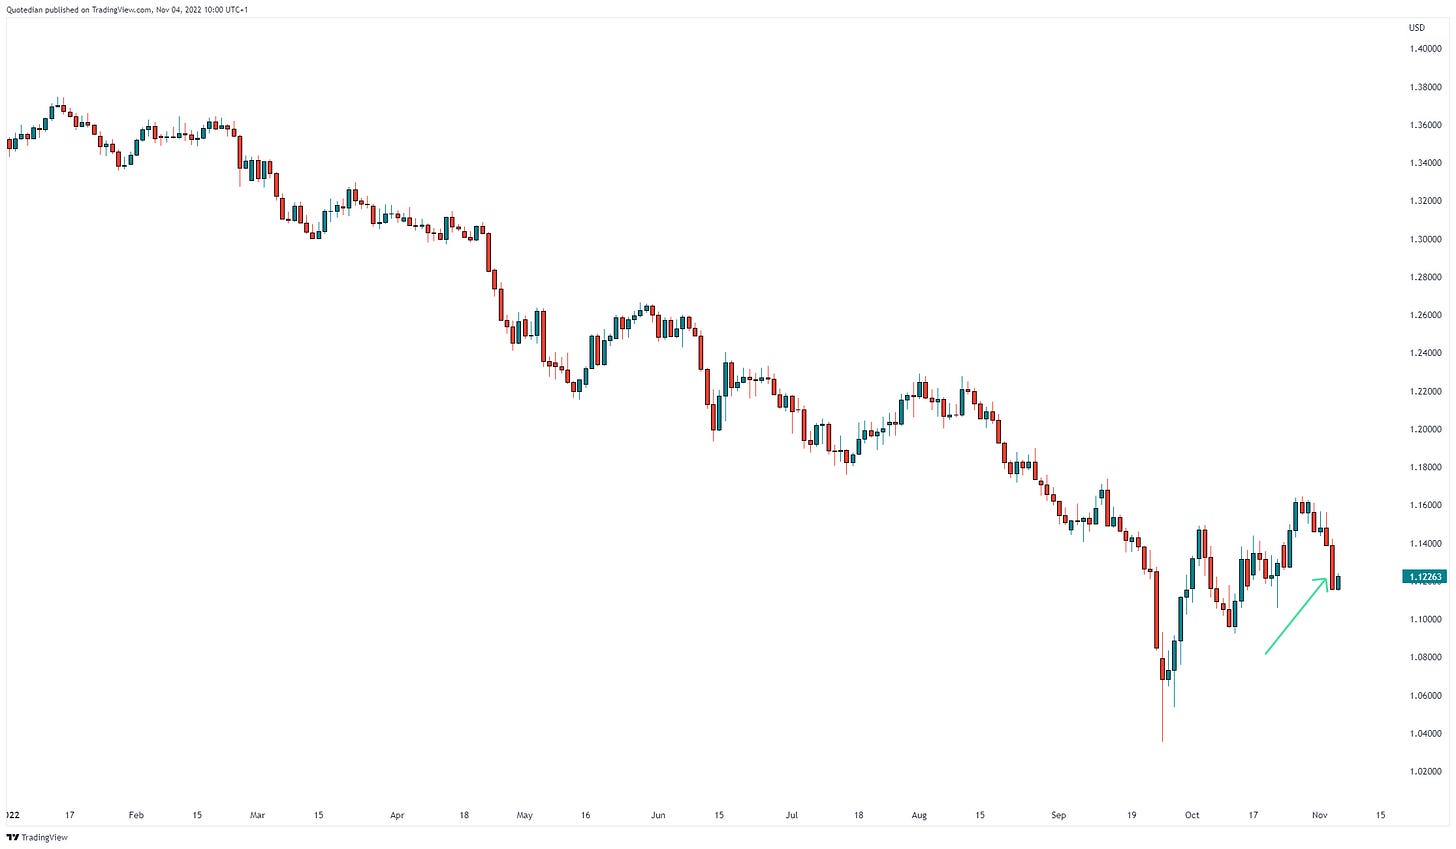
On the chart, this looks as follows:
WOW! Nice triangle break, which if holds true, has no kindness to the risk-on trade …
But most focus was on the British Pound once again, as the BoE delivered a dovish Jumbo hike, if that makes any sense? Jumbo as in a 0.75% hike, dovish as in BoE Governer Bailey sounding very dovish in the ensuing press conference, with taking the contrary stance to his Fed colleague the previous day, indicating the terminal rate may be lower than expected.
What a long and complicated way to say that the Pound got, eh, pounded yesterday:
Little to be reported back from the commodity front, where Gold has started to flatline at low levels:
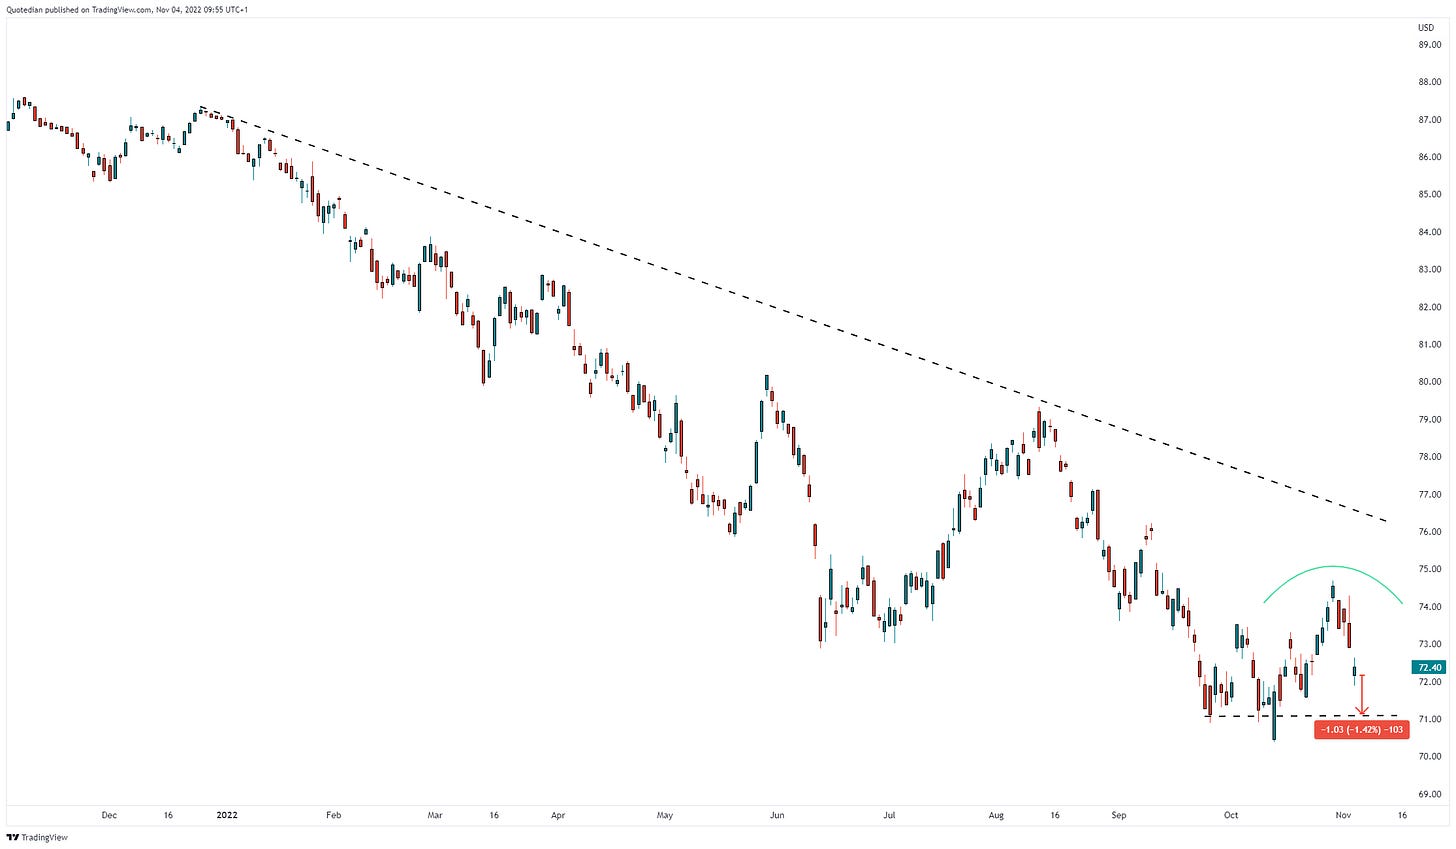
Maybe worth observing is the price of crude, which at least on the chart seems ready to try a breakout attempt higher:
USD98.50 seems to be the magical point on the chart above.
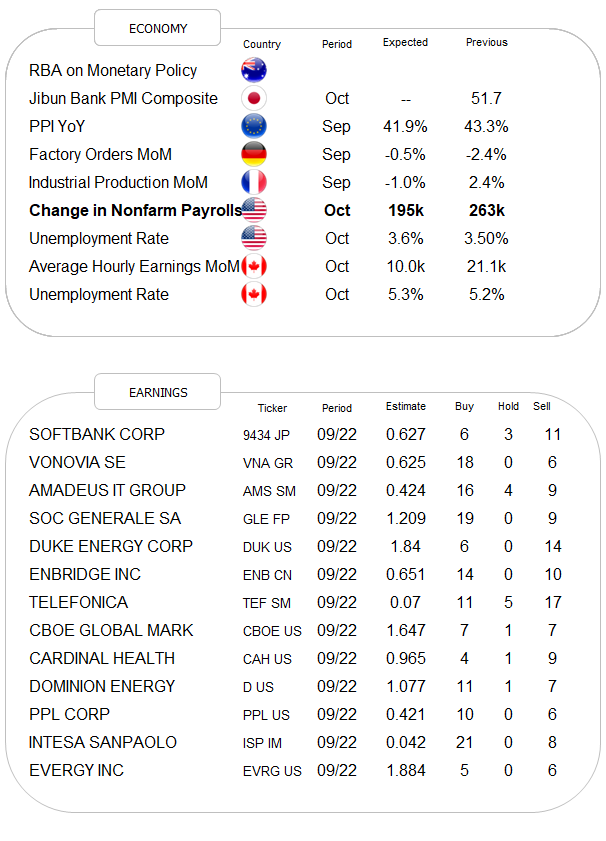
For today, all eyes of course on the NFP report (careful European investors: at 13:30 CET, not 14:30 CET), which could at least influence the session this afternoon. Though it does feel a bit decaffeinated this month….
Ok, time to hit the send button! Make sure to enjoy your Friday and your weekend, but above all, make sure to tune in Sunday evening for your weekly review, courtesy The Quotedian ;-)
Best,
André
CHART OF THE DAY
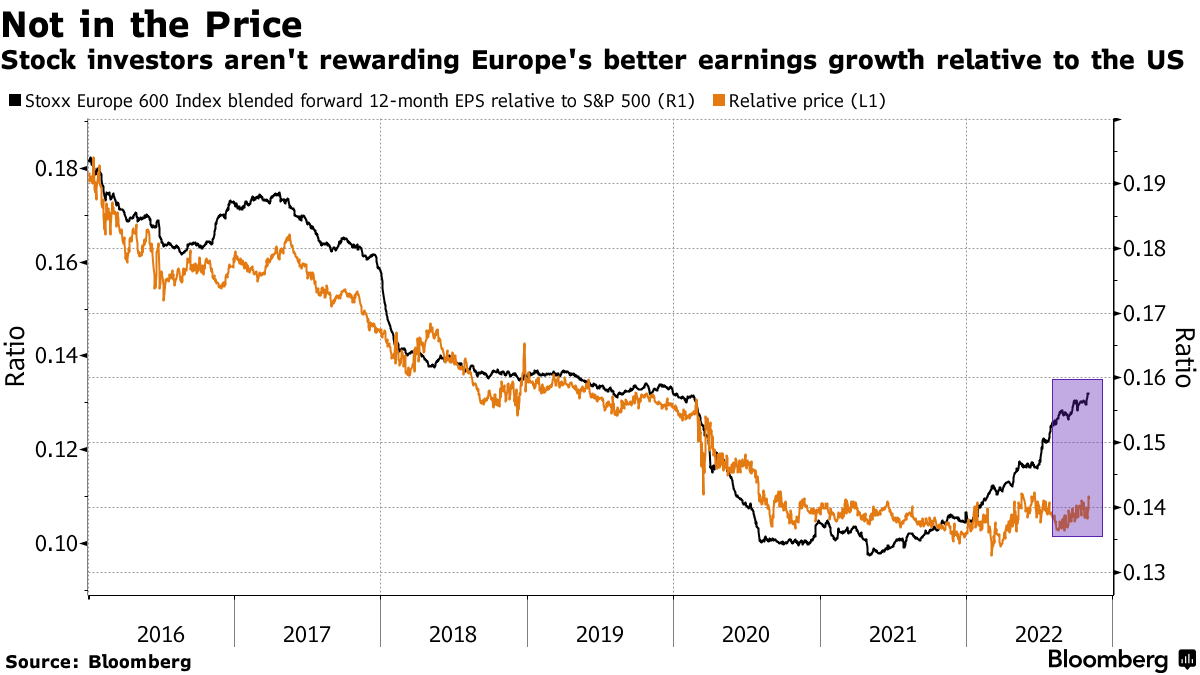
Here’s an interesting chart and comment from Bloomberg:
Despite more robust profits in Europe, the Stoxx Europe 600 trades at a 30% discount to the S&P 500.
According to Citi, it's in part because European stocks are pricing in a 15% contraction in earnings estimates, whereas US stocks are pricing in only a 5% drop.
That could leave US stocks vulnerable to a potential earnings disappointment.
Thanks for reading The Quotedian! Subscribe for free to receive new posts and support my work.
DISCLAIMER
Everything in this document is for educational purposes only (FEPO)
Nothing in this document should be considered investment advice
Past performance is hopefully no indication of future performance


I would say that the benchmark for this year should be inflation, but not every manager is going to be happy with my thought🫣