

European Values
The Quotedian - Vol VI, Issue 66 | Powered by NPB Neue Privat Bank AG


"Markets will do the most obvious thing in the least obvious way."
— Linda Raschke


Today’s QOTD describes pretty well what has been going on over the past few weeks and how market confuse the life out of us generally at all times.
Just when equity charts start turning up again, we get three back-to-back ‘wobbly’ sessions, and all our new fund bullish confidence vanishes in a puff of smoke.
Let’s see what has been going on …
Confused with all the market gyrations? Let’s figure it out together!

In that context, the first chart I will have to show you in the equity section is the one of bond yields …

… because, as described in the last Quotedian on Saturday: Macro Rules!

As seen in the chart of US 10-year treasury bonds above, yields topped out somewhere in the back half of August, which led to a decent recovery rally on equity markets. However, September came and the first four trading sessions in the month have seen yields shoot higher again, which in turn, is pressuring equity markets again.
A pretty strong deviation between S&P equity volatility (VIX - red line) and the volatility of the S&P equity volatility (VVIX - grey line) has been an early warning sign of a possible equity “correction”:

And suddenly the S&P 500 chart does not look that constructive anymore:

Whilst today the index started a VERY convenient rebound at the 20-day MA (blue), we probably should expect the following chart popping up at technical analysis shops and social media over the coming days:
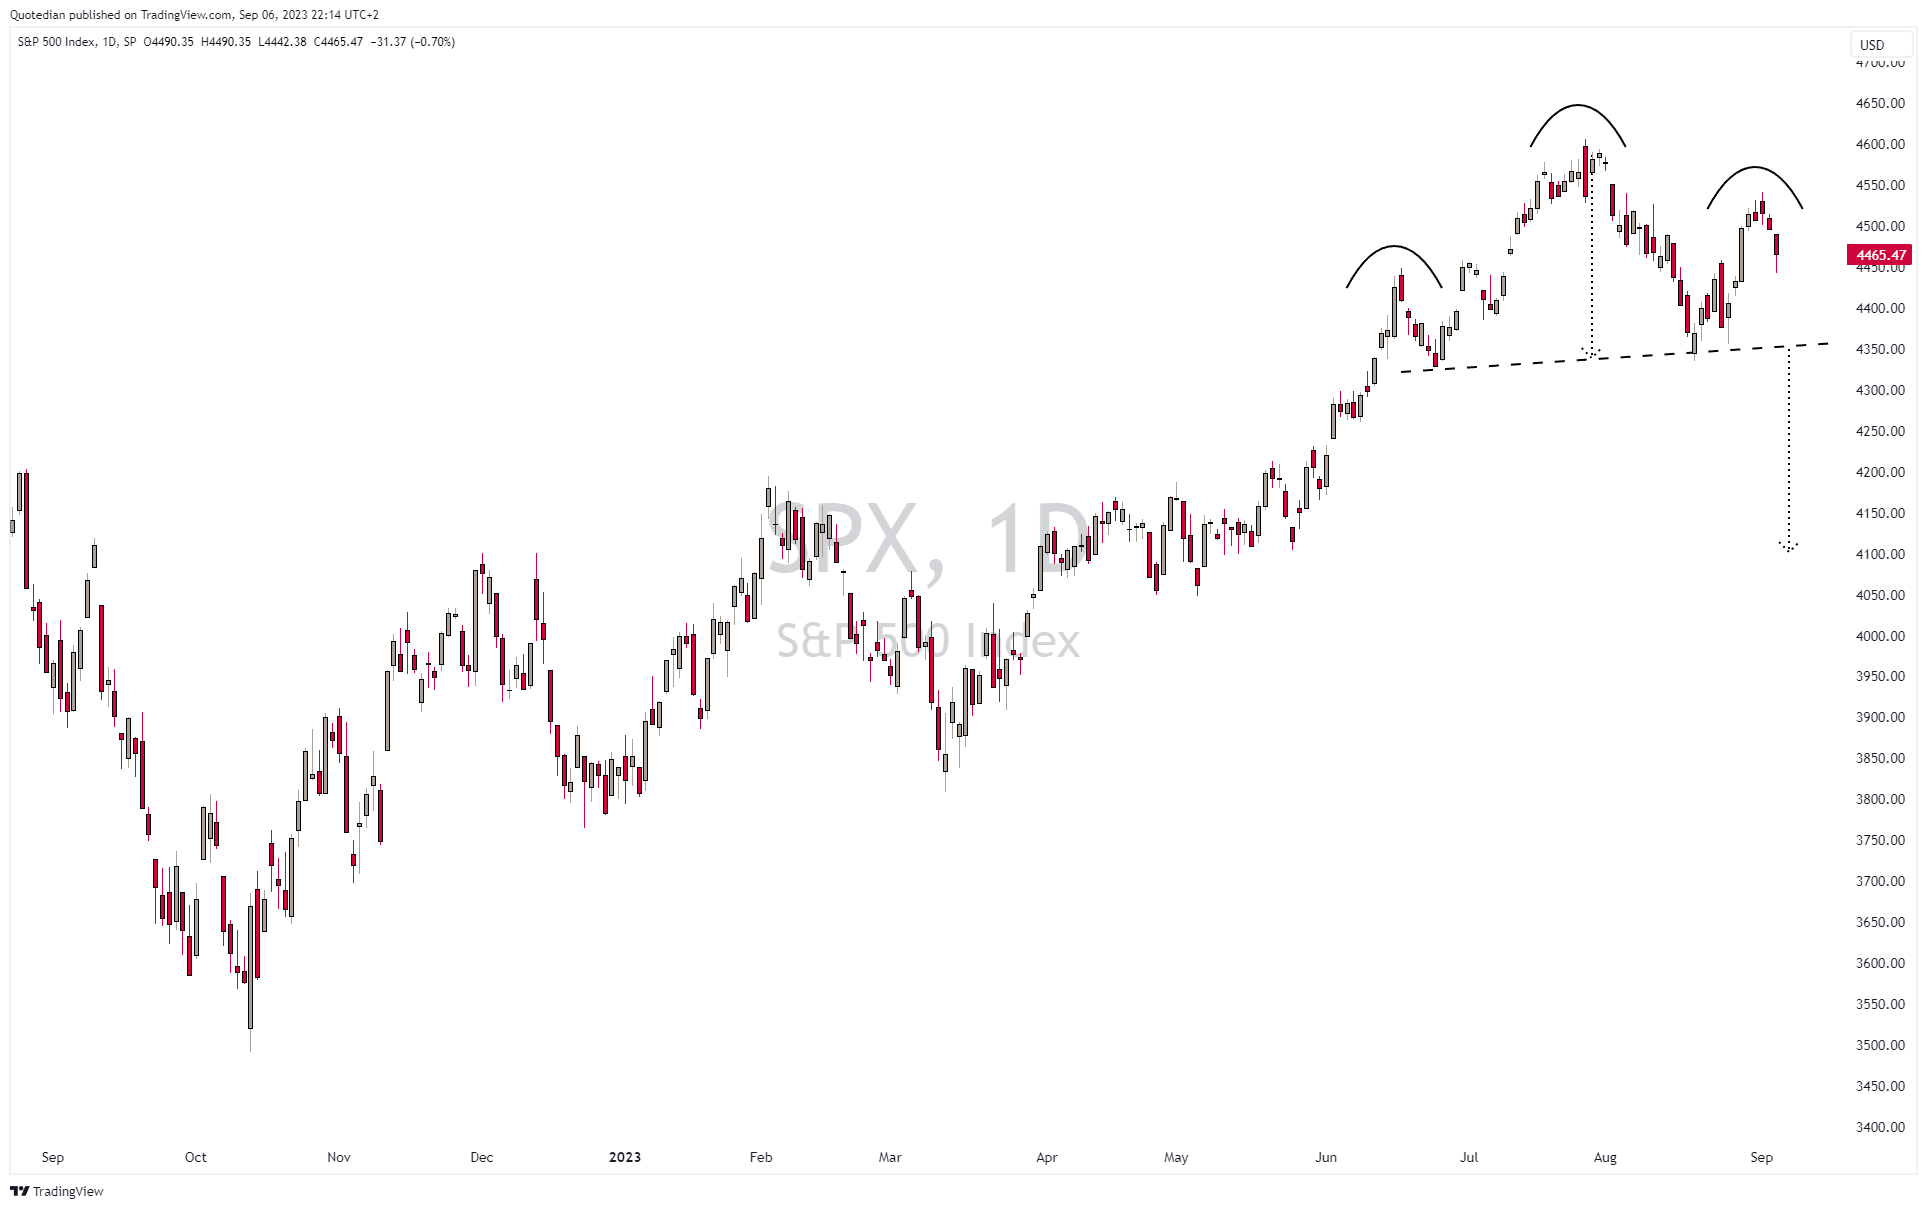
Indeed, a possibility. So, the scenario analysis is as follows:
A break of the neckline (2.5% from here), would imply a 6% additional downside
A close above 4,530 would negate the whole shoulder-head-shoulder pattern depicted above and send equities right back on the bullish path
Easy.
Back to yesterday’s session.
As mentioned, stocks started to rebound about mid-session to reduce its intraday drawdown of 1.2% to about half of that.
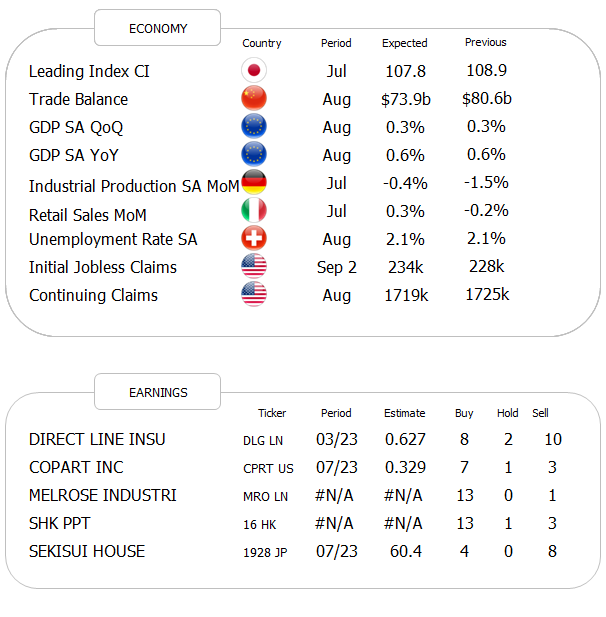
Nevertheless, market internals were weak, with only two out of eleven sector eking out small gains on the day and three stocks falling for every two advancing, leaving us with this market heatmap:

Turning to the early hours of Thursday trading, equity markets across the Asian continent are following Wall Street’s lead lower, with the notable exception (again) of Indian stocks, which are eking out a small advance. A slightly less bad reading of export numbers, hinting at that the worst may be over, was not enough to lift the CSI300, which continues to head lower in the final hour of trading:

European equity index futures suggest also a weak opening for our cash markets here in about an hour’s time.

We started equity observations with a bond chart, showing that yields had been nudging here and hence, exercising downward pressure on stock markets. Yesterday’s move up in rates was triggered by a stronger-than-expected ISM reading (, which together with a rising unemployment rate number last Friday, puts the Fed increasingly between a rock and a hard place.
Here’s yesterday’s intraday chart of the US 10-year Treasury yield:

Inflation expectation, derived via the 5-year/5-year inflation swap rate continues to drift higher on the back of this,

which continues to be in stark contrast to continued expectations by the shorter-term interest rates futures markets of a rate cut in early 2024:

Though admittedly, it seems increasingly that this later group “got it wrong”, as they continue to push the moment of a rate cut further out in time …

In currency markets, the Japanese Yen was of some focus yesterday, as first weakness in the Yen provoked some verbal intervention by the Bank of Japan/Ministry of Finance, which was later offset by a stronger ISM reading in the US (implying a wider interest rate spread between the two countries). All in all, it provoked some intraday volatility (falling line is a rising Yen and vice versa):

The Dollar itself in the meantime, as measured by the Dollar Index (DXY), has been breaking out of its multi-month trading range:

The advances for the Greenback should remain orderly, otherwise, other asset classes will start struggling.

In commodity markets, don’t look now,

but Oil (Brent) is suddenly trading above $90 again, making our several calls on higher crude and higher energy stocks looking pretty smart (blind chicken and corn come to mind):

Ok, with this, it is time to hit the send button. Have an excellent Thursday and see you tomorrow!
André

And so it happened! After LVMH (grey line) reached briefly as first European company a market cap of half a trillion US Dollars, it started going downhill from there.
Quiet the contrary happened to Novo Nordisk, maker of the new obesity drug wegovy. Their market cap has accelerated at LVMH’s peak and has now eclipsed it by nearly USD 40 billion as per yesterday’s close.

What is clear though, is that we Europeans value our beauty and appearance …
Stay tuned (or tune yourself, so to say).

Nearly there now!

Everything in this document is for educational purposes only (FEPO)
Nothing in this document should be considered investment advice
The views expressed in this document may differ from the views published by Neue Private Bank AG
Past performance is hopefully no indication of future performance
The price of oil, Il, that old fashioned, CO2 generating fossil fuel, is going to play a key role in next few months. I also am a buyer of the oil majors.