Famous Last Words
The Quotedian - Vol VI, Issue 69 | Powered by NPB Neue Privat Bank AG
"All the talk of us having a recession has vanished"
John Williams, NY Fed President, September 7, 2023
Today’s QOTD reminds me of March 2007, when (let me try to write this with a straight face …) Nobel Laureate Ben Bernanke …
Sorry, I start again …
Today’s QOTD reminds me of March 2007, when ex-Fed Boss Ben Bernanke said in his remarks to Congress:
“…the impact on the broader economy and financial markets of the problems in the subprime market seems likely to be contained.”
Let’s hope (and yes, hope is a lousy investment strategy) that Bernanke’s ‘Famous Last Words’ don’t repeat history with Mr Williams …
Looking for an investment team that helps you avoid repeating mistakes from the past through a sound money- and risk management?
Contact us at ahuwiler@npb-bank.ch
After Wednesday’s CPI number was, as it should be, much ado about nothing, I decided to skip yesterday’s letter. However, despite a heavy weekend travel schedule, and only if time allows, I will try to compensate you with a Sunday evening review of the half month just gone by. If not, the next letter will hit your inbox on Tuesday next week.
There is an old Wall Street adage saying that you should “never short a dull market”. And dull it had gotten recently. The S&P 500 for example had been trading in a slightly more than 1% range since (US) labour day:
This dullness was not of course not only reflected on the chart of the index, but very clearly visible in volatility measures. The VIX for example, dropped this week to its lowest since a pre-pandemic January 2020:
Hence today, Mr Market, probably happy with CPI, PPI, Retail Sales and the ECB’s rate decision (a 25 bps hike) finally out of the way today, started drifting higher to show its best day since August 29th.
However, it was not quite enough to lift above our upper ‘line in the sand’, but we are now clearly skewed to a positive outcome:
This positive skew does not come only from the distance measured to upper resistance and lower support on the chart above, but also from smashingly good market internals in Thursday session, where all eleven economic sectors closed up on the day,
but the advancing-to-declining stocks ratio was a very healthy 6:1, leaving us with this sea of green on the S&P market carpet:
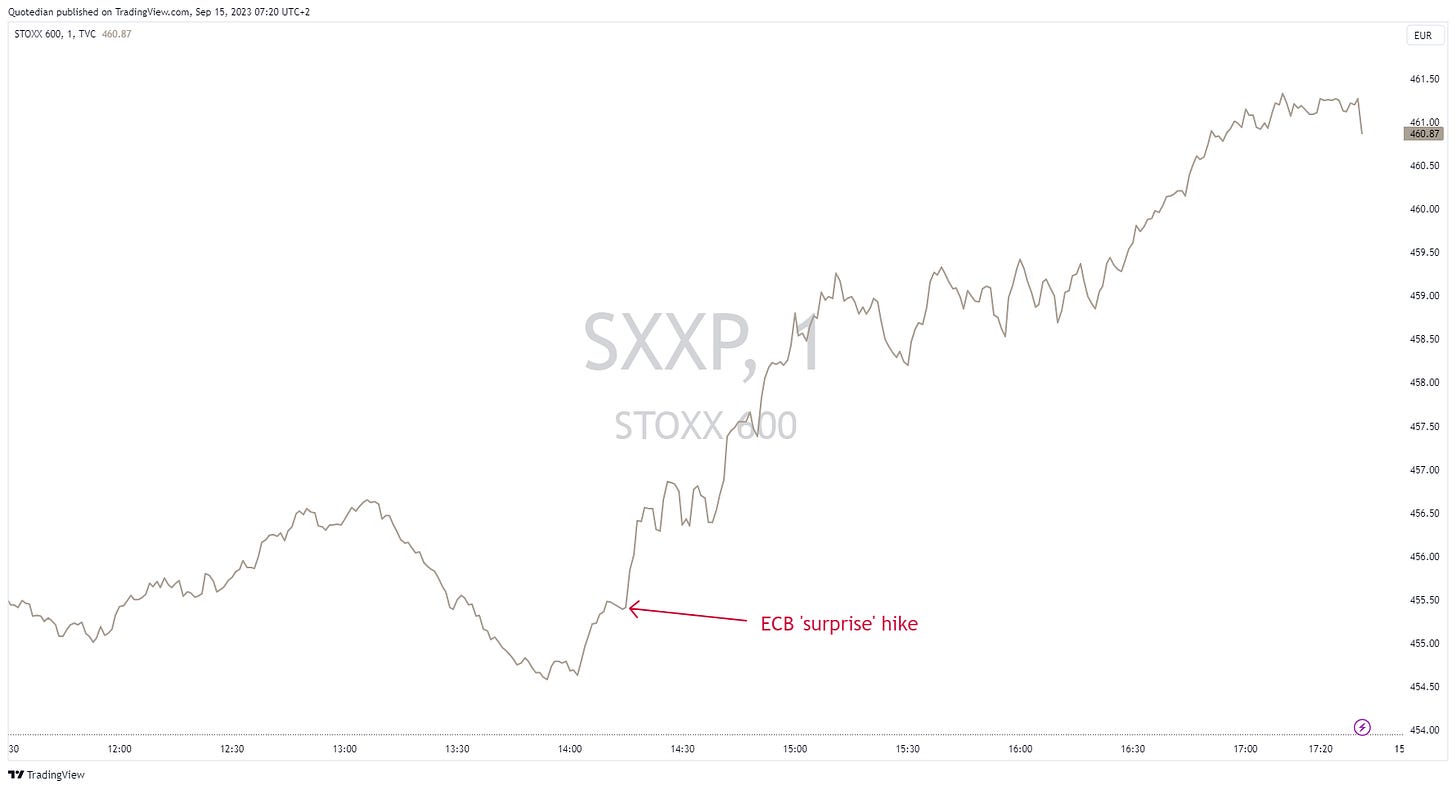
But let’s go back to Europe’s Thursday session for a moment a reconsider that ‘unexpected’ rate hike:
As we can see, economists surveyed by Bloomberg as a group did indeed not expect this rate hike. However, we avid Quotedian readers noted on Tuesday in Price Matters, that the ECB’s comments on Monday night regarding 2024 inflation expectations were actually a ‘forward 'guidance’ to yesterday’s hike, i.e. no surprise.
So, what did the stock market do on a surprisingly hawkish ECB? Go up of course!
The assumption, I would assume (pun?), is of course, that this may have been the last hike of this cycle. To which the Taylor-Rule model applied to the Eurozone would say NO, but we leave that story for another day:
Anyway, on the daily chart, yesterday’s 1.5% rally for the STOXX 600 Europe index looked very constructive, with prices being lifted out of a consolidation triangle just at the right point within the apex:
This early Friday morning markets across the Asian continent are seeing a healthy rally too, led by decent advances in Japan and Hong Kong, and China Mainland stocks being the exception, recording a small retreat.
European and US index futures would suggest more fireworks to come once Western markets open for cash trading. One little caveat to today’s session is that we have a triple (or quadruple) witching day, i.e. many futures and options coming to expiry. Maybe this has lost some importance with the rise of 0DTE options, but still, let’s keep it in mind…
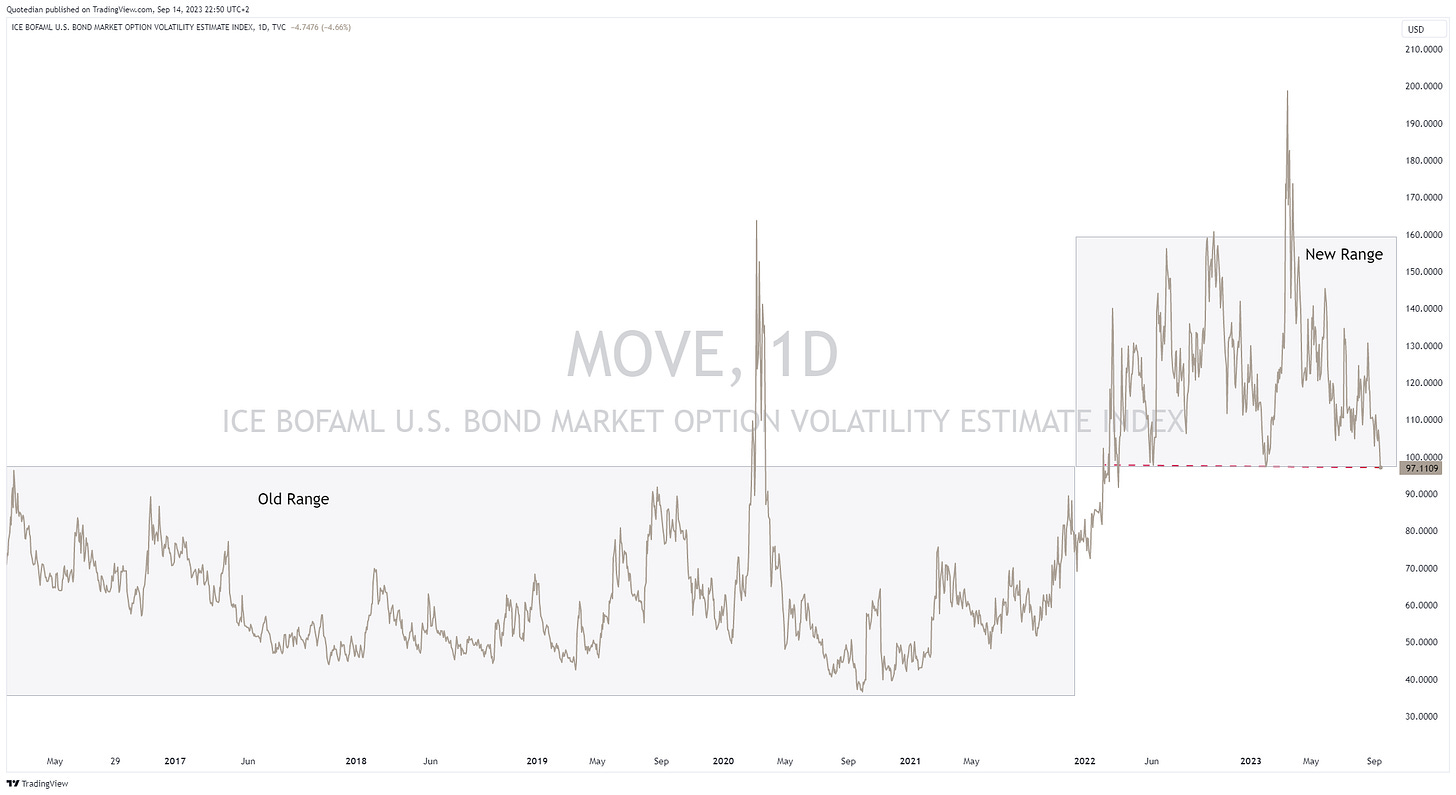
Looking at fixed-income markets now, we notice that not only equity volatility has been relaxing recently, but interest rate volatility, as measured by the VIX-equivalent for bonds (MOVE), has been moving lower too:
We defined the new volatility regime sometime last year and it is now being challenged again - third time lucky?
However, unlike for equities, lower volatility does not necessarily mean a tailwind for bond prices. Rather, yields continued to be stuck for a seventh straight session in a very tight range:
As a matter of fact, comparing the inverted MOVE index (RHS, grey line) to the S&P 500 (LHS, red line), is probably the better fit and would mean equities can indeed continue to drift higher:
In any case, it is noteworthy that despite yesterday’s equity rally, bonds actually sold off slightly, which on the popular iShares 20+ Treasury bond ETF (TLT) looks like this:
For now, still holding above key support …
Credit spreads (not shown) unsurprisingly narrowed yesterday, given the rally going on in equity markets.
In currency markets, the US Dollar had another decent session yesterday, and the USD Index (DXY) chart looks like there is more upside ahead for the greenback:
In the chart above, the DXY had moved above key resistance (black dashed line) at 104.40 and subsequently retested that same line now successfully as support
We recently had a discussion about the ‘bombed’ out Japanese Yen, and in that context, I found the following series of charts from Alpine Macro as interesting.
Ideally, we would see a blow-off top and then include a long JPY on our trad blotter.
In commodity markets, this headline hit the wire about mid-session yesterday:
This of course plays very well into our overweight energy stocks idea, and indeed did that segment as measured by the SPDR Energy ETF (XLE) gain another 1.3% yesterday.
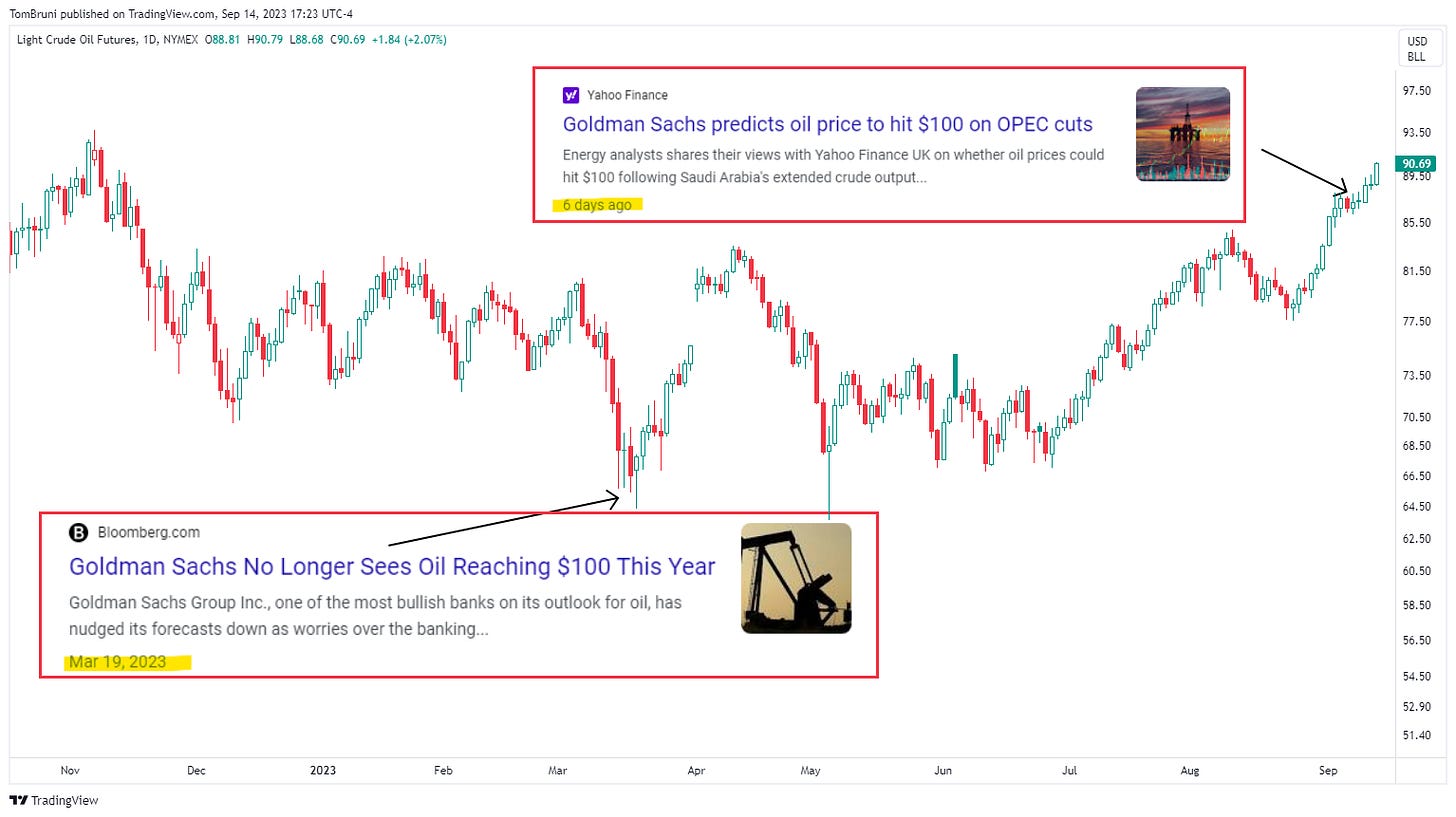
HOWEVER, whilst the chart picture remains very bullish (as do we!), we may be closing in on a ‘pause’, as the following graph of WTI with a simple overbought/oversold indicator (RSI) would suggest:
Adding fuel to that pause theory, could be the following chart, highlighting some of Goldman Sachs’ recent calls on the black gold:
Anyway, time to hit the send button. You make sure to enjoy your weekend and see you either Sunday evening/Monday morning or Tuesday.
So long,
André
Just a chart quickie today, as I am heading off into an early Friday morning meeting.
The chart below shows how much real policy rates differ between different countries (admittedly this does not include yesterday’s ECB hike):
Still a beta version …
Everything in this document is for educational purposes only (FEPO)
Nothing in this document should be considered investment advice
The views expressed in this document may differ from the views published by Neue Private Bank AG
Past performance is hopefully no indication of future performance


