Full Moon
The Quotedian - Vol V, Issue 125
“Be the moon and inspire people, even when you’re far from full.”
— K. Tolnoe
DASHBOARD
AGENDA
CROSS-ASSET DELIBERATIONS
Today’s Sunday edition is yet another piece of labour of love ;-) and has been under construction since Friday. Hence, be warned; this will make for a longer letter. Besides our usual weekly review charts and stats, I’ll also throw in a couple of charts I have been accumulating throughout the week. So, here’s your last chance:
Ok, for the three of you who stayed to read on, let’s get started!
Starting with equities, it was a good week for stocks, with the MSCI World up for the first time after three weeks of consecutive losses. For major indices the week looked as follows:
In terms of sector performance, the week looked as follows:
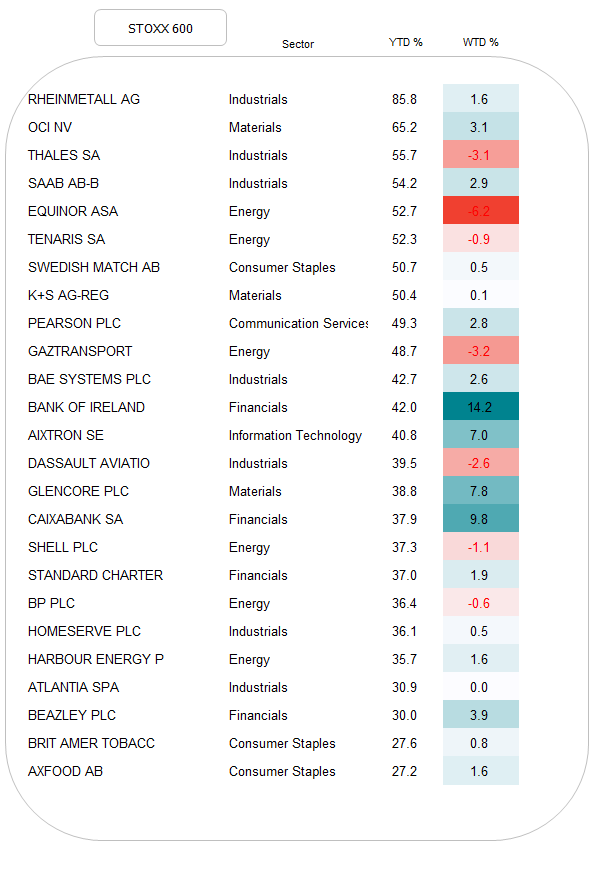
And let’s get one more step granular, by looking at what the best-performing stocks in Europe and the US so far this year have done over the past five days. Of course, given the sector performance above, we should see quite a few energy stocks in correction mode:
Quick Poll. Do you like to see those Top 25 year-to-date performers on a weekly basis?
Within my continued cautious framework I got suspicious that we might be due for a short-term bottom and possible bounce a bit over a week ago, and I still could bite myself for not having shared the following chart I had already prepared:
As you know, magazine covers, major newspaper headlines, big guru calls and CNBC’s “Markets in Turmoil“ are all pretty reliable contrarian indicators. We got the Guru (Jeremy Grantham) call AND the major newspaper (FT.com) headline both on September 1st (as seen above), which was a good indication of short-term bottom possibly at hand. But I chickened out of printing the chart due to the major reversal candle the very next day. Ah, nobody said it’s gonna be easy!!
Important note: this is not to ridicule Jeremy Grantham for whom I have the highest respect, nor his piece which is excellent and unfortunately probably even correct. It’s just about timing and especially sentiment.
Talking about sentiment then, it is not only retail investors’ sentiment that has got overly bearish again, but most Wall Street strategists are now singing along the tune of some Grizzly Bear Song too! Unfortunately, I do not have a graph or stat of the growing bear camp, but I will try to find one. Anecdotally, however, I know that long-standing stock market bear Worried Wilson (Mike Wilson at MS) has suddenly got a lot of sympathizers … the perfect set-up for the next “most-hated stock market rally ever”. Let’s see.
On our tactical chart, where I highlighted a possible inverted shoulder-head-shoulder pattern a few Quotedians ago, it seems that we have at least another 3-5% upside (>4,200ish):
Turning to fixed income markets, the 5-day performance table below clearly shows that it was a good week to carry credit risk, but less so for having interest rate risk on your books:
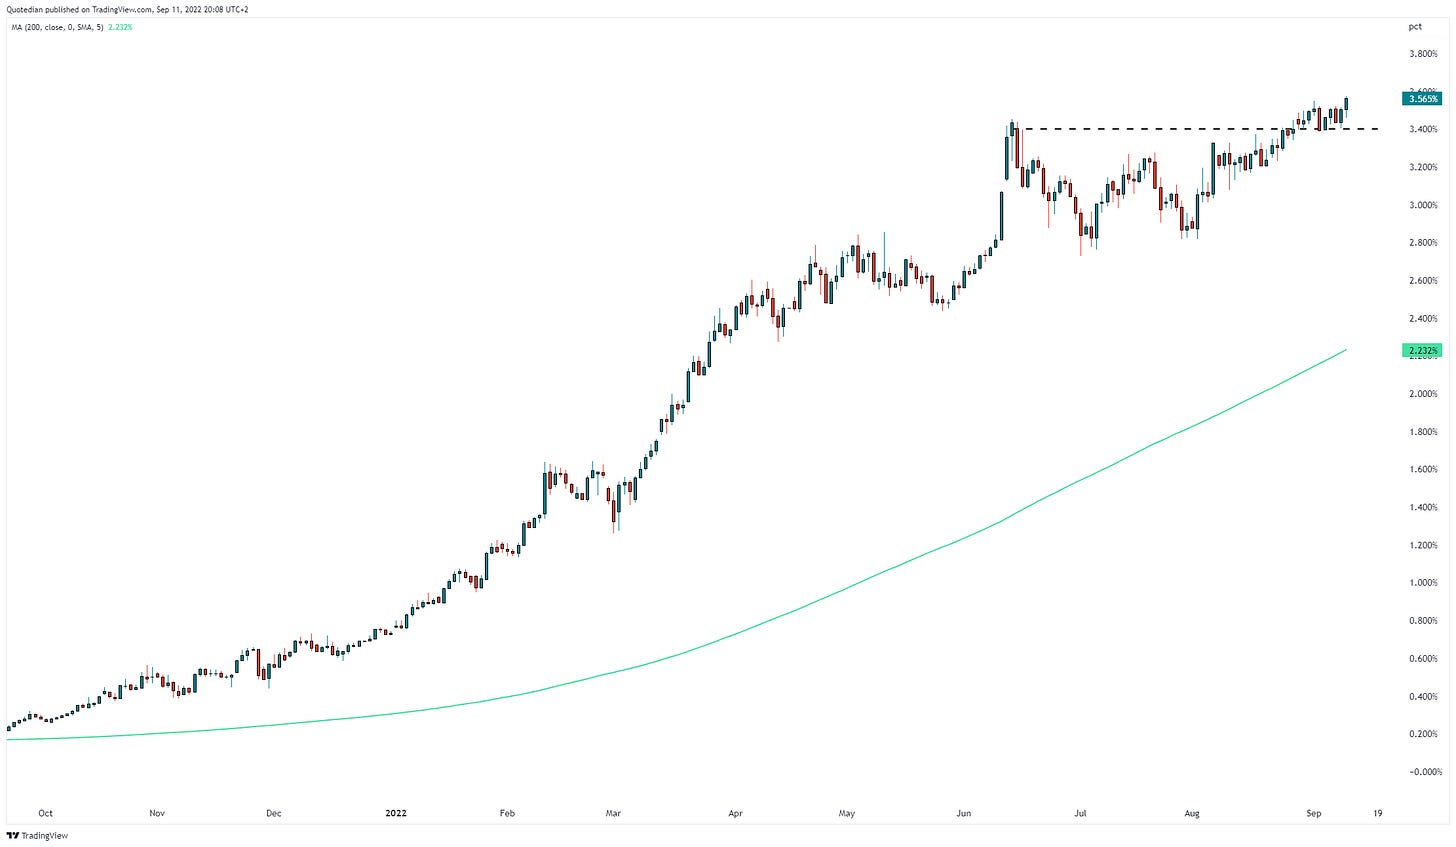
Despite some consolidation activity over the past two or three days, the 10-year US Treasury benchmark yield continues within its steep uptrend channel:
Despite shorter yields breaking to new recovery highs,
did the bear steepener between 10s and 2s somewhat revert in the past session, though the overall steepening process remains in place for now:
Thanks to the equity bounce, credit spreads tightened, and in an encouragingly bullish sign, high yield bonds (HYG) are for now confirming the jump in stocks:
The long-term trend for yields remains pretty clear:
European and UK yields project the same picture as their US cousin, though the uptrends are getting increasingly stretched, with 10-year yields in both economic areas being in technically overbought territory on all three time horizons (daily, weekly, monthly). Some lower-than-expected inflation readings over the coming weeks could lead to a violent correction:
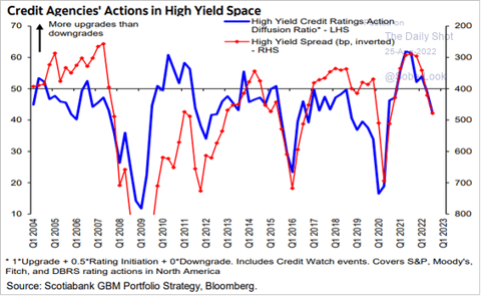
To finish off the bond section, here’s an interesting chart from Scotiabank, showing that rating agencies have been busy downgrading ratings of debtors:
Alright, moving swiftly into currencies, the US Dollar has shown some signs of taking a breather this week:
But overall, the story of “one currency to rule them all” continues. Here’s the chart of the US Dollar index (DXY):
Not very often over the past ten years has the USD been technically overbought as now, but “overboughtness” is not an absolute trading signal. However, recently observed divergence (arrows) is of interest. The chart below shows the DXY in the upper clip and the %-difference between the DXY and its own 200-day moving average in the lower clip:
The British Pound hit a multi-year low last week, but may have found some support on the 2020 COVID panic low:
Maybe it (sold off/found support) because of the new PM or the new King or maybe simply because the trend for the Quid has been down since like ever:
My long-term cycle model, of which I will show an updated version next week, still points to lower prices ahead, though short-term a bounce should be on the books.
And apropos new King, maybe having six ex-Prime Ministers alive was just too much to handle for Lilibeth:
Ok, onto commodities and we’re done! Here is last week's performance:
Overall actually not a bad week for commos, but finally some mean reversion in natural gas prices.
But looking back over the past three months, it is difficult to give rising commodity prices as an excuse for elevated inflation readings:
In general, commodity shorter-term trends remain extremely challenging to read, but generally, I think it is safe to assume that the general price direction will be UP over the coming years, hence BTFD should remain the mindset. Why? A subject for one of next week’s Quotedians…
Nevertheless, some charts here:
Russian gas supply to Europe in a picture:
This one would suggest that the commodity correction still has way to go:
And last but not definitely not least, here is a subject we will need to talk about and most of you will not like it:
European carbon emission credits are plummeting for no apparent reason. Is the market sniffing out a reversal to the climate efforts of the past decade? Perhaps.
Ok, enough for today. A big thank you to all three of you who read right to the end.
Enjoy the remaining minutes of your Sunday and if you are asleep already and read this on Monday … Happy Monday!
André
CHART OF THE DAY
After so many potential Charts of the Day in the Deliberations section, I will not torture you with even more graphical shock and awe. Rather, let’s lighten stuff up a bit, after all it’s Monday tomorrow (insert devilishly smiling emoji here).
First, I would agree here:
This made me LOL after the ECB meeting (Lagarde-huggers please skip):
This is surprisingly true:
And this is worryingly true:
Thanks for reading The Quotedian! Subscribe for free to receive new posts and support my work.
DISCLAIMER
Everything in this document is for educational purposes only (FEPO)
Nothing in this document should be considered investment advice
Past performance is hopefully no indication of future performance


