

Gravity
The Quotedian - Vol VII, Issue 11 | Powered by NPB Neue Privat Bank AG


"Parabolic advances usually go further than you think, but they do not correct by going sideways."
— Bob Farrell's Rule #4


“Trees don’t grow to the sky” is a German proverb and often used by financiers to warn that there are natural limits to upward growth.

In these times of meme stocks, momentum investing and easy access to markets, the proverb often goes temporarily forgotten. And that temporarily can get quite long and very painful for the silent observers at the sidelines (aka the non-participants).
So, we constantly are torn between “I will buy the next correction” and then “that was the top, I knew it”.

Successful investing is hard. Let us help you.

Contact us at ahuwiler@npb-bank.ch
The introduction to this letter should not be considered a bearish one. For the time being, the burden of the proof is the bears and so far they have failed miserably at providing any evidence for their case.
With this said, let’s start our usual deliberations of the different asset classes and look at some of those “gone parabolic” asset prices.


Let’s get the most bearish stuff right out of the way.
In the COTD-Section of the previous Quotedian, I showed the following magazine cover, arguing that this in fact was NOT a bearish contrarian signal:

I continue to argue the same.
However, unfortunately, we got the following Barron’s cover over the weekend:

Not to be ignored! :-(
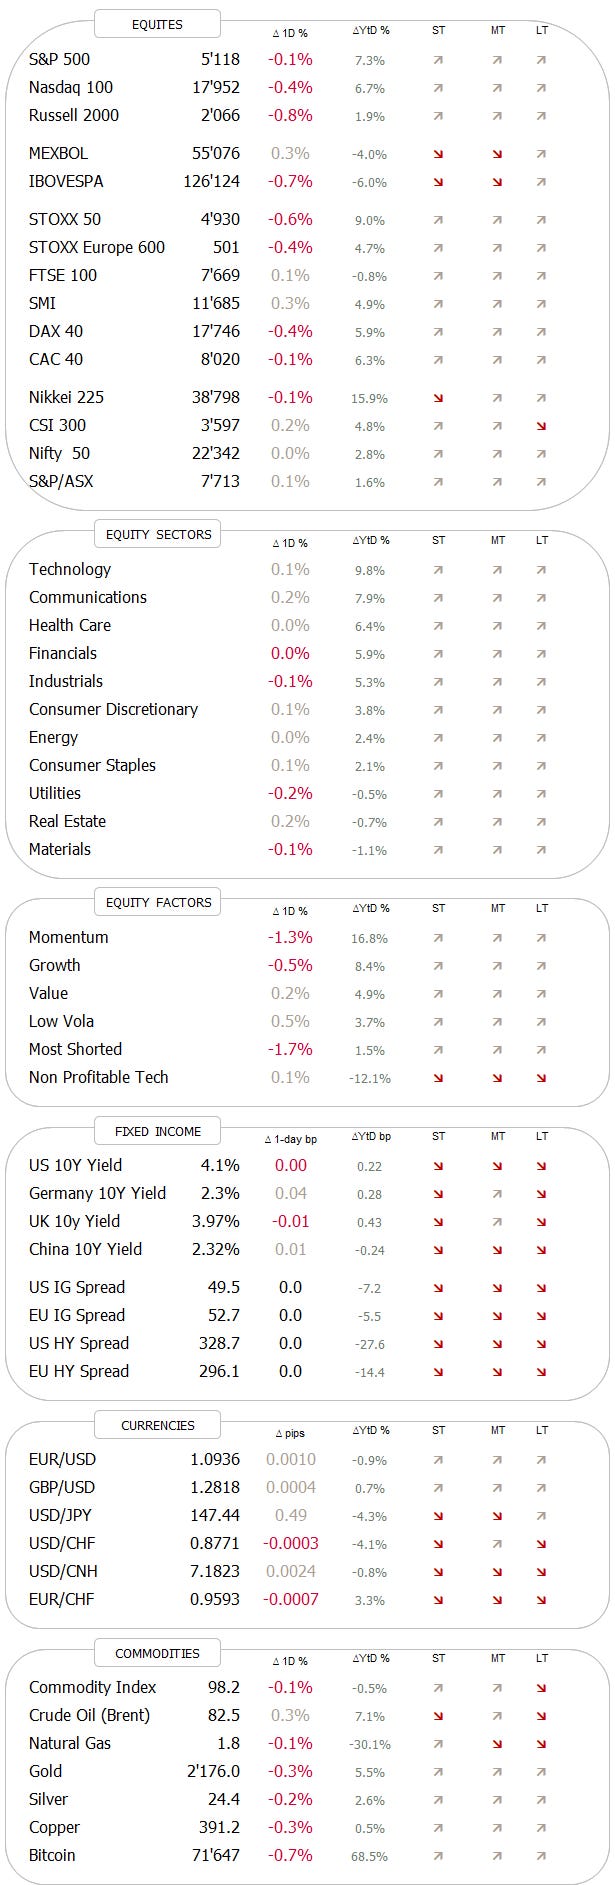
Ok, let’s start our “tour-des-charts” by having a look at the S&P 500:

Short-, intermediate- and long-term uptrends all alive ‘n kicking!
Since the market bottom on 23/10/2023, the S&P 500 equal-weight (RSP - red) has NOT been lagging the market-cap weight version (SPY - grey):

Hence, breadth has been broad.
On Friday, the S&P closed down 0.65% and yesterday Monday, down 0.15%. The following table shows how many stocks hit a new 52-week high and how many a new 52-week low on those two days

As I said before, the burden of the proof is on the bears.

The Nasdaq-100 has a mini double-top in place (red arrows), but so far has held within the short-term uptrend channel. The divergence between price and momentum indicator (blue arrows) could be of more concern, but mind you, the index could correct more than 10% and still trade above the 200-ay moving average:

Now, let’s have a look at some of those stocks defying gravity…
… and how could we not start with Nvidia (NVDA) …

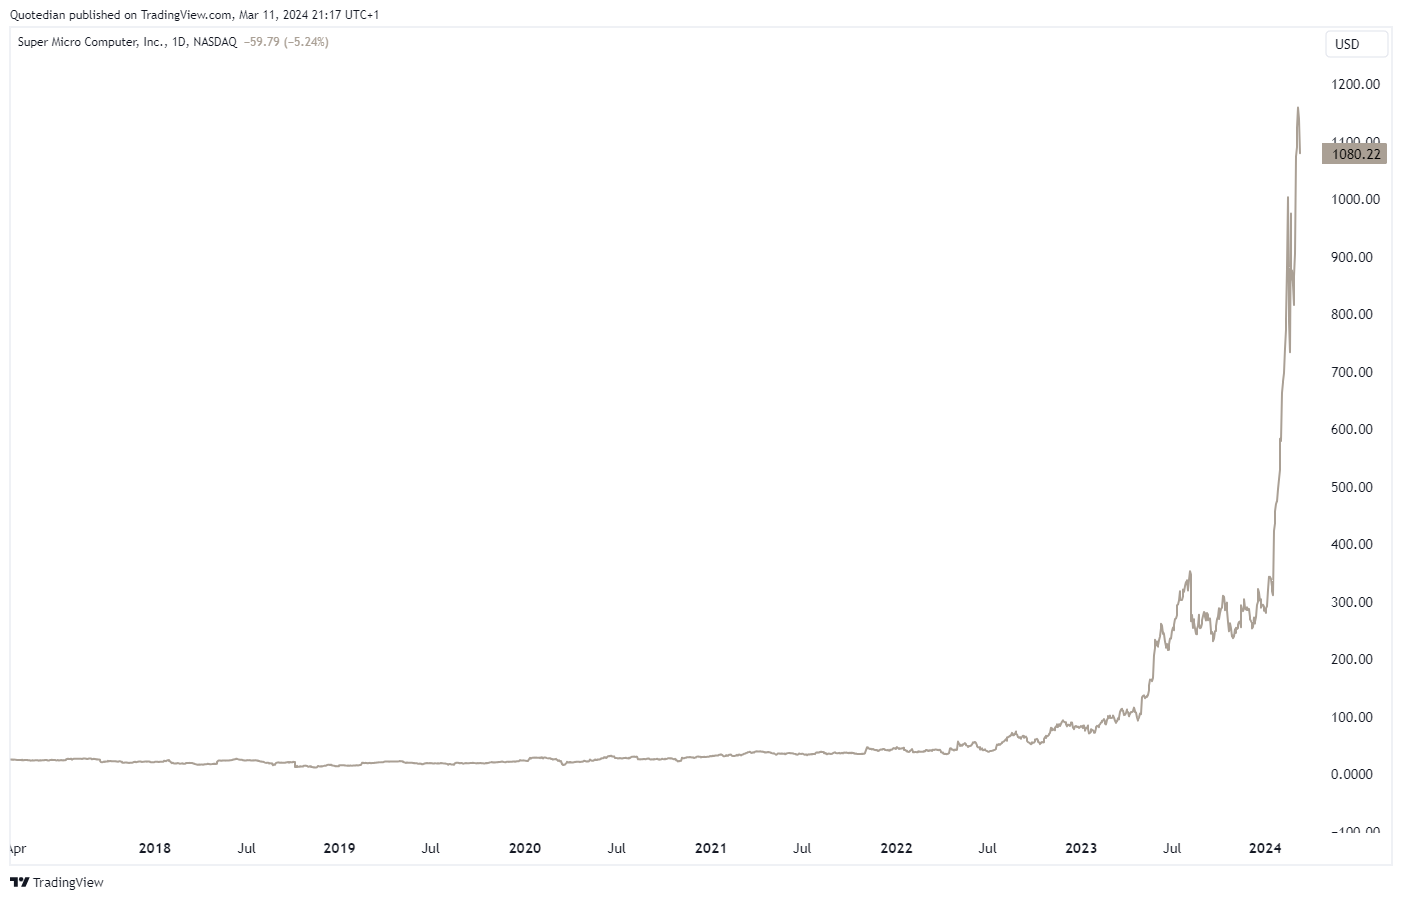
… and follow through with Super Micro Compters (SMCI):
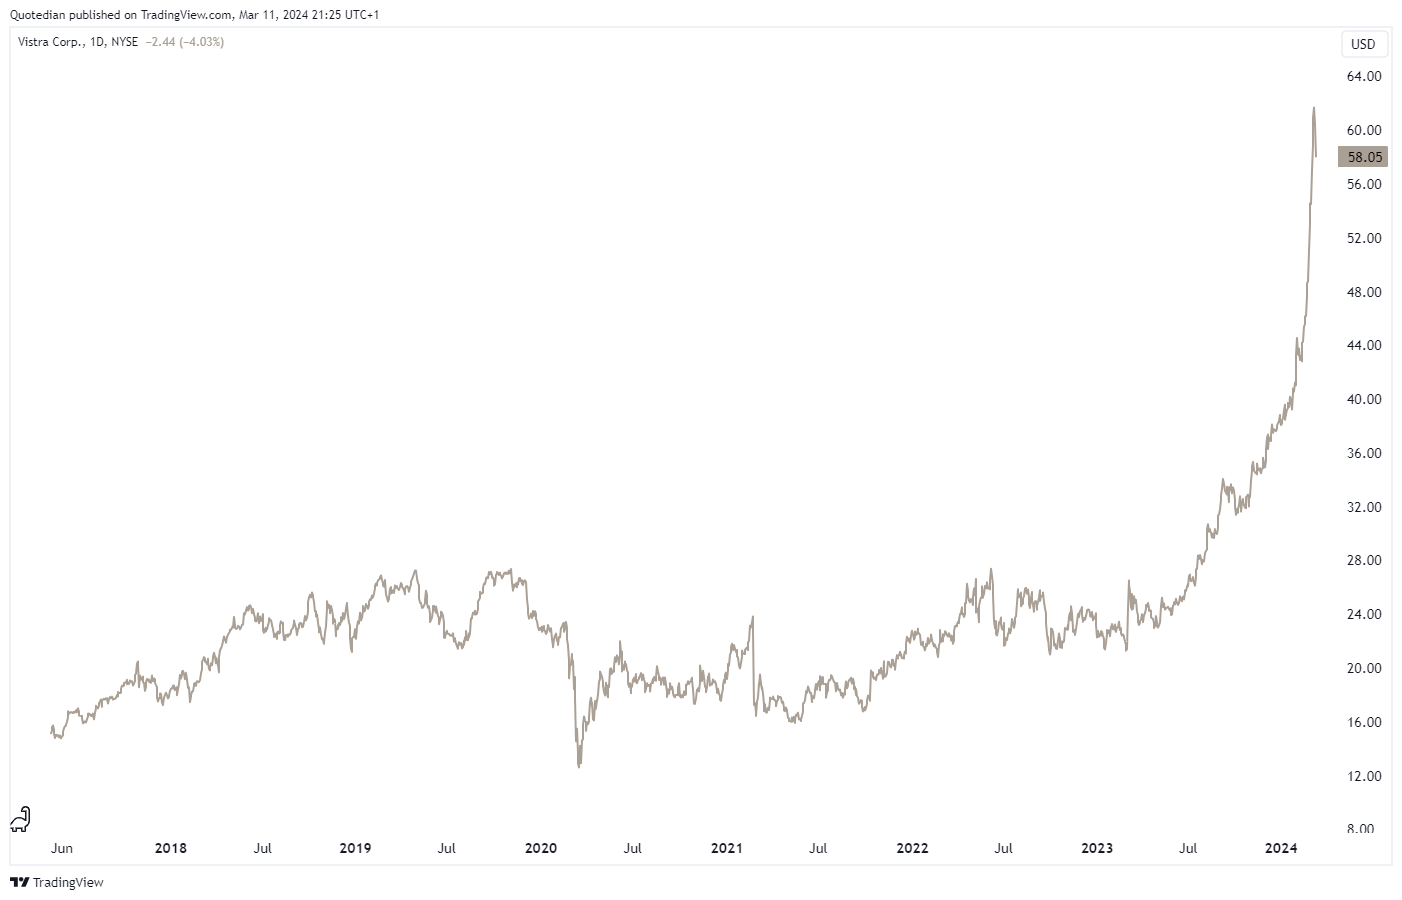
But it is not only tech stocks that have gone ballistic. Here are two utility stocks:
Vistra …
... and Constellation Energy:

Even cloth retailer Abercrombie & Fitch (ANF) joined the “to the moon” party:


But not only US stocks are reaching for the sky. Here is Danish healthcare company Novo Nordisk of Wegovy fame:

Talking of Wegovy, the following headline hit the wire late last Friday:

Though admittedly the stock has given back previous gains since then, in some kind of “buy the rumour, sell the fact” move.
European stocks (SXXP) continue in a well-defined uptrend too (the black dashed line is the previous 2021 ATH):

Turning to Asia, Japanese stocks (Nikkei 225) have corrected back to the previous (1989) all-time high. This may or may not serve as support now:


‘Parabolic’ seems to be the modus operandi since 2020 for the Indian stock market, with only a short break courtesy COVID:


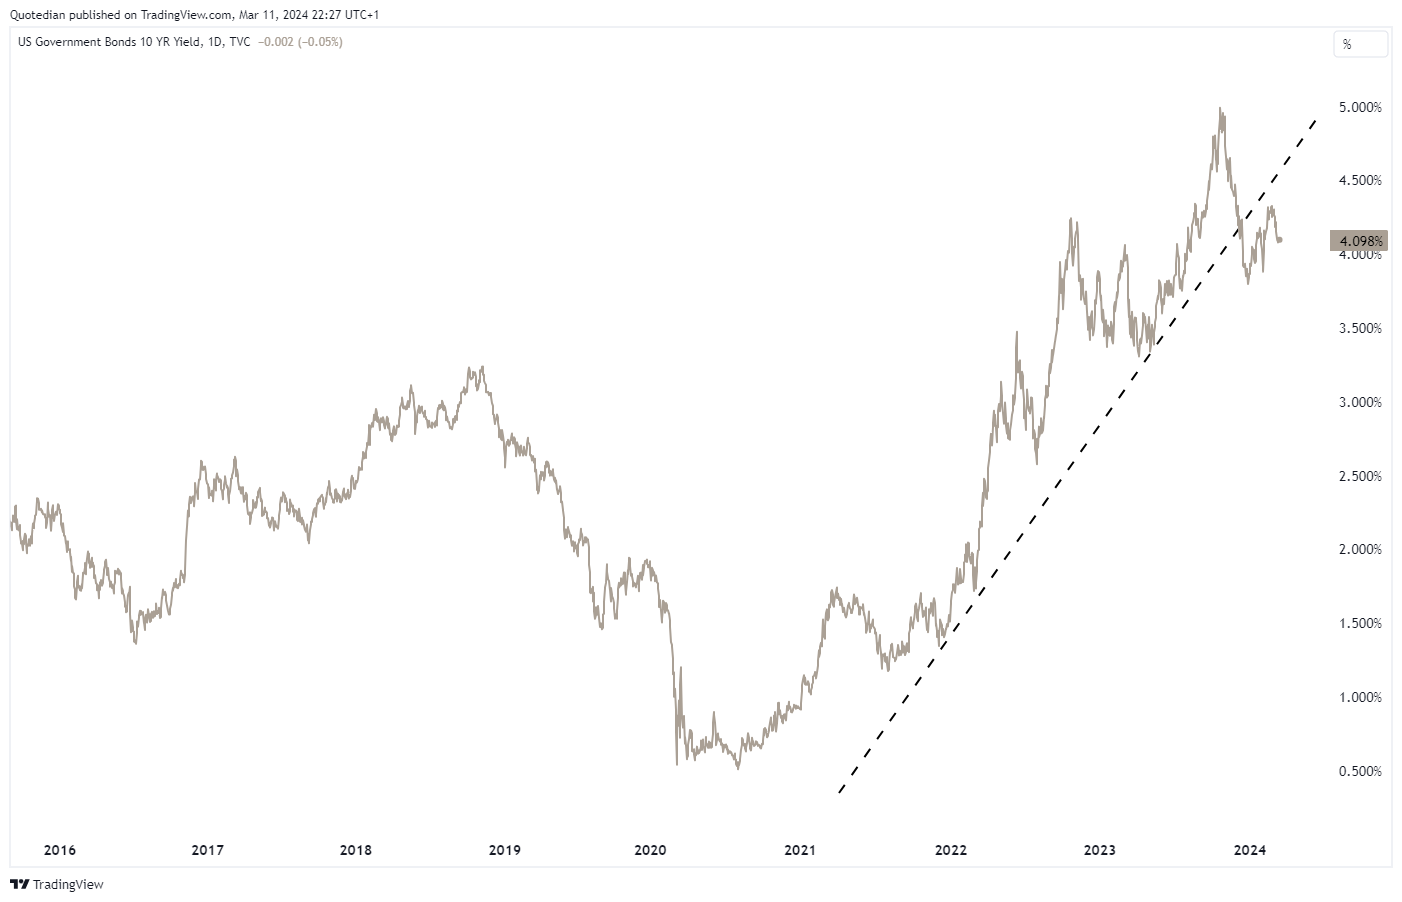
In the fixed-income space, yields have been surprisingly soft for the past two weeks. Here’s the US 10-year yield:

Zooming out on the same chart, we see the parabolic rise in yields has halted - for now:
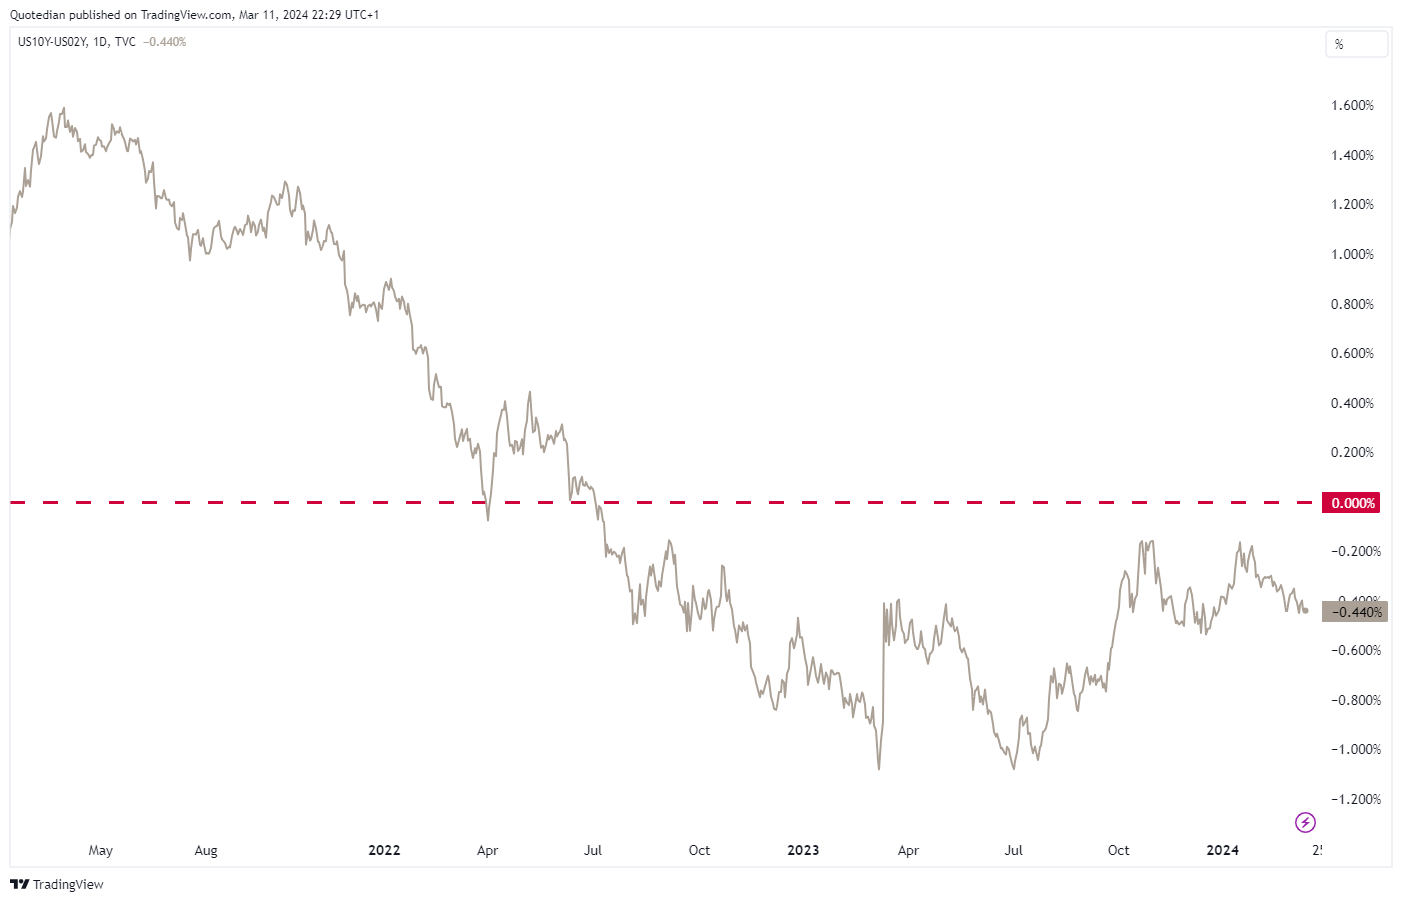
The US yield curve (10y-2y) remains inverted:
The Fed is now expected to cut four times this year, which is down from six expected cuts at the end of December:

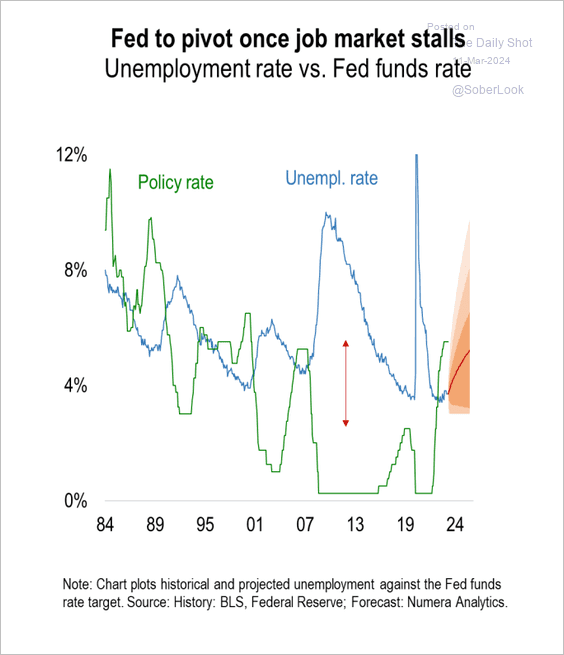
The following chart from Numera Analytics suggest these cuts may indeed be real, if their trajectory for the unemployment rate to reach 5% next year indeed materializes:
Will today’s US CPI number give any clue on the future path of Fed Fund rates:

I have my doubts it will, but then you already know I am not a great fan of this laaaaaging indicator.
European rates, proxied via German yields, have been softening too. Here’s the Germany 10-year Bund:

Have Swiss yields been showing the way?


In the FX markets, USD/JPY, which remains our main focus,had gone parabolic twice over the past three years:

But as the BoJ (Bank of Japan) is about to end decade-long ZIRP and YCC policies, a reversal could lie ahead. Watch that 200-day moving average:

One currency chart that took me a bit by surprise is the one of the GBP/USD, where the good old Pound has been creeping higher over the past weeks, taking out some important resistance along the way:

BUT…
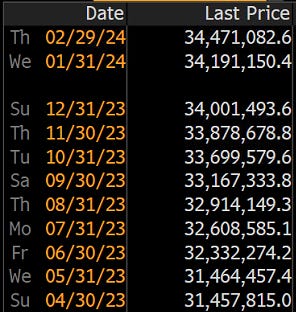
if today’s subject is that of gravity, parabolic moves and trees growing into the sky, we need to talk Bitcoin of course. I find Charlie Bilello’s table fascinating below, even more so as it is already out of date one day after release, as Bitcoin took out the $72k milestone too in the meantime:

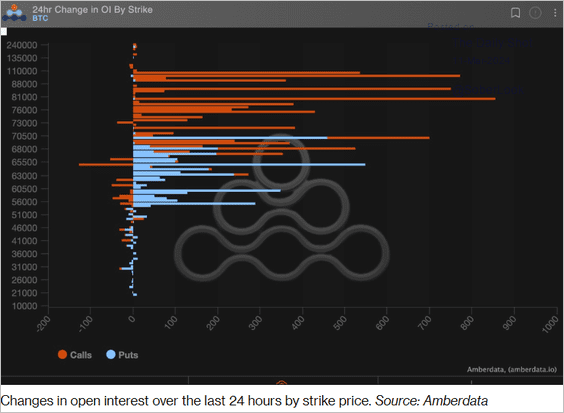
The following table of Open Interest on Bitcoin options shows there’s an active interest (pun intended) for $100,000 call options:
Finally, here’s the chart of the cryptocurrency itself - the mother of all parabolas, so to say:


Running out of time, let’s just have a look at Gold in the commodity section, which has been on a tear, reaching a new all-time high. The best thing about it? It has received comparatively little attention so far, which would suggest more upside head:

Even Gold stocks (GDX- red) have only just received the memo:

Finally, I find this chart fascinating too, showing the gold adjusted for inflation (red) has not quiet yet reached an all time high:


Time to hit the send button, but make sure to check out the COTD below - if you do not suffer from vertigo, that is.
Take care,
André

Here’s one more chart that is slowly but very surely going parabolic:


Yes, indeed, US Total Debt. Any form of fiscal discipline seems to have been declared illegal, as both parties find it seemingly totally ok to spend non-existing money “to the moon”.
The current rate of adding a trillion to total public debt is less than 100 days:
As a direct consequence, interest payments of the US Federal Government has increased to over $1 Trillion. That’s a 98% “rally” in three years:

Let. That. Sink. In.
It will not end soon, but it will end and it will end in tears.

Everything in this document is for educational purposes only (FEPO)
Nothing in this document should be considered investment advice
The views expressed in this document may differ from the views published by Neue Private Bank AG
Past performance is hopefully no indication of future performance