Halo Effect
The Quotedian - Vol VI, Issue 64 | Powered by NPB Neue Privat Bank AG
"Never regret thy fall, O Icarus of the fearless flight, For the greatest tragedy of them all, Is never to feel the burning light."
— Oscar Wilde
Last week the hottest stocks since Nvidia - namely Nvidia - reported another set of blowout earnings based on record orders for their AI H100 chipset, amongst other things.
The market did a quick “buy the rumour, sell the fact”, which looked like this on a zoomed-in daily chart:
Quite a crazy move for a USD 1.2 trillion market cap stock, no?
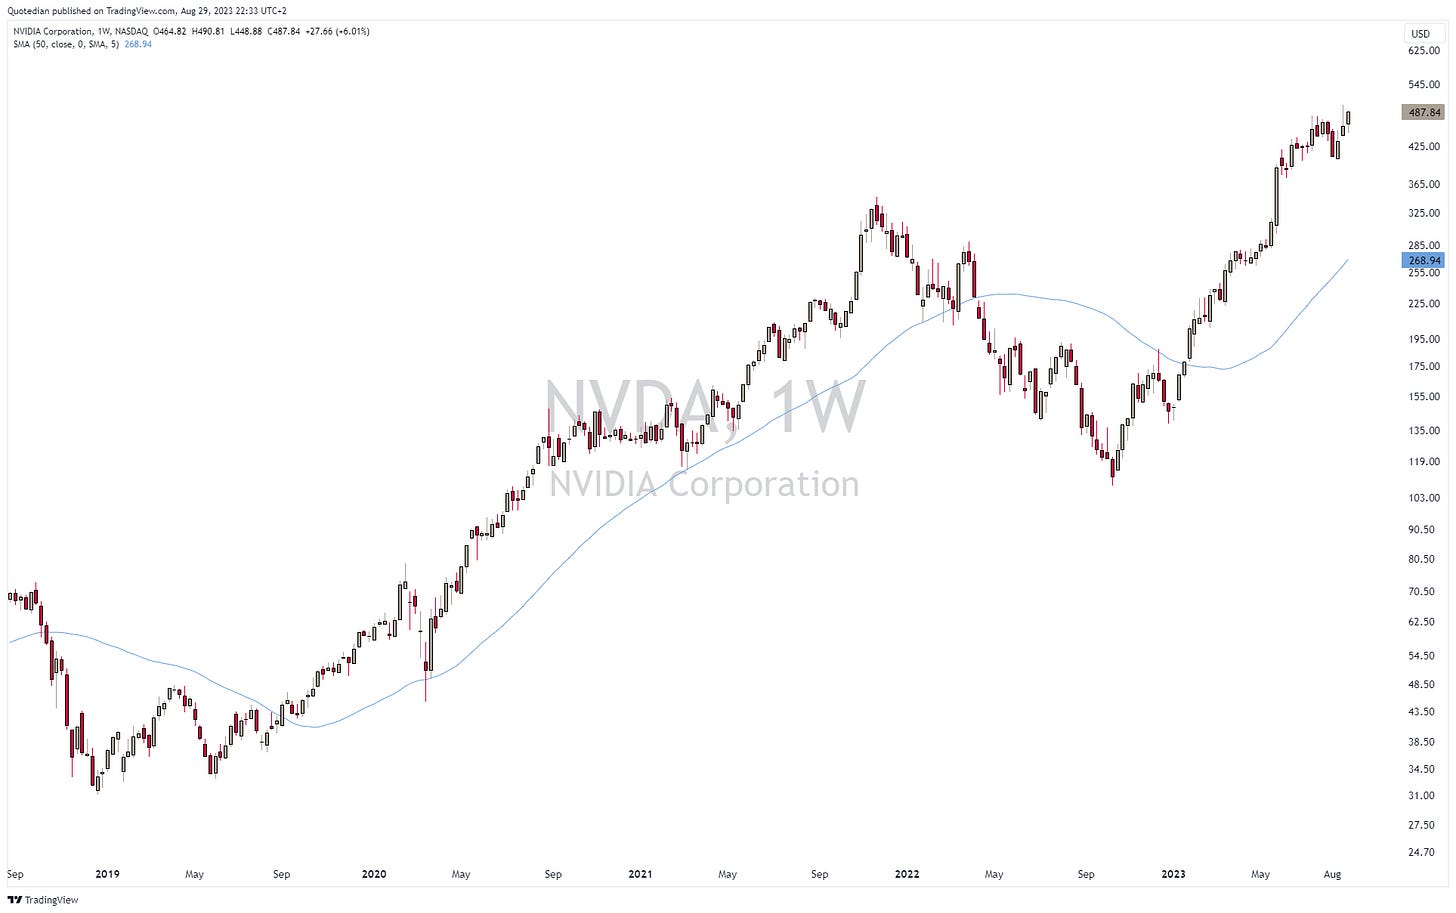
Whilst many were quick to call it the end of the bull-run for NVDA, zooming out to a weekly chart gives me rather the impression that we are on the onset of the next upleg:
The question then to me is rather, whether the stocks Halo will shine bright enough to lift the overall market.
Let’s see how that is going …
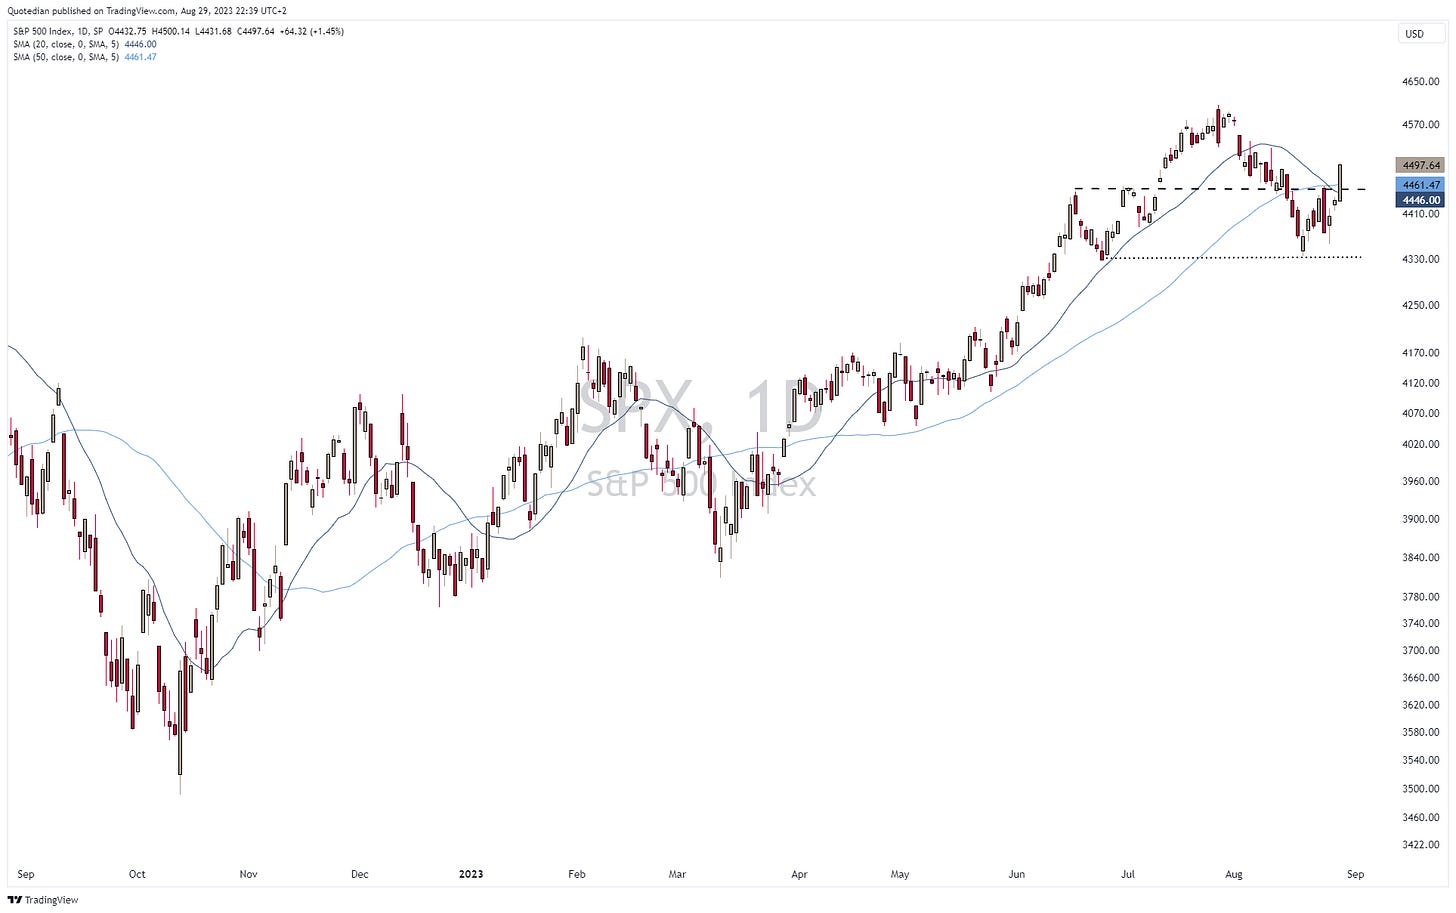
Indeed, where stocks in for a third consecutive up day yesterday, and as measured by the S&P 500, this is the first time the index is up more than only one day in August.
Looking at the chart, the S&P has not only held above crucial support (dotted), but also exceeded the necessary resistance (dashed) we discussed here last week, to give the bulls the upper hand again:
As an added bonus, the index also reclaimed its 20- (grey) and 50-day (blue) moving averages.
Similarly, the Nasdaq has also improved its short- to medium-term outlook dramatically over the past three sessions:
US small cap stocks, as benchmarked via the Russell 2000 index, continue to show a more complicated picture as they remain range-bound:
But maybe this chart carries all hopes for small cap investors? It shows an ETF on the Russell 2000 (IWM) divided by large cap stocks represented via an ETF on the S&P 500 (SPY):
Mother of all support levels?
But let’s turn back a moment more to yesterday’s session, which saw all eleven economic sectors gaining,
and the number of advancing stocks beating the number of declining stocks at a ratio of 9:1, leaving us with this sea of green on the heatmap:
Returning to our NVDA - Halo Effect, we also notice that the most speculative stocks, such as the Roundhill Meme Stock ETF (grey) or the GS most shorted stocks (red) are outperforming the overall market (blue) again:
A quick glance over to Europe (STOXX 600 Europe Index - SXXP) shows that the hick-hack on the chart continues, but the past three sessions have undoubtfully been a “feel-good” for stock market bulls:
Turning to today, Wednesday, the second last day of this enormously long month, we note that Asian stocks are mostly up on the day, however, well off their intraday highs. European and US equity index futures thread in positive territory for now too.
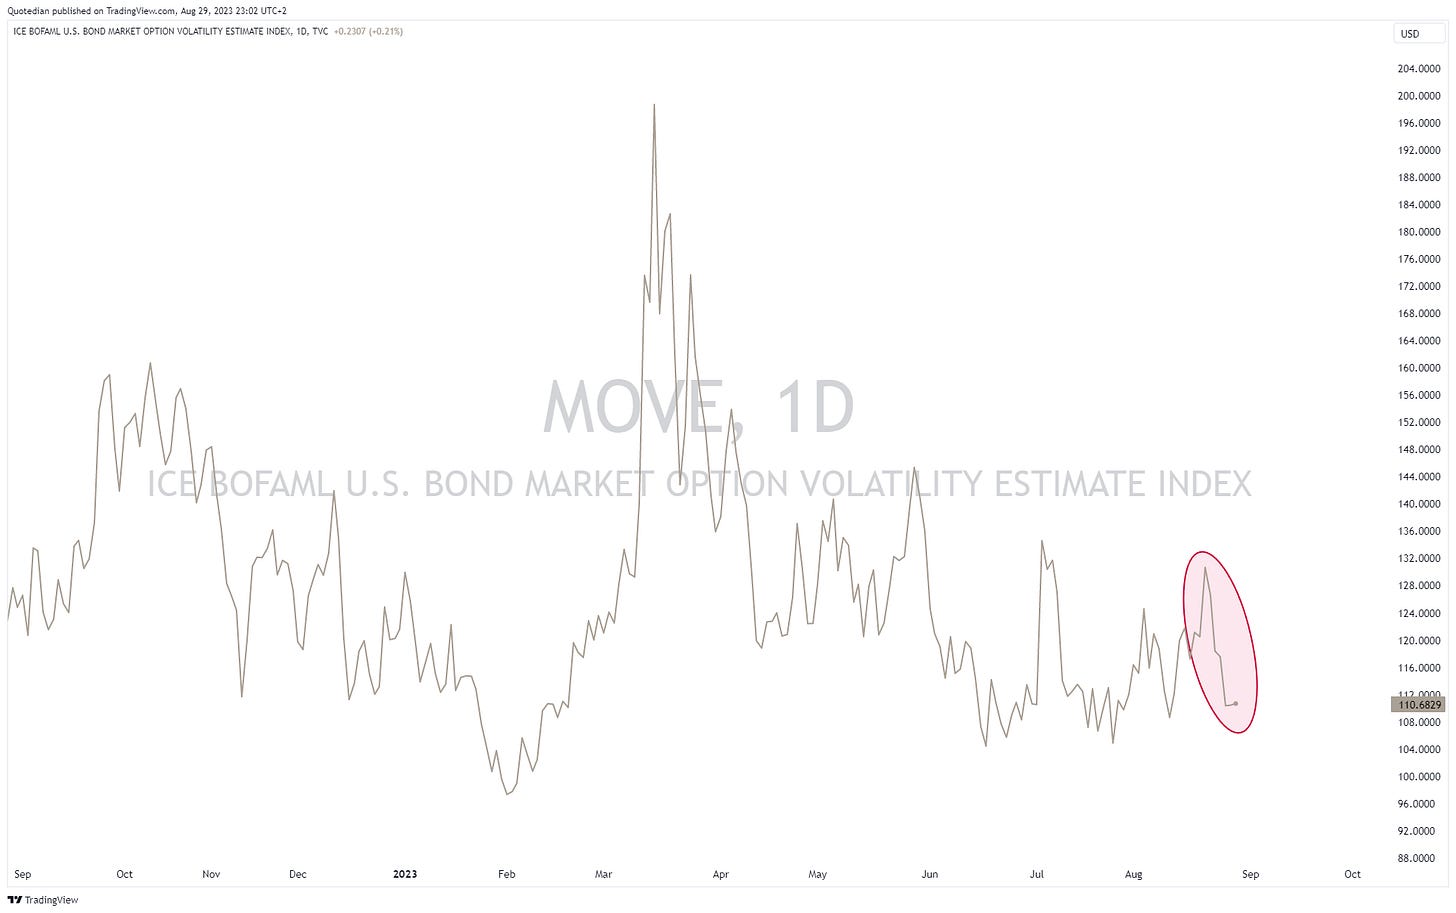
The situation on global fixed income markets has calmed down tremendously as compared to the past few weeks, not only expressed in lower bond volatility (MOVE),
but also the upside breakout on yields starts looking as if it were nothing more than a classical bull trap (or bear trap, depends on your point of view…). Here’s the US 10-year yield chart for example:
To see the “other” view, i.e. price view, here’s the popular long-bond TLT ETF:
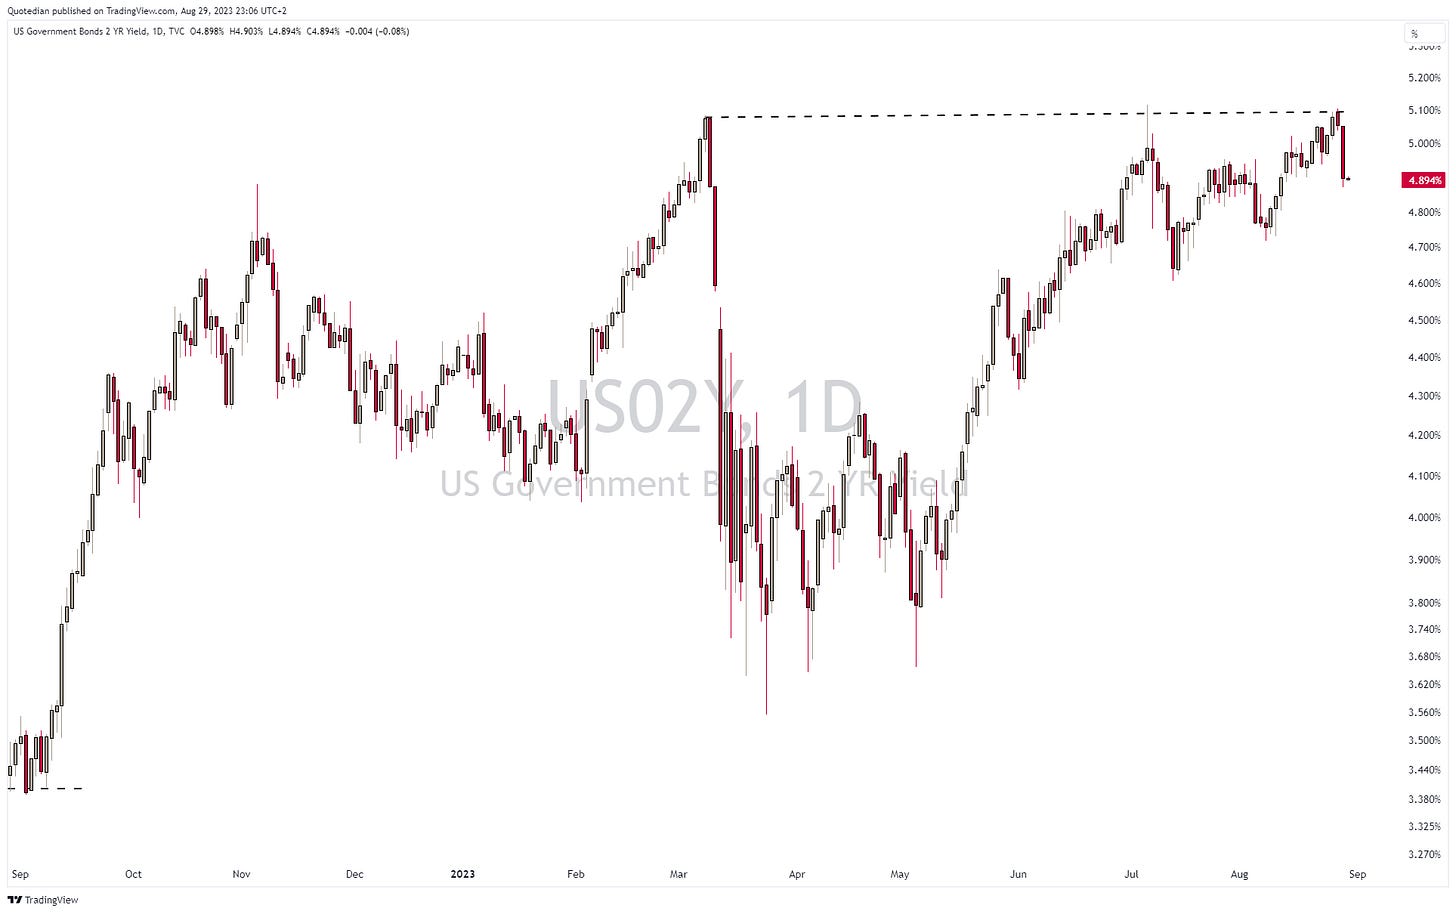
Short-term yields (2Y) have seen a similar, dramatic reversal:
By the way, this weakness in yields came yesterday after a weak JOLTS report, which tends to forerun other labour indicators such as the ADP or the NFP report.
Meanhwile, the yield curve (10y-2y) remains strongly inverted:
And to finish the FI, credit spread continued to tighten on the back of a recovering equity market and lower yields:
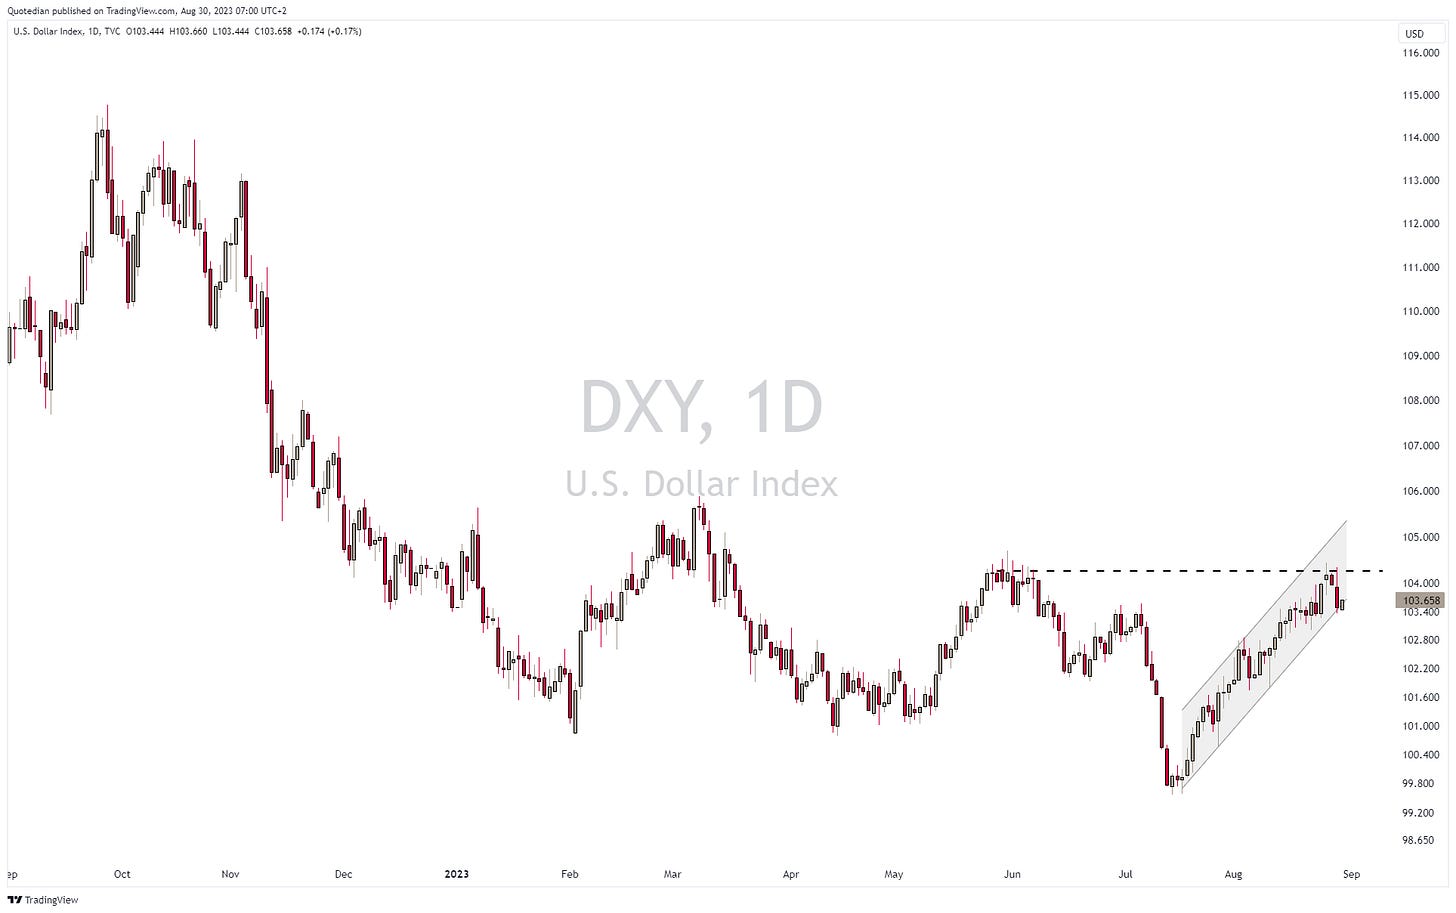
Major currencies continue to trade unconvincingly in either direction. The US Dollar Index (DXY), for example, turned down again right at its resistance level, whilst for a moment it seemed it would break higher:
But to no avail.
This is how it looks on the EUR/USD chart:
Also rebounding right from the lower end of its trend channel. At least technical analysts seem to have a day in the sun …
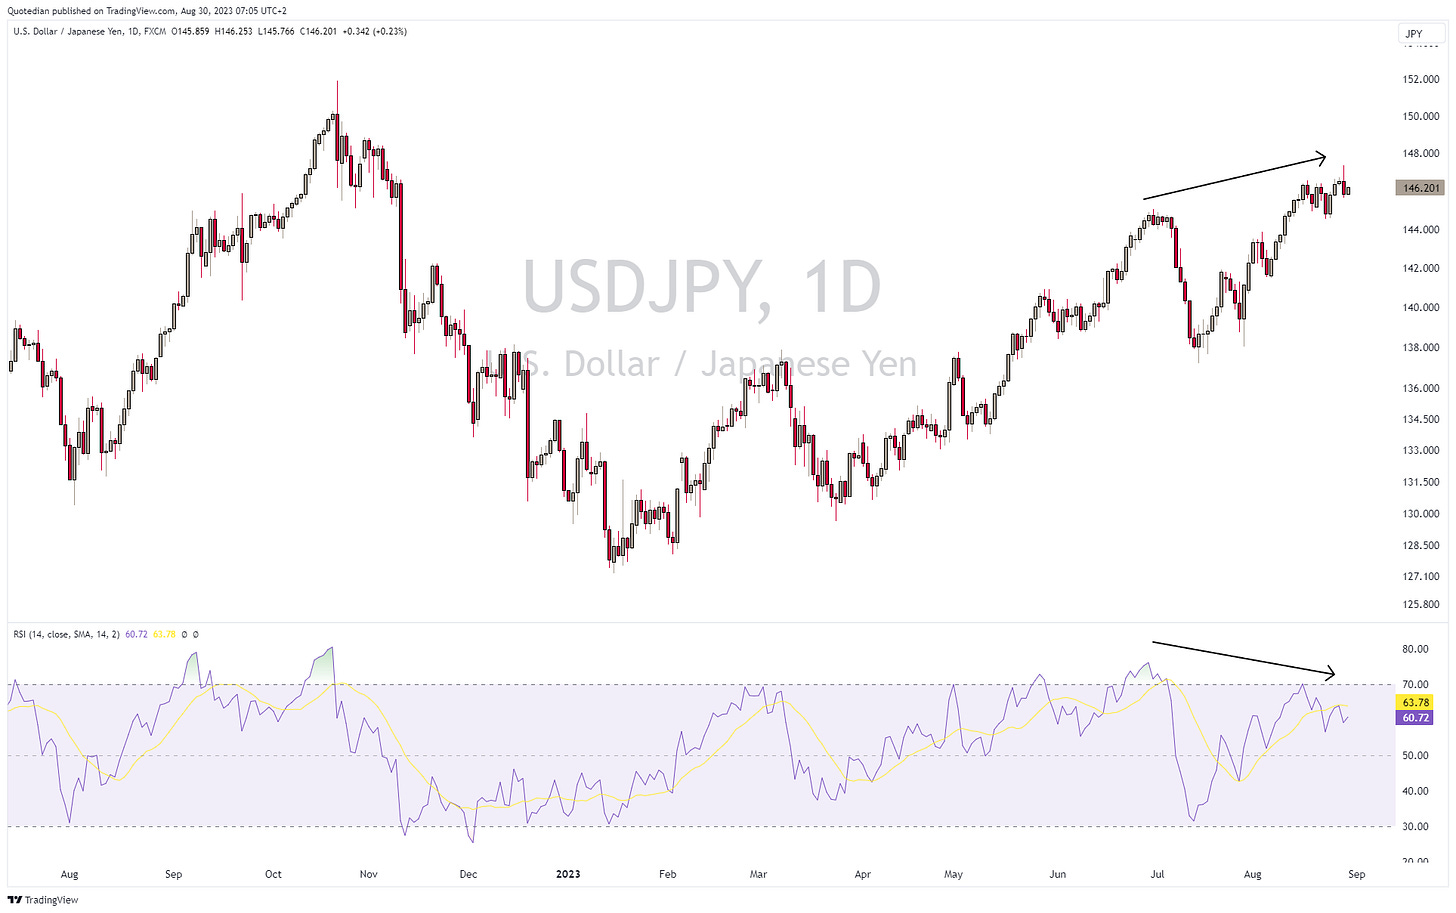
One of the currencies on top of my watch list is definitely the Yen, below verus the US Dollar. A drop below 144.00 would definitely peek my interest on a Yen long positions (long against USD, EUR or GBP, or even CHF). Will add that to the Trade Gallery (see below) once warranted:
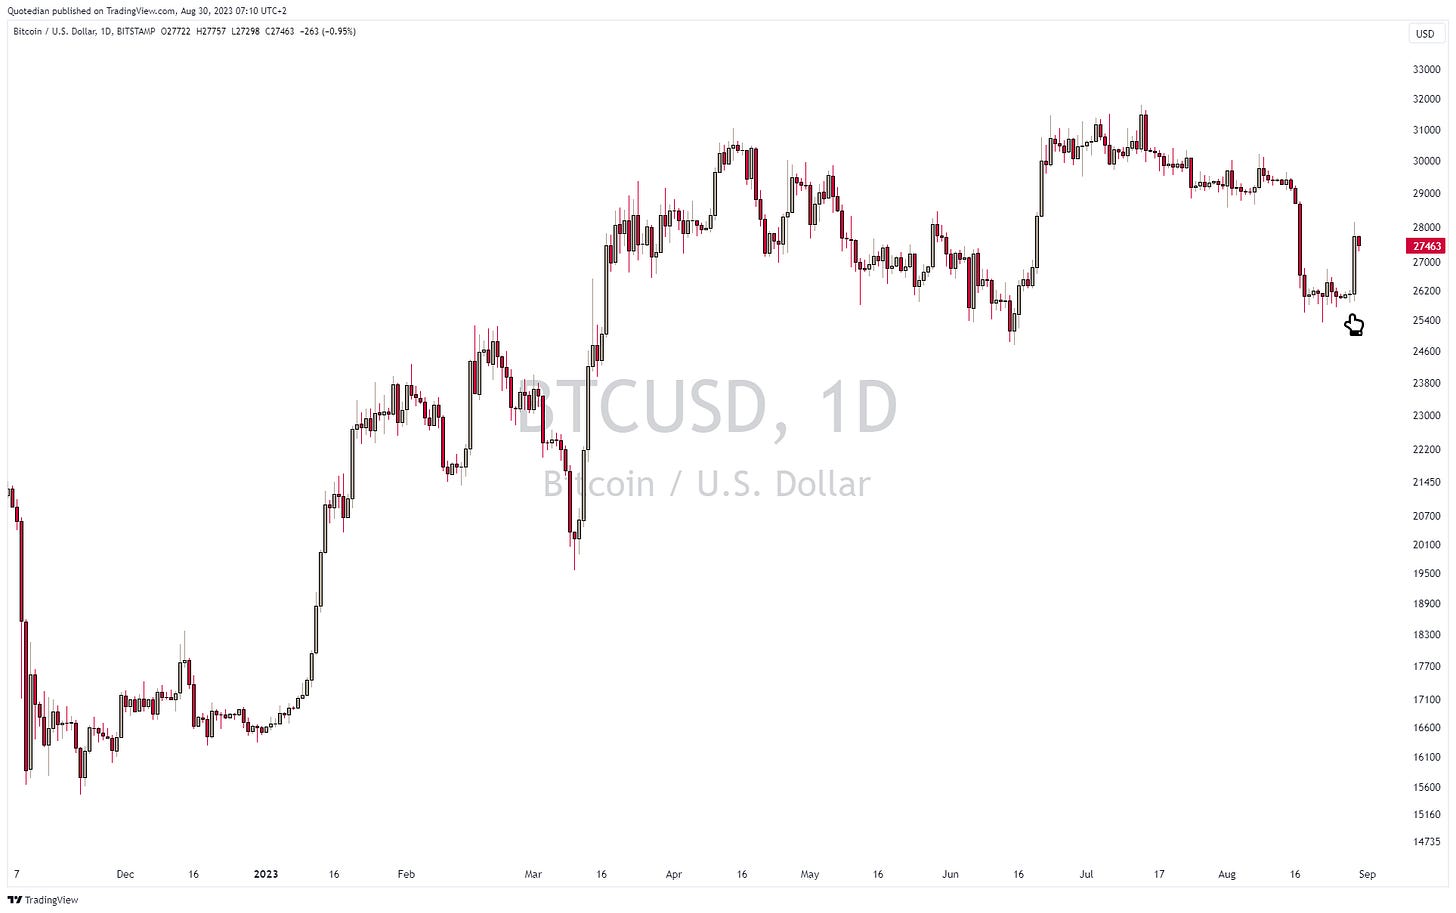
Finally, in cryptocurreny-land, Bitcoin saw a six percent jump yesterday, as a US court overturned an SEC decision to block the conversion of the popular Grayscale Bitcoin Trust into an ETF. Here’s Bitcoin:
And here’s the Grayscale Bitcoin Trust (GBTC), which actually jumped 17%:
In commodities, just a teaser for tomorrow’s Quotedian. Oil and related stocks look interesting to us:
Heard lately that China will either
Disintegrate
Fall apart
Sink
All of the above
No wonder, if you did hear such ‘prophecies’ as sentiment has turned extremely negative over the past month or so.
Sentiment expert Jason Goepfert actually put the dimension of this negativity into a tweet a day or two ago:
Go figure…
And then we had the icing on the cake delivered by The Economist front page cover last week:
I am not a born contrarian, but enough is enough and all of this warrants a tactical long on Chinese equities. Below is the idea on the FXI (iShares China Large Cap ETF), which we entered on Aug 22:
Stay tuned …
The idea of this section will be to follow some shorter-term investment ideas on a non-quantitative basis, just to keep track. None of this necessarily represents the decision of NPB’s investment committee nor are they investment recommendations.
Should you seek investment advice, get in touch: ahuwiler@npb-bank.ch
Everything in this document is for educational purposes only (FEPO)
Nothing in this document should be considered investment advice
The views expressed in this document may differ from the views published by NPB Neue Private Bank AG
Past performance is hopefully no indication of future performance


