Hotel California - Deep Trouble Remix
The Quotedian - Vol VI, Issue 18 | Powered by Neue Privat Bank AG
“You can check out any time you like, but you can never leave”
— The Eagles, Hotel California
DASHBOARD
CROSS-ASSET DELIBERATIONS
Back in September of last year, I wrote an article in this space called “Hotel California”, which you can re-read by clicking here.
The main topic of that letter was that the Bank of England had re-engaged in Quantitative Easing (QE) just a few days before the official Quantitative Tightening (QT) program should have started. The reason? A financial crisis linked to (pension) funds following a liability-driven investment (LDI) strategy, which ran out of collateral as government bond prices collapsed following the disastrous mini-budget proposed by a lettuce Liz Truss.
Rings a bell? Fast-forward six months and here we are in the middle of the next crisis - this time in the global banking system, as central banks around the world try to live up to their reputation of hiking rates until they break something.
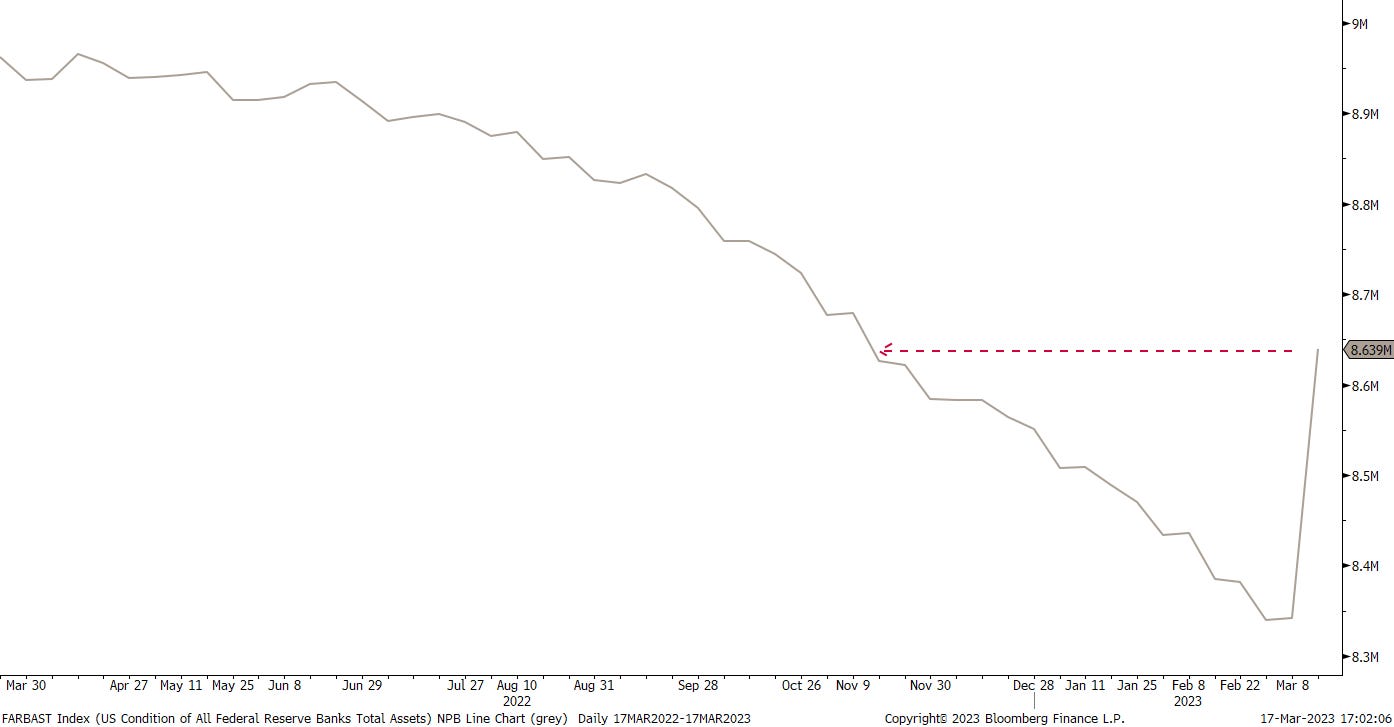
This brings us to our first chart, the Fed’s Balance Sheet:
Yep, that’s about four months’ worth of Fed QT undone in just a week.
“You can check out any time you like
But you can never leave”
Read the rest of today’s Quotedian by listening to the Deep Trouble House Remix or this fantastic live performance by The Eagles. And if you cannot make your mind, listen to both - there should be enough reading material and charts to get you through that double whammy.
The good old Quotedian, now powered by Neue Privat Bank AG
Tier 1 ratio twice the regulatory requirement, not publicly listed, fiercely independent, vast asset management experience, the sole focus on private banking … that’s NPB. What’s not to like?
Contact us to find out more: info@npb-bank.ch
Last Sunday night, the movie “Everything Everywhere All at Once” won the Oscar for best motion picture. The movie’s title was the alternate choice for today’s letter, as it seems to describe very well what is currently going on in markets:
But let’s take it in pieces, starting with stock markets. This is the performance of global benchmark equity markets:
Well, that’s actually mildly surprising to see the US market eking out a positive performance - nearly six percent for the Nasdaq! Of course, can this only mean that bond yields have tanked, but we will confirm that in the bond section.
Some charts now …
Starting with the S&P 500, we note that the lower price target (3,775) we had identified a few weeks ago, was nearly reached, and the index has turned back up since then, which we would interpret as constructive:
A close above 3,965 could give some more tailwind to stocks, but only a close above 4,055 would make it feasible to assume that the cyclical uptrend is reinstated.
The chart on the Nasdaq suddenly looks substantially more constructive,
and equally suddenly is the best performing index year-to-date on our radar:
Let’s look at that Nasdaq chart again, with a different viewpoint:
Hhhmmm, an argument for an inverted shoulder-head-shoulder pattern can be made here, with a close above 12,600-12,800 breaking the neckline and implying a move back up to 16,000 (Hey, don’t shoot the messenger, just laying out the rules …).
In terms of volatility, US equity markets are in fear, but not in panic mode:
Hoping over to our side of the Atlantic, European equity markets are facing the contrary of their US counterparts, as the previously constructive pattern is crumbling pretty quickly. Here’s the STOXX 600 Europe index:
This, of course, must also mean that the recently and newly found outperformance of European over US stocks must be at danger:
Indeed.
Let’s turn to equity sector performance then. Using MSCI World sectors, we note that it was a good week for long-duration sectors, but not so good for more tangible sectors (Energy, Materials) and definitely not for banks (financials) either:
After the fallout in the US banking sector a week ago, contagion reached Europe this week. Here’s the Lyxor STOXX 600 Bank ETF:
This index (ETF) has now retraced more than 50% of its entire upmove since last October and is likely to drop to key, key, key support at around 19.70 - which is only a bit more than 3% away now. There is must hold FULL STOP
Checking in on factor performance for a moment, and taking sector performance into consideration, it will come as no surprise that growth strongly outperformed value:
Finally, before moving into the fixed-income space, let’s update our tables of the best-performing stocks on a year-to-date basis and how they have fared over the past week.
Here’s the US list:
And here is the European list:
In fixed-income markets the performance table quickly reveals that rates have reversed lower, but credit spreads have widened:
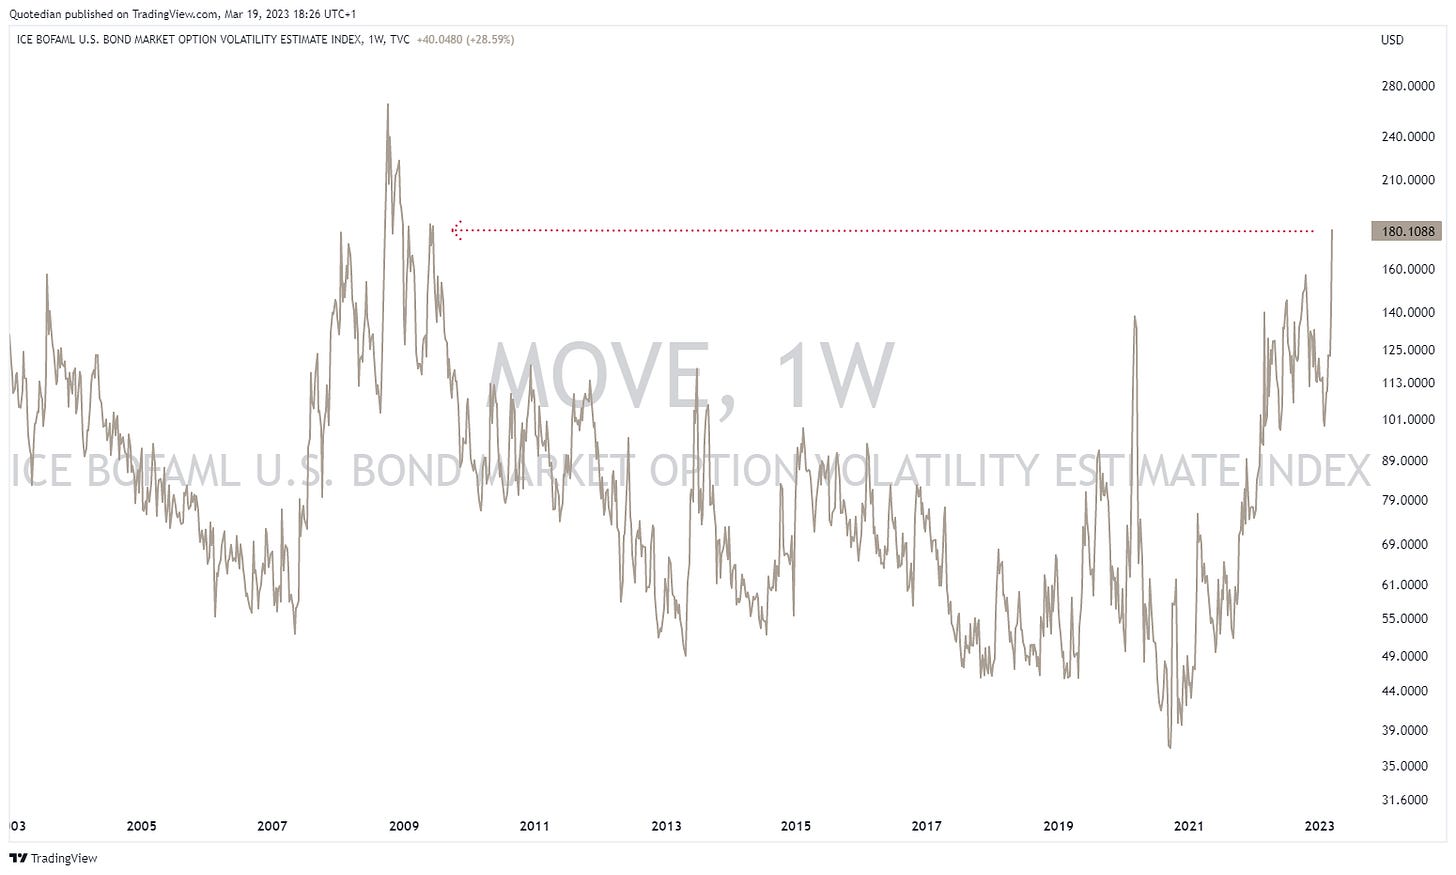
This is probably the most important chart for fixed-income all investors:
The bond market’s VIX-equivalent, the MOVE, is now in absolute panic mode and mood, in line with the levels at the heights of the GFC some 15 years ago. This is not good and was the inspiration for today’s QOTD.
Some more FI charts … here’s the US 10-year yield, sitting right on top of what seems to be key support:
Let’s look at this in terms of price, using the popular TLT (iShares 20+ year Treasury bond ETF) as a proxy:
This actually looks really constructive. A close above $110 would be the technical confirmation for a new uptrend in place.
The yield curve (10y-2y) has steepened dramatically this week:
In Europe, where the ECB bravely hiked 50 basis points (Trichet 2007 anyone?) into a rapidly imploding banking market.
Yields smelt the policy error and collapsed (here’s the two-year Bund):
(Comparatively) Little happened in currency markets,
with only the Japanese Yen strength standing out:
If 127.50 gives, a move down to 113 could be on the books from a technical point of view. This would mean that EUR/USD should move higher too, though the chart is less constructive here (for now):
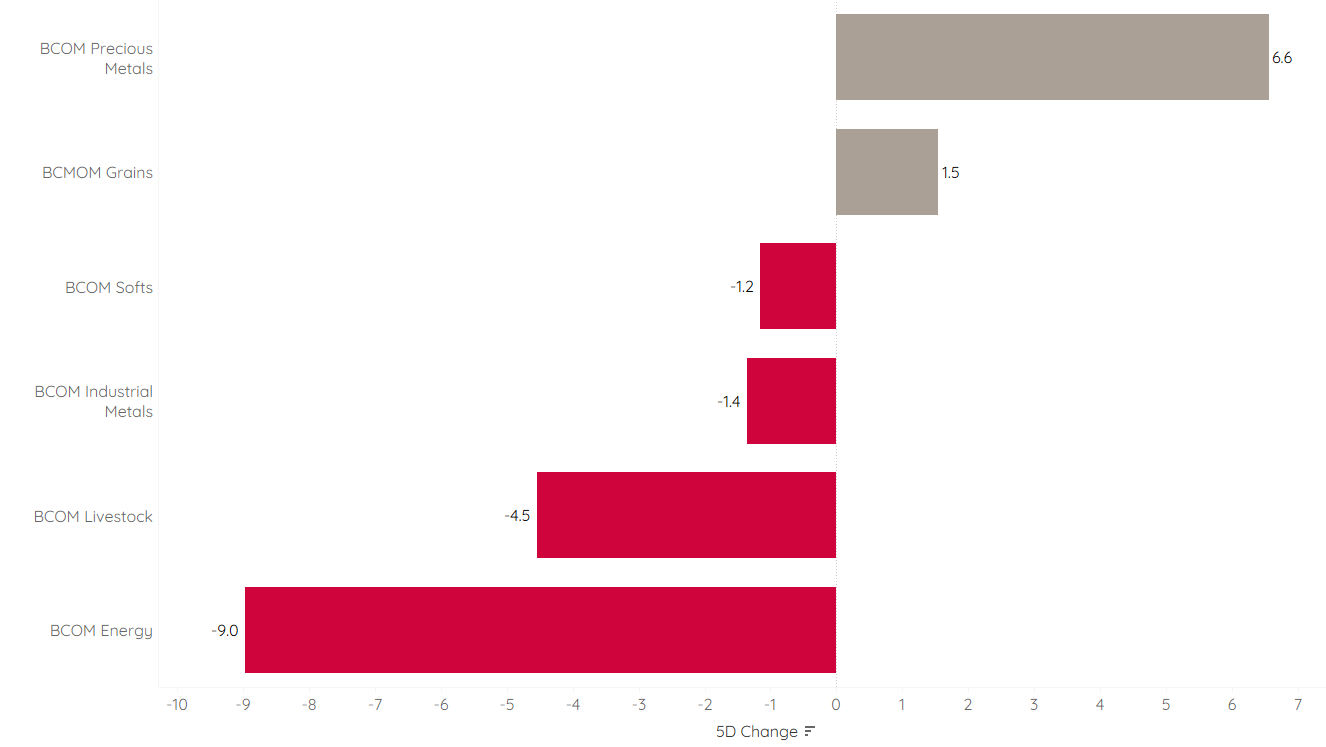
Last but not least moving into commodity markets, the 30,000 feet view already reveals that not all commodities were treated equally this week:
Being long Energy was really, really painful as the market moves into recession mode, whilst simultaneously being invested in the shiny, yellow metal called gold paid off for a similar reason, plus the safe haven effect from the banking fallout.
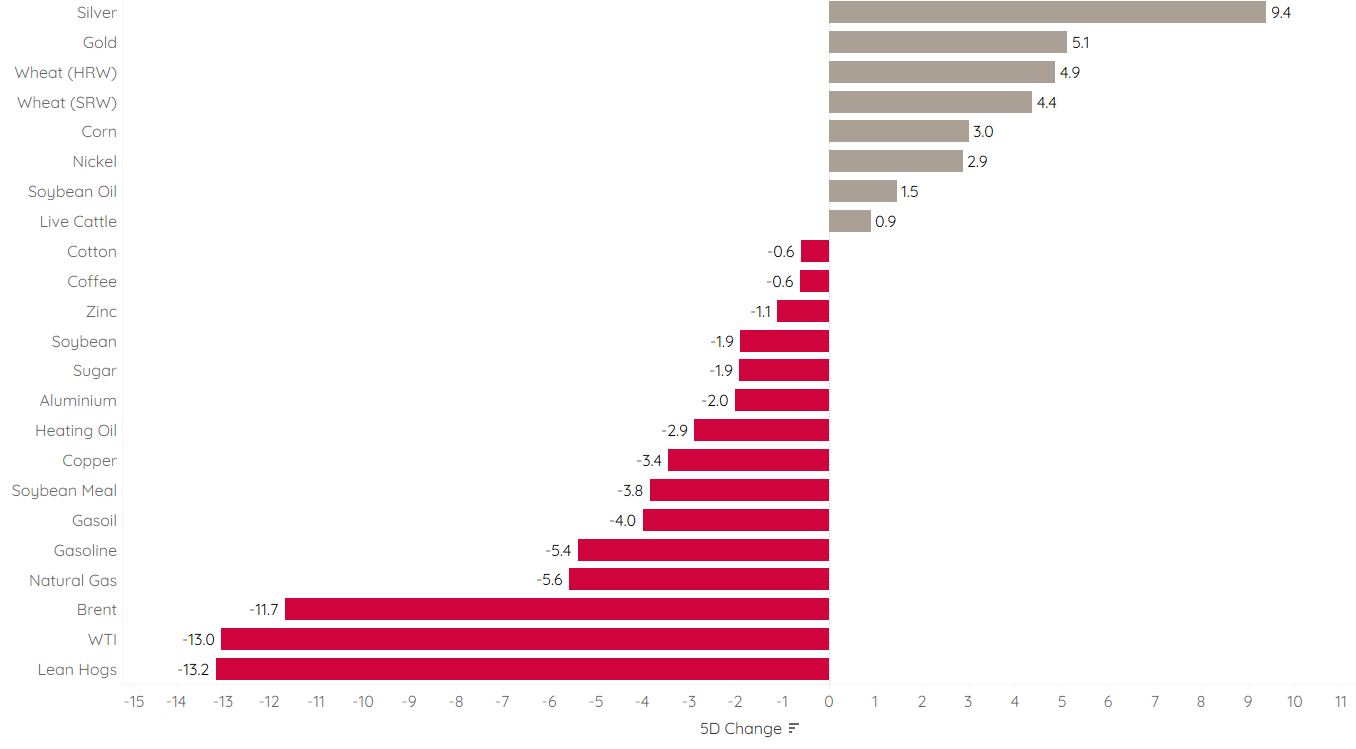
Here’s a more granular view of commodity futures:
Silver surprisingly outperformed gold, which is not likely to hold as we move close to a global slowdown. But here’s the silver chart anyway:
But Gold looks more constructive IMHO:
Here’s a close-up (daily) view:
If 2,050 gives on the upper side, the gold rush could accelerate.
Time to hit the send button. Next week should be interesting to say the least, with the Credit Suisse and the FOMC mysteries to be resolved.
Regarding the latter, it is absolutely astonishing how the market has shifted in the space of a week from expecting several more hikes, to just one and then three cuts by December:
If this is true - then we will be in for a wild ride - in all aspects. Hence, STAY TUNED…
CHART OF THE DAY
Further up we discussed how the yield curve has steepened dramatically the past two weeks. Here’s the bad news:
Recessions do not happen when the yield curve inverts. They happen when yield curves steepen again after inversion.
Most announced recession 2023 - here we come!
Thanks for reading The Quotedian! Subscribe for free to receive new posts the moment they are published.
DISCLAIMER
Everything in this document is for educational purposes only (FEPO)
Nothing in this document should be considered investment advice
The views expressed in this document may differ from the views published by Neue Private Bank AG
Past performance is hopefully no indication of future performance


