January Barometer
Volume VI, Issue 5 | Powered by Neue Privat Bank AG
“There are three kinds of lies: lies, damned lies, and statistics.”
— Attributed by Mark Twain to Benjamin Disraeli
DASHBOARD
AGENDA
CROSS-ASSET DELIBERATIONS
Aaannd … it’s done! January, usually the month dedicated to recovery of our wallets and livers post the Christmas period, turned out to be also the month of recovery for many risky, and not so risky, asset classes. And that, according to this old Wall Street adage:
“as goes January, so goes the year”
would be great news for the remaining eleven months of the year. According to this source, this effect also known as the January Barometer, has an accuracy of >85% - not bad, I’ll take it! And, as you will see further below, we can even improve in that with some the help of some mild data snooping …
…but…
…before we jump the gun, first things first:
As a quick reminder, especially for the several newcomers on the list, the end-of-month editions of The Quotedian have an even stronger focus on statistical market data, rather than qualitative market assessments, than the usual intra-month issues. The object here is to get ourselves up-to-date, “speed dating”-style on what has been going on over the month just gone by and what does it mean in the year-to-date context (which in January happens to be the same…doh!). But we also take the opportunity to zoom out and look at the longer-term picture on some monthly charts.
And off we go …
Starting with equities, we already got a hint in last Sunday’s report, that January might have been quite fantastic for global equity benchmarks. Let’s check it:
Well, this should let us forget some of last year’s pain! And, of course, should the above-mentioned January Barometer hold up, we’re in for a treat. Unless that WAS the treat already and we are in for a year of nothingness, which is unlikely.
And as promised above, I can massage the data even further, and give you following table, but together by Data Miner in Chief Ryan Detrick at the Carson Group:
In other words, when the market (S&P 500) was down in the previous year and was up for the Santa Claus Rally, the first five day of January and the entire month of January, you are GUARANTEED to have a (very decent) double-digit return for the entire year… I repeat my words from Sunday’s issue:
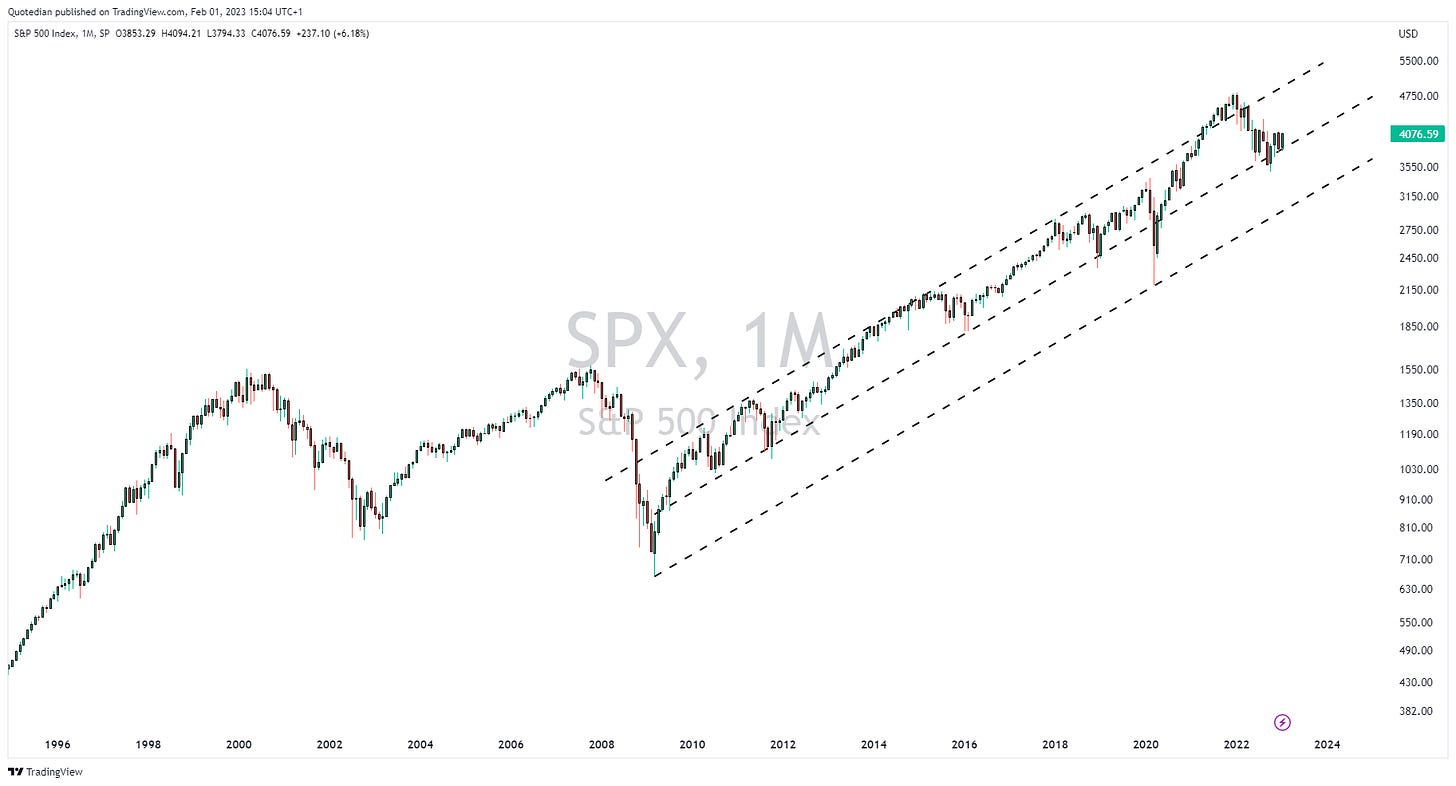
Ok, let’s have a look at some monthly charts (with the danger of stating the obvious: in the following charts each candle/bear reflects one months of price action. To start, here’s the S&P 500:
In many ways, the verdict if we are looking at the continuation of the 14-year old secular bull market or if a secular bear market has started last year, still stands out. Adding some of those silly trendlines to the same chart above reveals that in many aspects, the bull is still alive, unless 3,1500 gives on the lower side:
But of course is 3,150 more than 20% away from the current level, showing that secular trends should at best be considered climate, not weather. But for today, we’ll continue our climate studies ;-)
Let’s check on the S&P’s European cousin then, the STOXX Europe 600 index (SXXP):
This chart looks somewhat more constructive, having held above the crucial pivot point at 400. This kind of strengthens my idea that we are up first before down more.
On Sunday I showed as possible ‘evidence’ of a move higher in stocks how want-have (consumer discretionary) stocks are outperforming once again must-have (consumer staples) stocks. A similar chart, showing that risk is on again (aka “animal spirits”), is the ratio of high beta stocks to low volatility shares:
Note how that ratio was a very early canary in the coal mine as it failed to make new highs throughout the entire year of 2021, warning of the impeding sell-off in 2022:
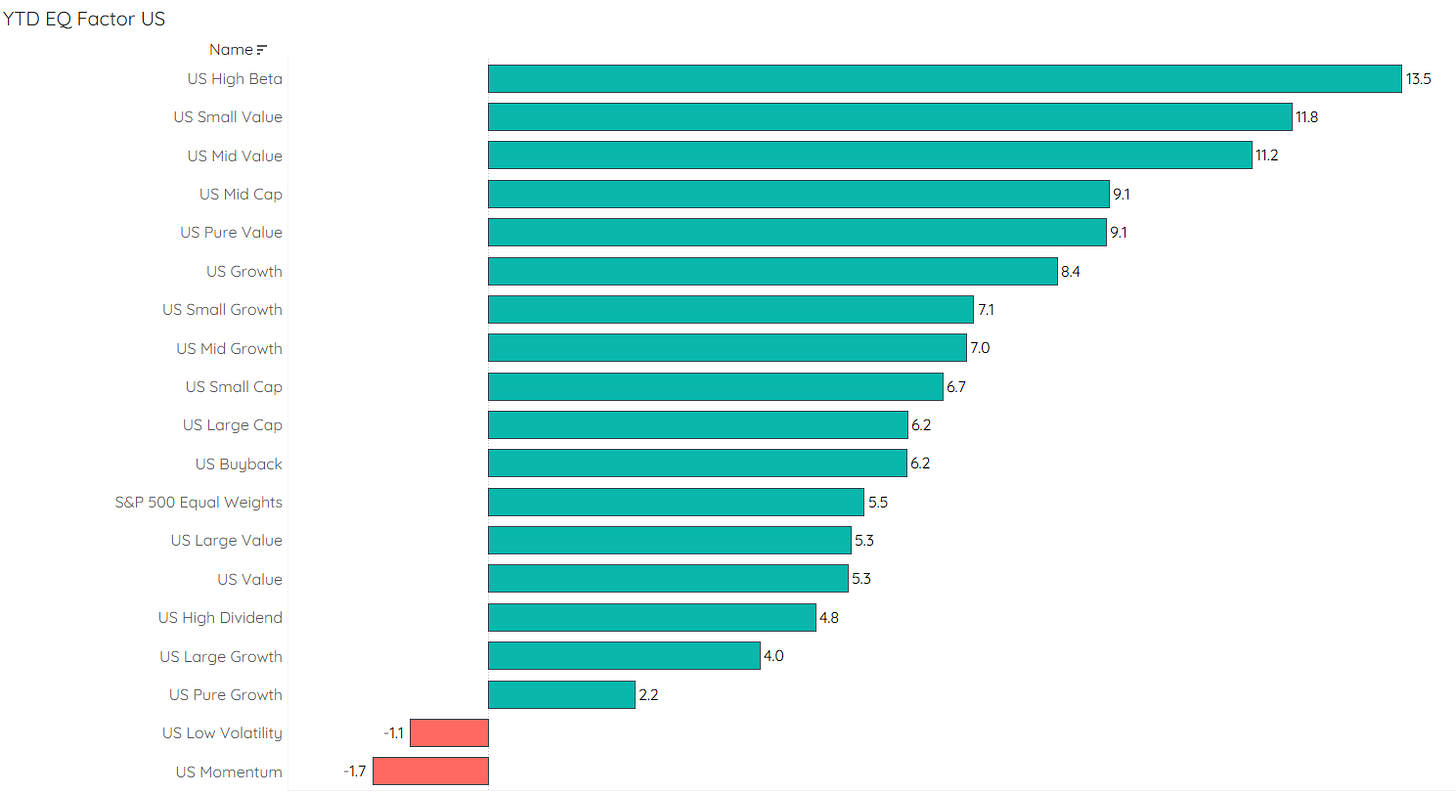
As we are talking equity factors (high beta vs low vol) anyway, let’s check on the January performance of (US) factor strategies for a second:
Definitely a risk-on tilt to that, with high beta and small cap on top, whilst more defensive strategies such as value, high dividend and low vol are close to the bottom.
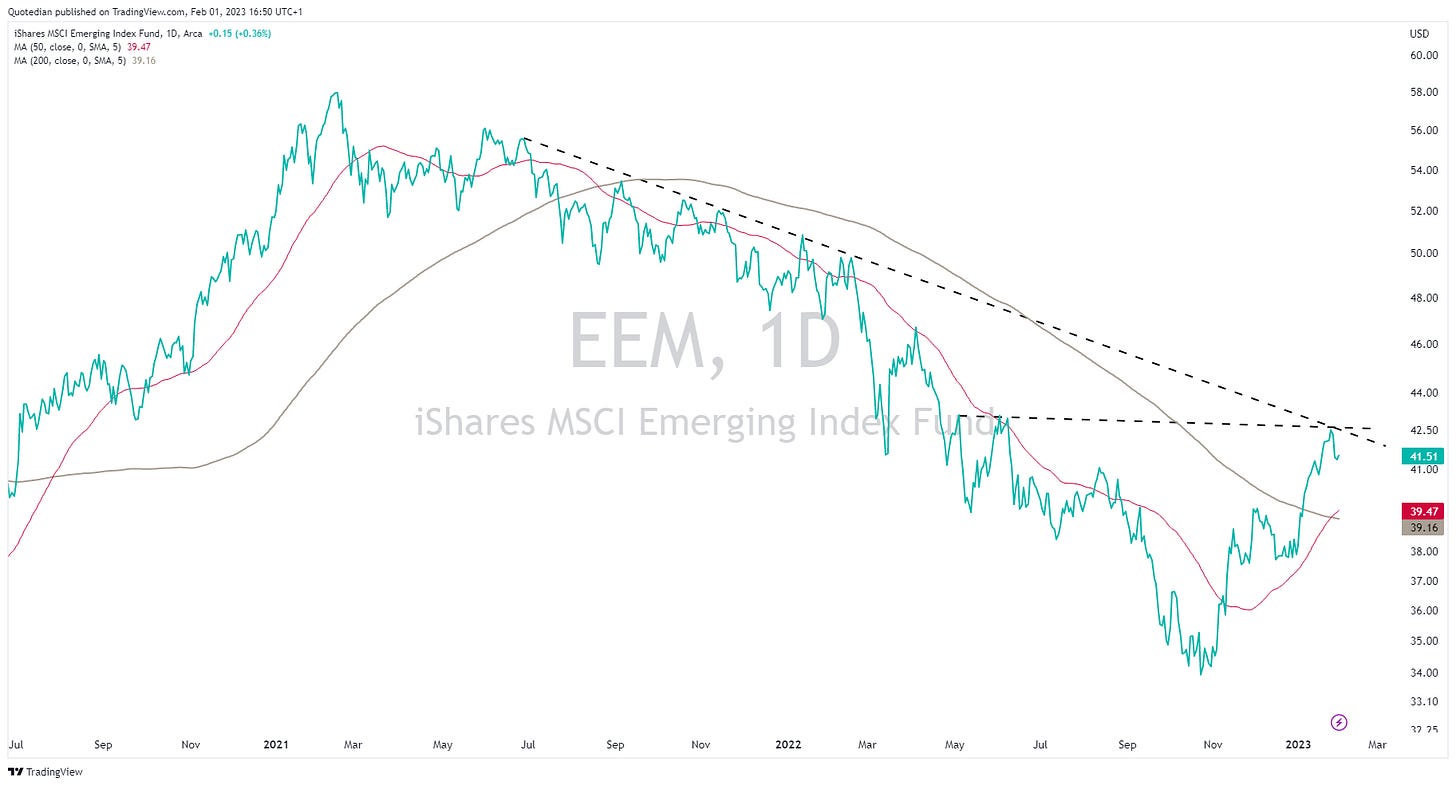
Looking at Emerging Markets as one whole for a moment (an increasingly dangerous non-differentiation nowadays), we note that on an absolute basis using the iShares Emerging Markets ETF (EEM) as a proxy, EM stocks are about to take out important trendline resistance points and have already produced a golden cross (50d MA > 200d MA):
whilst on a relative basis (versus MSCI World) the trendline has already been violated to the upside and the golden cross is about to ‘happen’:
Ok, just before we move into some equity sector performance observations, make sure to check out this:
The good old Quotedian, now powered by Neue Privat Bank AG
NPB Neue Privat Bank AG is a reliable partner for all aspects of asset management and investment advice, be it in our dealings with discerning private clients, independent asset managers or institutional investors.
Nine out of the eleven equity sectors turned out a positive performance result in January:
By intuition, it feels that last years worst sectors were January’s best and vice versa, and the following graph tries to confirm that:
With this, let’s leave the equity section as is and turn our attention over to the fixed income space.
Given the risk-on mode we have observed on the equity side, this should be reflected in a positive bond performance too - at a minimum on the credit side of things at least:
Yep, very much so. Nearly all corporate bond benchmarks are close to the top. High yield strategies are ahead of investment grade benchmarks, just as we would have expected. Trailing, but still positive are Treasury and Aggregate benchmarks.
As you are aware, bonds have two major risk components (and about a million minor ones) - interest rate risk and credit risk. Let’s check on interest rate risk first. Here’s the monthly chart of the US 10-year Treasury yield:
The rally in yields has been formidable over the past twelve months, explaining of course most of the bad bond (price) performance of 2022.
From a technical point of view, the next move seems a bit unclear to me, but given the Fed seemingly approaching the end of its hiking cycle whilst maintaining a “higher for longer”-mantra, some kind of range bound trading over the coming months would not surprise me.
But let me repeat what I said in several previous edition of this missive: Yields would have to drop A LOT to invalidate the technical picture of a secular uptrend:
Here’s the monthly chart for European yields, proxied via the German 10-year Bund:
Intuitively, it feels like some more upside (to yields) may lay ahead, but a lot will depend on the path of US rates.
Let’s also check in on the long-term chart of high yield credit spreads in Europe and the US, even though we already know about the tightening of the past few months:
Despite having contracted substantially, we are still close to the top of previous spikes (2015/2018), which means there’s still some “juice” in credit spreads if that’s your type of investment.
Finally, here some really good news regarding the functioning of the US treasury market:
The MOVE index, the bond-equivalent to the S&P’s VIX volatility indicator, has started to normalize at an increased pace, which is overall good news for the global financial system.
In currency markets, and again given the overall risk-on mood and mode of market participants, we would expect to generally see a lower Dollar:
Bingo.
The US Dollar, which shot ahead last year and was a headache to the rest of asset classes (remember Treasury secretary John Connally: “our currency, your problem”), produced its fourth consecutive “red candle” since the top in October:
But beware! There’s some argument to be had that we are at a major support level and and oversold Greenback may find some footing:
Finally, a quick glance at the commodity month just gone by. First, let’s look at the performance of the main commodity sectors:
Alright, the much discussed industrial metal rally of the past weeks is well portrayed above, though Softs did even better. Unfortunately, hardly anybody is structurally, strategically or even tactically invested in Softs (sigh).
Two observations on the close to 10% in Energy-related commodities:
Most of the negative contribution likely came from Natural Gas
Given the sell-off in the underlying commodities, it is stunning and telling that energy equities were able to squeeze out a small net gain (see above)
Let’s take also a more granular look at the underlying commodity futures:
That’s 55% performance deviation between the best and the worst - for sure there must be some alpha to be had there!
Let’s wrap up by looking at the long-term charts of three commodities most of us can relate to: Soybeans, lean hogs and cotton.
Let’ start with Gold:
Veeeeery interesting set-up! A break would please many gold bugs, but that may lay a few months away. Time to lock in some tactical profits?
Next up, the industrial metal with a PhD in economics, Dr Copper:
Impressive rally recently, which however would suggest that US yields should be higher than they currently are …
And finally, black gold!
Taking Brent as a proxy for the crude oil market, we seem to be back at the $80-$85 pivot area. No clear read for me hear - I would continue to accumulate crude and/or energy stocks on dips, as fundamentals remain in favour of (substantially) higher prices.
Ok, that’s all for today - hope you enjoyed and please feel free to leave your comments by click on the following button:
Take care and stay safe,
André
CHART OF THE DAY
As we are ‘overcharted’ already, let me just leave you with this infograph, which shows what happens during one minute on the internet:
Thanks for reading The Quotedian! Subscribe for free to receive new posts the moment they are published.
DISCLAIMER
Everything in this document is for educational purposes only (FEPO)
Nothing in this document should be considered investment advice
The views expressed in this document may differ from the views published by Neue Private Bank AG
Past performance is hopefully no indication of future performance


Hello André. Is it fandom if I click the like button before reading the newsletter? Hahaha, back to my question, what is the relationship between copper and US yields?