Jaw Dropping
The Quotedian - Vol V, Issue 146
“The stock market is never obvious. It is designed to fool most of the people, most of the time”
— Jesse Livermore
DASHBOARD
AGENDA
CROSS-ASSET DELIBERATIONS
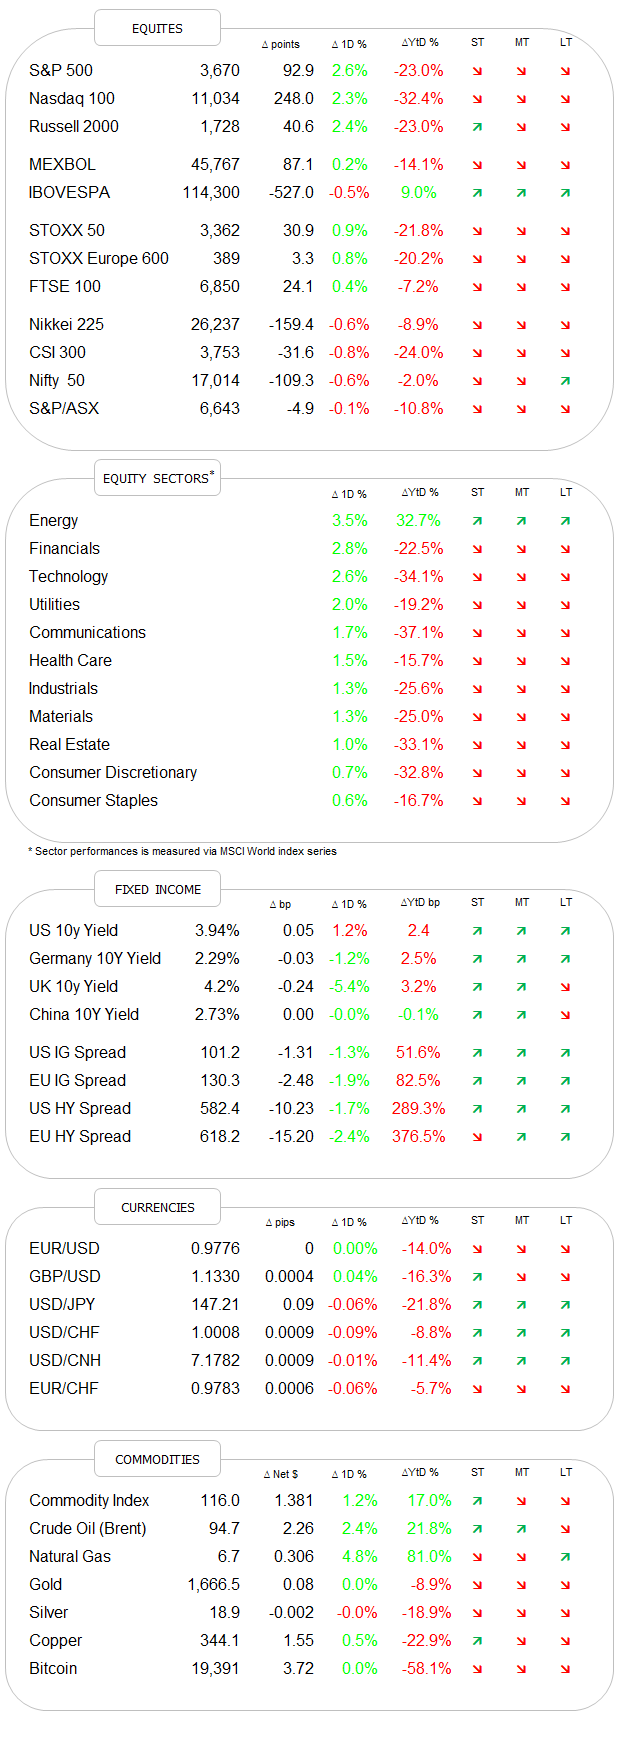
Seeing the stock market ending up by over two-and-a-half percent is impressive enough on any given day. Knowing that it started the session down over two percent lower makes it even more awesome. And then realising all of this happening on hot CPI print, pushing the day that the Fed will step off the monetary breaks even further out into the future, leaves us all with jaw-bones dropped to the floor.
So, what happened? More buyers than sellers? That may even be true after the rally was already well underway, as the bears rushed to close some shorts. But the initiator? I really don’t know (and feel I am not alone in that ignorance), but I suspect that some inflation fatigue may have settled in for now. After all, as I have been advocating on several occasions, CPI is an inflation number based on data at least a month old, on which the Fed will base their monetary decision in a month’s time. Data-driven my a …
The important takeaway is however what I mentioned yesterday. Let me quote myself (u-uh):
Hence, I recommend going into the number as flat (or benchmark neutral) as possible and then learn and conclude from the market reaction to decide on your weightings.
Let’s go and learn from yesterday then, with The Quotedian being more pictures than talk from here onwards…
As mentioned, the turnaround in the equity market was simply astonishing. In percentage terms, for example, the S&P 500 managed a 5.5% turnaround from bottom to top:
In nominal (or point) terms, that was a 1,500(!!) points swing for the Dow Jones Industrial Index:
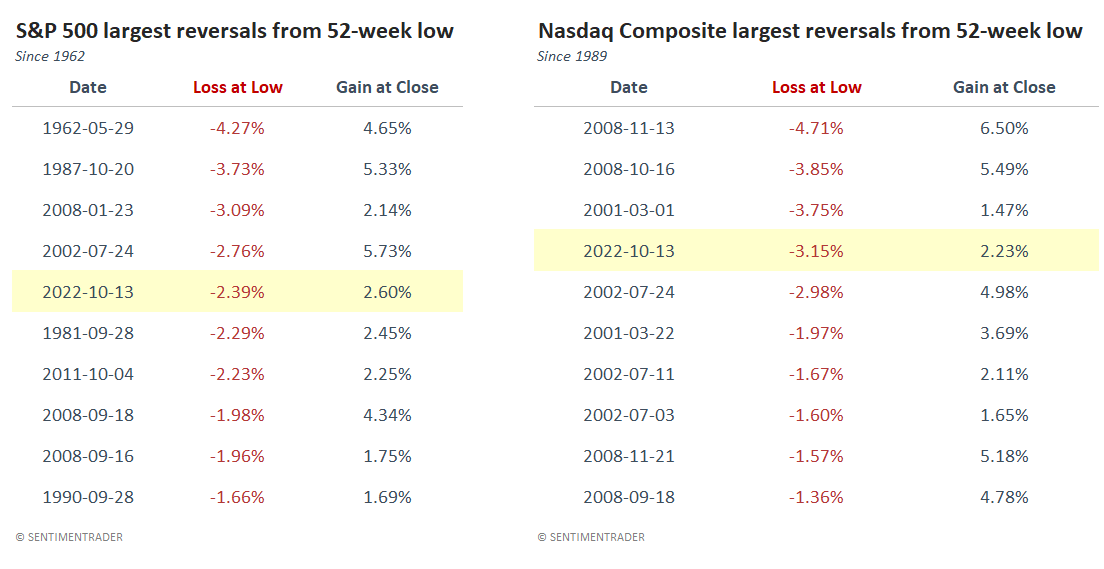
As a matter of fact, these were the fifth- and fourth-largest intraday turnarounds ever from a 52-week low for the S&P 500 and the Nasdaq respectively:
This is what the market heatmap for the S&P 500 looked like early during the session:
And this is the picture at the time of market close:
Impressive.
Not surprisingly, given above’s market carpet, was breadth ‘deep’, with well over 90% of stocks ending the day higher and eleven out of eleven sectors up on the day:
Interestingly enough, financial stocks were the strongest. It will be important to observe today if there is follow-through with some of the biggest US bank stocks due to report their Q3 earnings (see Calendar at top of this mail).
Zooming out a little, it seems that the small bullish divergence between price and momentum we discussed yesterday now also got company from a bullish engulfing pattern:
So, was this THE bottom? Perhaps, but probably not. Was that A (tradable) bottom? You bet.
We usually do not discuss corporate and company-related news in this space (our life is complicated enough and this document too long already concentrating on cross-asset/macro happenings alone), but given the earnings seasoning getting underway, some exceptions may apply over the coming weeks. Three positive reactions stand out yesterday, with Domino’s Pizza (earnings), Netflix (new ad-supported subscription model) and Albertson (M&A with Kroger) all up strongly on the day, hinting at investors’ eagerness to interpret news positively.
Asian markets are unsurprisingly fully reflecting Wall Street’s strong Thursday template this early Friday morning, with the average gain north of two percent for the regional benchmarks.
Both, European and US index futures are also firmly in positive territory.
In fixed income markets, the further inversion of the yield curve in the US post-CPI print is probably most noteworthy. Deep, deep negative inversion on the 10y-2y measure:
But still not fully inverted on the 10y-3m measure:
Seems a matter of time only though …
Yields lowered in both Europe and the UK, with the latter getting some more focus, with D-Day today for British pension fund managers (remember BoE Governor Bailey’s warning earlier this week). The UK chancellor Kwasi Kwarteng apparently left the ongoing IMF meeting early to return to London, which is sparking some rumours about yet another “amendment” to the government’s budget proposal. It will be hence of interest to follow UK Gilt yields today, here’s the 10-year version:
And of course we should also keep an eye on the Sterling (noticed how elegantly I moved into the FX section?), to measure levels of distress. Here’s the chart of the Cable:
This (circled) is definitely the price behaviour of a market gone kaputt.
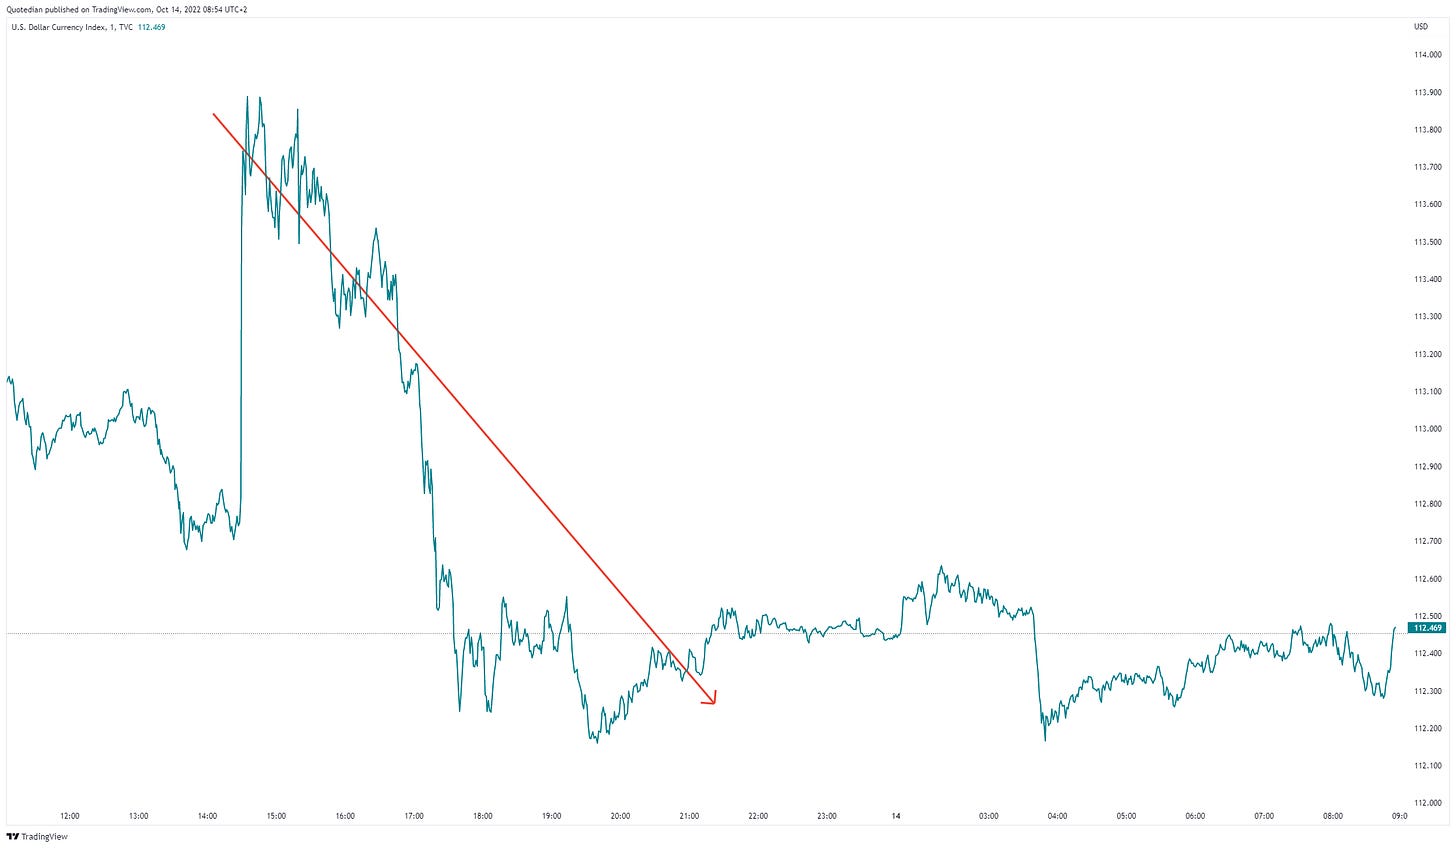
It is also noteworthy, that about the same time stocks started heading higher yesterday, the US Dollar also started weakening:
The weaker greenback was probably (maybe / perhaps / who knows) not the trigger to the equity rally, but definitely a very necessary ingredient.
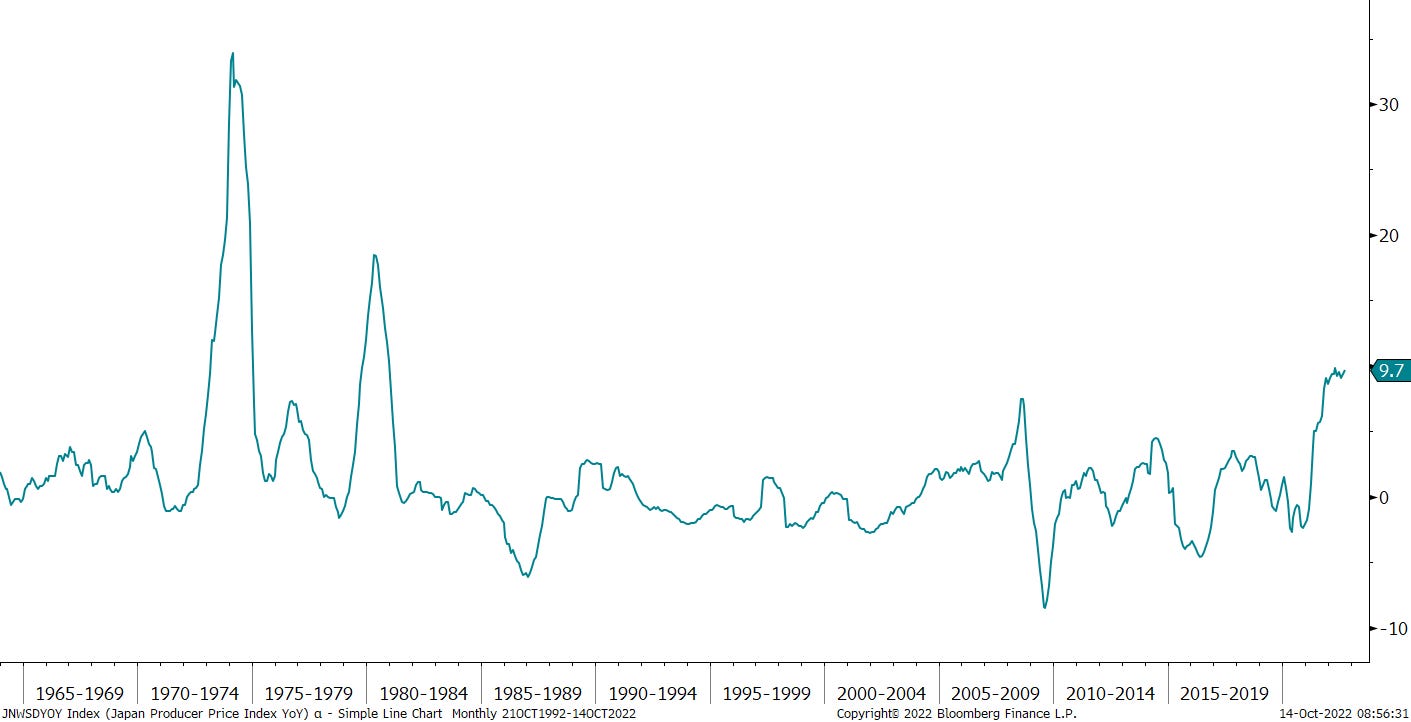
Elsewhere, Japanese PPI was reported at 9.7%, well above the previous month’s 9.0% and especially also above the 8.9% expected by economists. This is the highest reading since, wait for it, 1980! Even I was still young then:
But, that does not keep the BoJ from continuing to exert yield curve control at the 10-year term, which is leading to this ever larger spread between (government-controlled) JGB bond yields (green) and “freely” trading swap rates (blue):
Also, this week, the 10-year JGB went for four consecutive days without trading a single issue! Signs of a nationalized bond market …
There is much more, but I need to hit the Send button. But do not despair, Sunday afternoon and hence The Quotedian weekly review, long-play edition are just around the corner!
Enjoy your weekend,
André
CHART OF THE DAY
Here’s some more bull-fodder for the wanna-be-optimist amongst us:
From Jeff Hirsch at Almanac Trader:
Not all indices have bottomed on the same day for all bear markets, but the lion’s share, or bear’s share I should say, bottomed in October.
Of the 23 bear markets since WWII 8 have bottomed in October for DJIA and 7 for S&P 500, 6 for NASDAQ, significantly more than any other month. Over all three indices, 7 were in midterm October: 1946, 1960, 1966, 1974, 1990, 1998 & 2002.
DJIA October bottoms: 1946, 1957, 1960, 1966, 1987, 1990, 2002 & 2011. S&P October bottoms: 1957, 1960, 1966, 1974, 1990, 2002 & 2011. NASDAQ October bottoms: 1974, 1987, 1990, 1998, 2002 & 2011.
The month with the next largest amount of bear market lows is March with 4 for S&P 500 – mostly recently in 2009 and 2020, previously in 1978 & 1980. So, odds are a bottom is near.
Thanks for reading The Quotedian! Subscribe for free to receive new posts and support my work.
DISCLAIMER
Everything in this document is for educational purposes only (FEPO)
Nothing in this document should be considered investment advice
Past performance is hopefully no indication of future performance


